
I did have my old data and model runs of course, in fact they were spread over several directories on two machines. I’m going to refer to it by this catalog designation, KUG standing for the “Kiso survey of Ultraviolet-excess Galaxies.” It’s also a low power radio source with catalog entries in both FIRST and NVSS, and of course it’s in MaNGA with plateifu ID 8440-6104 (mangaid 01-216976).
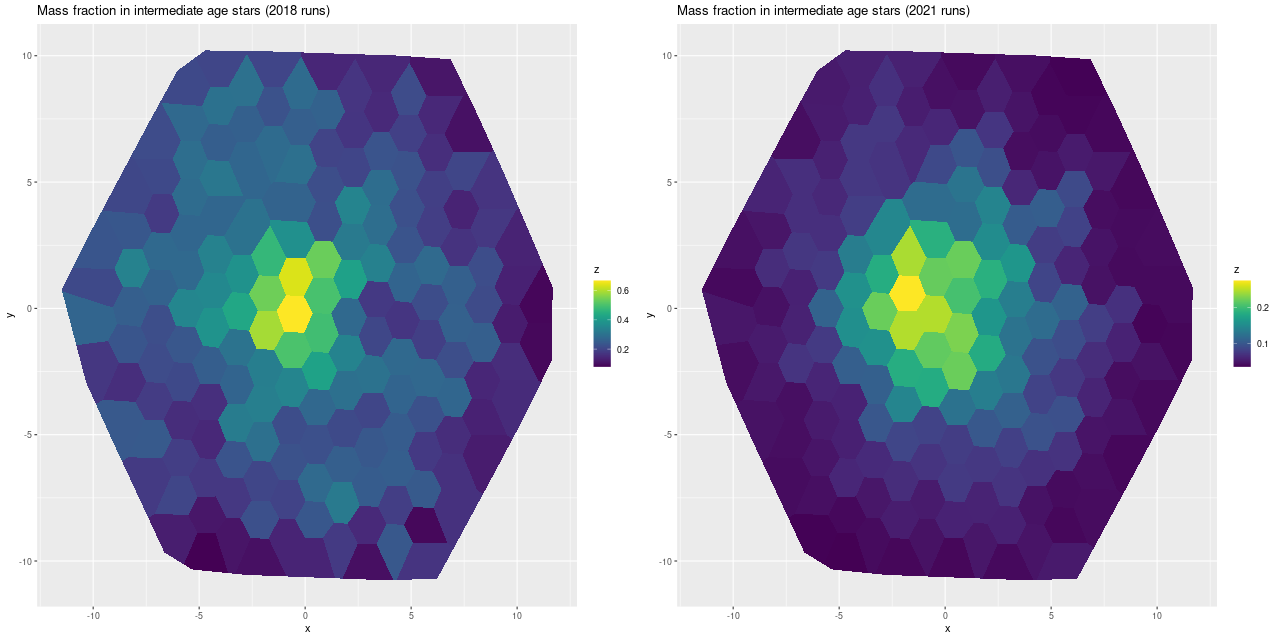
In my 2018 model runs, which were interesting enough to write 3 posts about, I found this galaxy had undergone an extraordinarily large burst of star formation that began ~1 Gyr ago with locally as much as 60% of the present day stellar mass born in the burst and something like 40% of the mass over the footprint of the IFU. In this years model runs the peak burst fraction was a considerably more modest ~25% and globally barely amounted to a slight enhancement of star formation. The starburst was also much more localized than in the earlier runs:
So what happened? First, here is a comparison of modeled star formation histories for the innermost fiber, which got the largest injection of mass in the starburst.
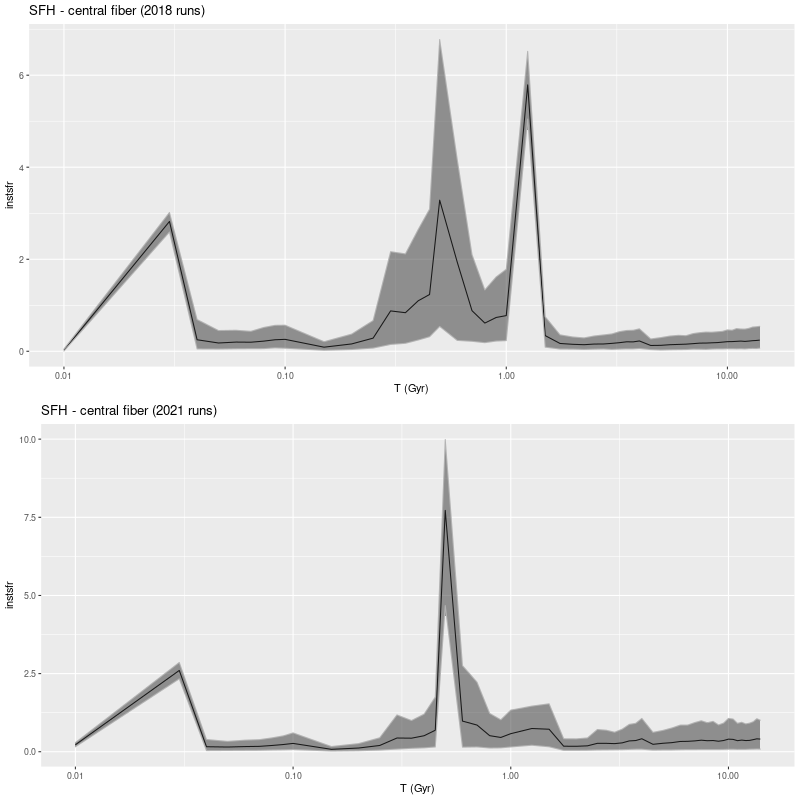
The obvious remark is the double peaked starburst noted back in 2018 (and discussed at some length) has been replaced with a single narrow peak with a slow ramp up and fast decay. The peak SFR is a little larger than before but the total mass in the burst is lower.
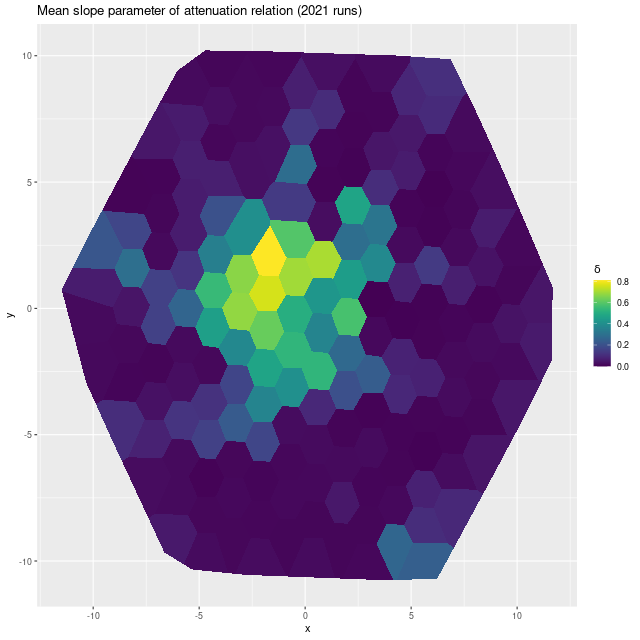
I’ve made several changes in model formulation since 2018, of which the most important in the current context is adopting the more flexible “modified Calzetti” attenuation relation that adds an additional slope parameter to the prescription. In the current year model runs a steeper than Calzetti relation is favored throughout the IFU footprint, particularly in the central region where the starburst was strongest:
A smaller optical depth of attenuation is also favored throughout:
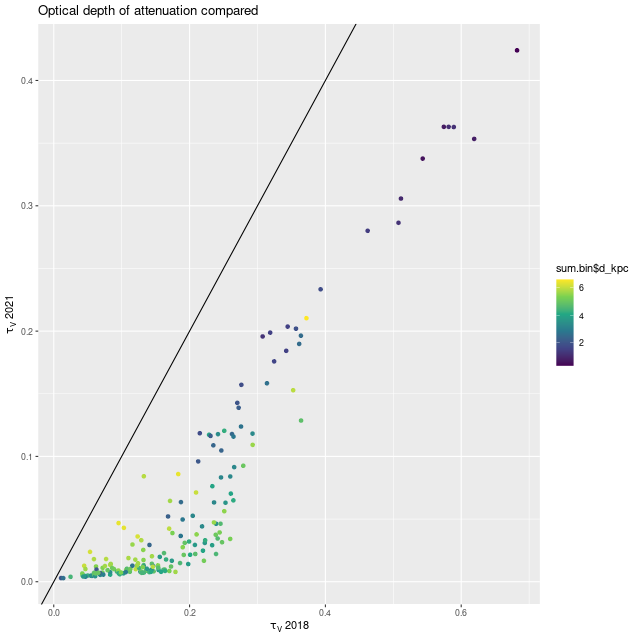
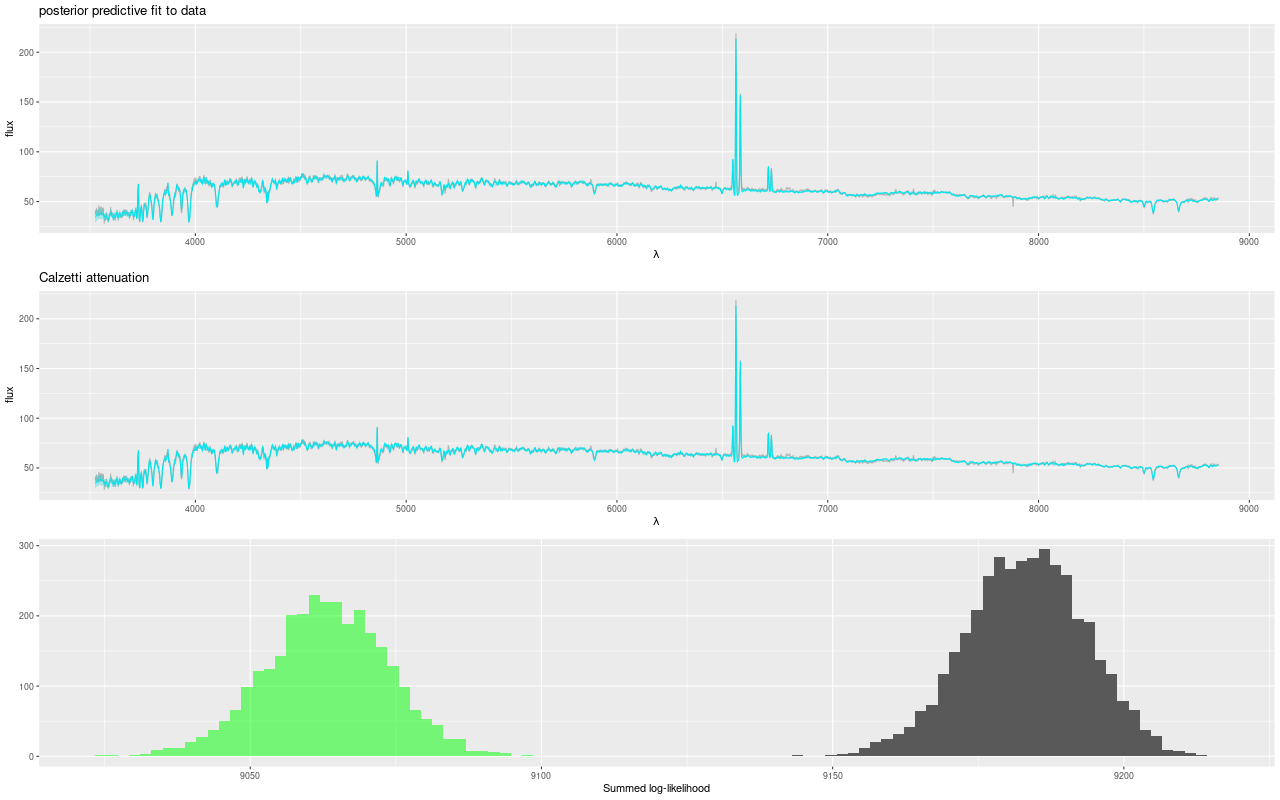
This has a couple predictable consequences. Steeper attenuation will favor an intrinsically bluer, hence younger population while a lower optical depth requires less light, and hence mass in the stellar population. I can test this directly by returning to a model with Calzetti attenuation, and here is the result for the central fiber (this model run is labeled 2021 (c) in the legend below):
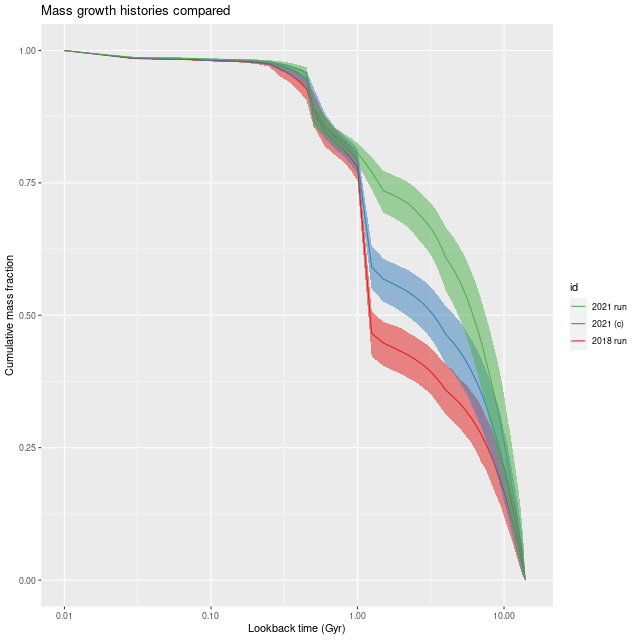
So, an eyeball analysis suggests about 3/4 of the difference between the 2018 and 2021 runs is due to the modification to the attenuation relation. The other changes I’ve made to the models are to change the stellar contribution parameters from a non-negative vector to a simplex, and at the same time changing the way I rescale the data. In early runs the SSP model fluxes were scaled to make the maximum stellar contribution ≈ 1, while the current models scale both the galaxy and SSP fluxes to ≈ 1 in the neighborhood of V, making the individual stellar contributions approximately the fraction of light contributed. An additional scale factor parameter in the model is used to adjust the overall fit. Assuming I did this right this should have no effect on a deterministic maximum likelihood solution, but with MCMC who knows?
Although the fit to the data looks about the same between the model with and without the attenuation modification the summed log-likelihood is consistently about 1% higher for the modified Calzetti model with no overlap at all in the distribution of likelihood. This suggests the case for a steeper than Calzetti attenuation is a fairly robust result.
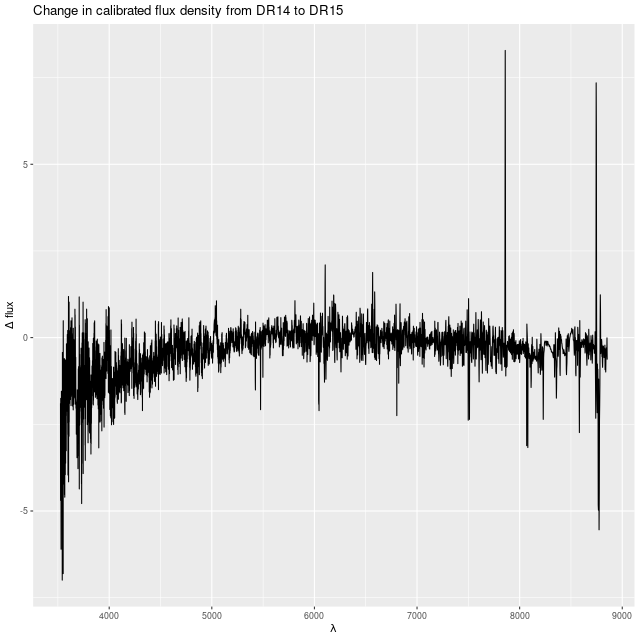
The galaxy flux data also changed a little bit. The early runs were on the DR14 release (version 2_1_2 of the MaNGA DRP) while the recent ones used the DR15 release (ver 2_4_3). Most of the calibration differences resemble random noise, but there is some curvature that systematically affects both the red and blue ends of the spectrum and could cause some change in the temperature distribution of the models:
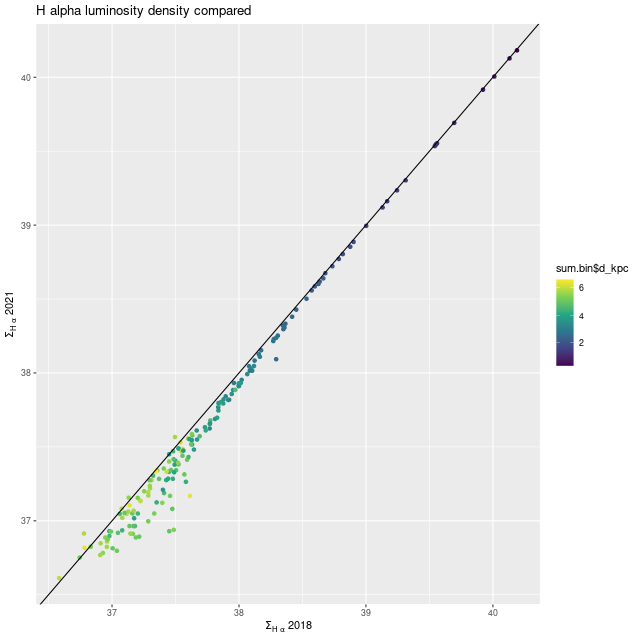
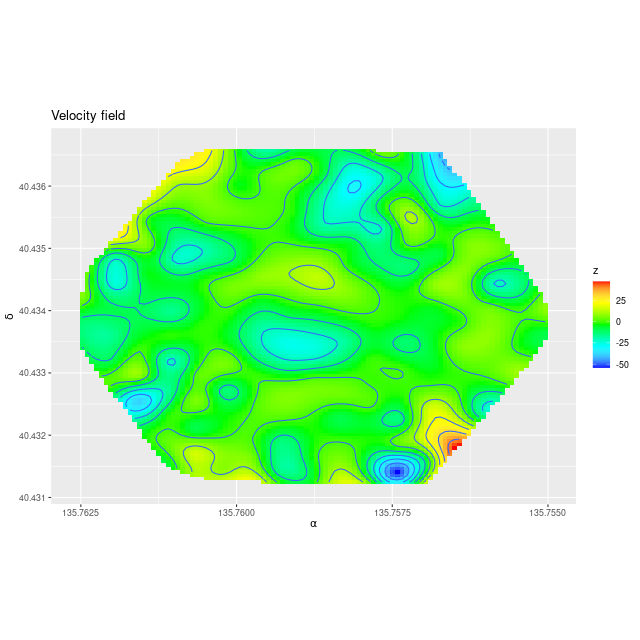
While the detailed star formation histories changed, quantities that aren’t too model dependent didn’t very much. One example is shown below. Also, the kinematic maps agree with the earlier ones in detail.
One input that hasn’t changed are the emiles SSP model spectra, although there have been some procedural changes in how I handle the modeling. Early on I often used a much smaller subset of SSP models with just 27 time bins and 3 metallicities for preliminary modeling, including my first models on the same binning of these data. I also routinely ran 250 warmup iterations with just 250 more per chain. My current standard practice is always to use the largest emiles subset with 216 SSP models in 54 time bins and 4 metallicities, and I generally run 750 post-warmup iterations per chain but still with only 250 warmup iterations. This is generally enough and if adaptation fails it is usually fairly obvious. The small sample size of the earlier runs mostly effects the precision of inferences rather than means.
To conclude for now, my speculation about whether it might be possible to say something about the timing of critical events in a merger from the model star formation history was too optimistic. On a positive note though both sets of model runs retrodict that coalescence occurred at a lookback time around 500Myr ago, which is consistent with the fact that tidal tails and other merger signatures are clearly visible even in SDSS imaging. Both sets of model runs also have that odd uptick in star formation at 30Myr in the central fiber. And while the difference in burst mass contributions is a little disconcerting the current runs are more consistent with the likely gas content of ordinary spiral galaxies.
This example illustrates another well known “degeneracy” among attenuation (and adopted attenuation relation), mass, and stellar age. Whether I’ve broken the degeneracy by adopting the more flexible attenuation prescription described some time ago remains to be validated.