
In part two of this series that I began here I’m going to look at various quantities derived from the modeled star formation histories and emission line fits. Later I’ll dive into some selected recent literature on major gas rich mergers and do some comparisons. I’m especially interested in whether the model star formation histories have anything to tell us about the chronology of the merger and the nature of the progenitors.
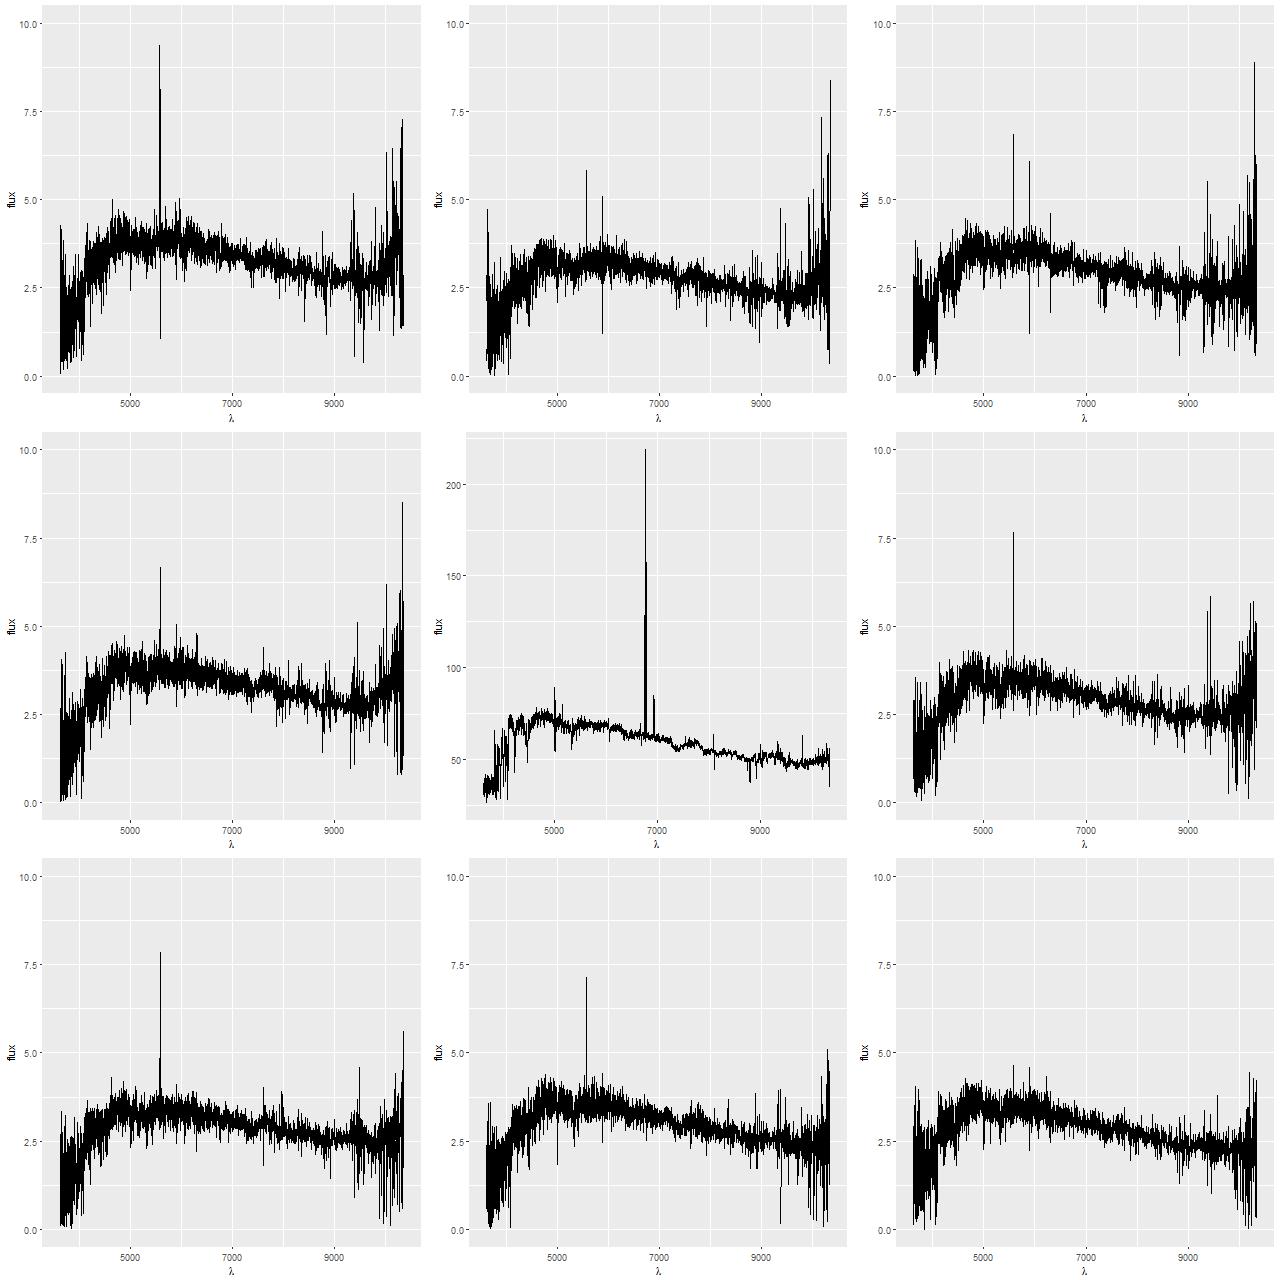
First, here is a representative sample of spectra. These are reduced to the local rest frame and fluxes are corrected for foreground galactic extinction but not any internal attenuation. The middle spectrum in the second row is from the central fiber/pointing combination (remember these are from the stacked RSS data). The peripheral spectra are roughly equally spaced along a ring about 7″ or 4kpc from the center.
The central spectrum does show moderately strong emission lines along with fairly strong Balmer absorption, which points to some ongoing star formation along with a significant intermediate age population. Emission lines are evidently lacking or very weak in the peripheral spectra (most of the spikes are terrestrial night sky lines or simply noise), indicating the galaxy is currently passively evolving at 4kpc radius. In more detail…
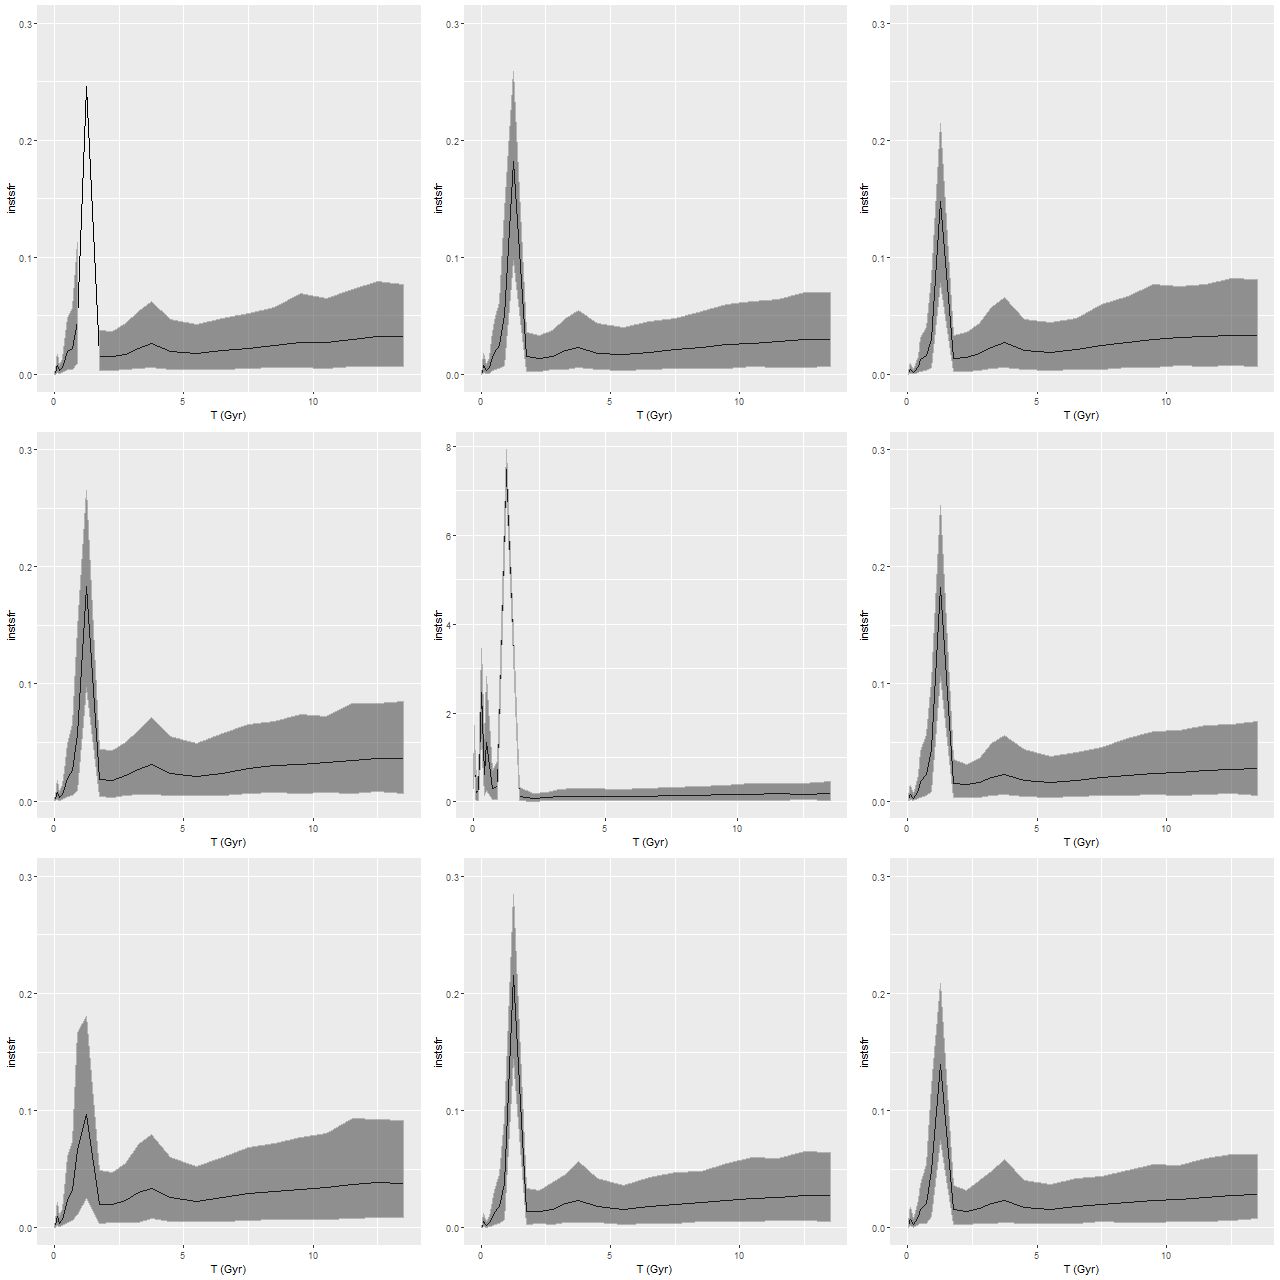
The most basic but also finest grain quantities I look at are posterior estimates of star formation histories and mass growth histories. These contain similar, but not quite the same information content. I show star formation histories as the “instantaneous” star formation rate vs. look back time defined as the total stellar mass born in an age bin divided by its width in years.
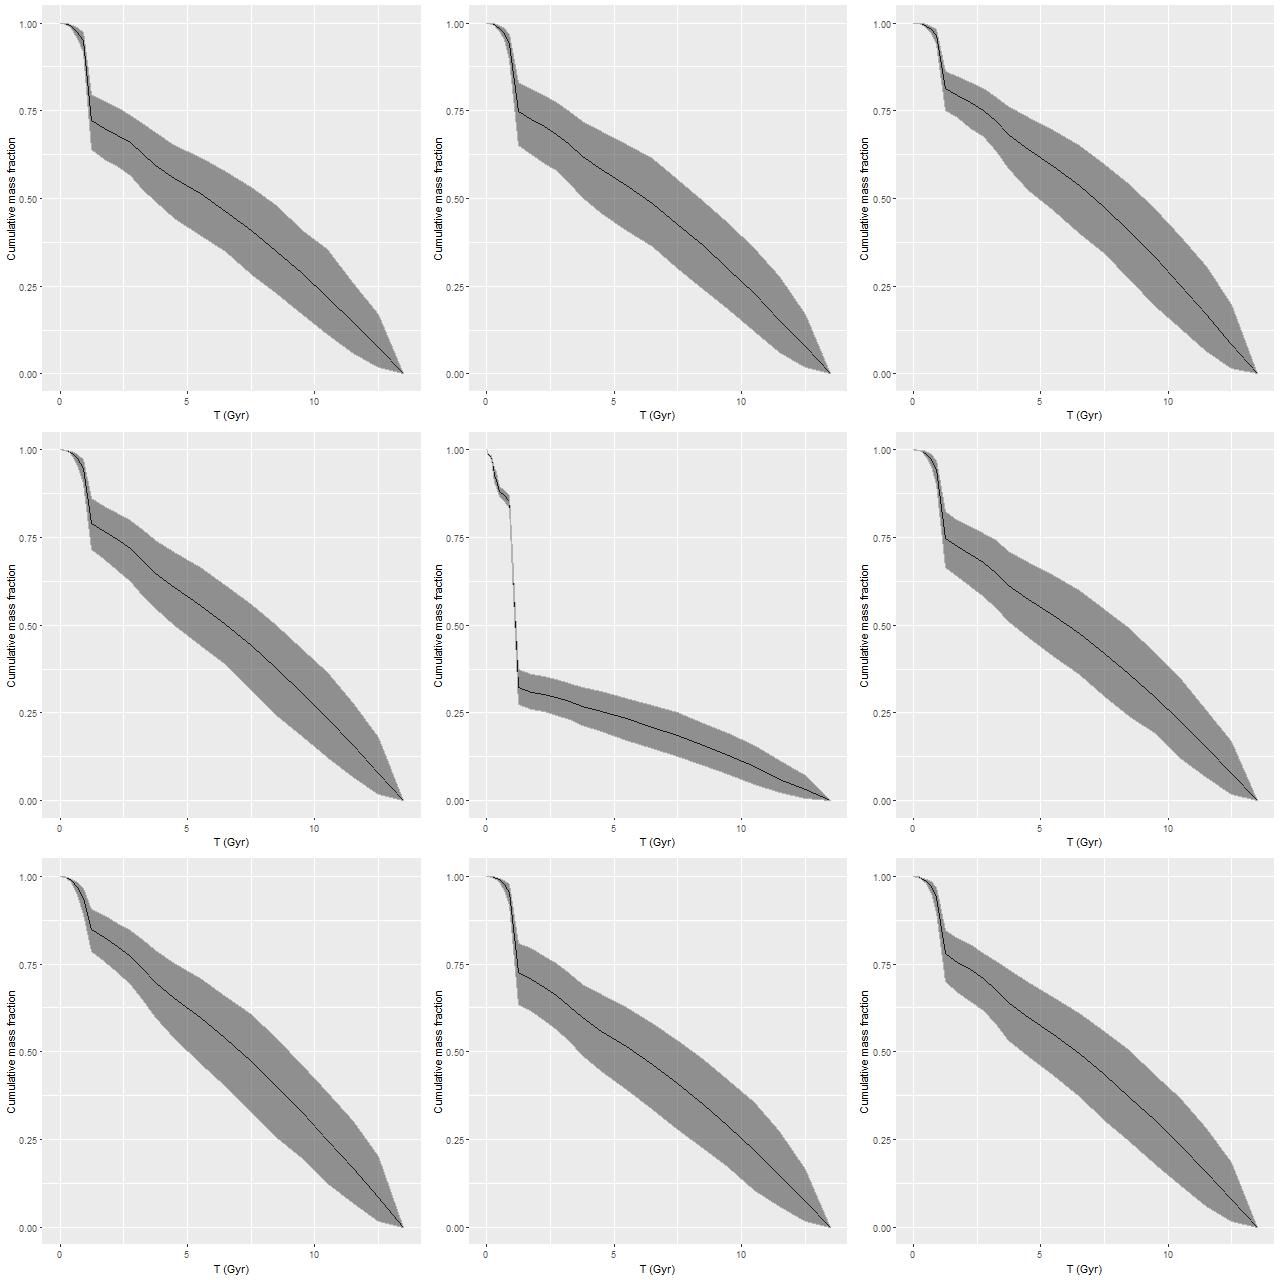
Mass growth histories estimate the cumulative fraction of the present day stellar mass. These incorporate a recipe for mass loss to stellar evolution and as such aren’t quite integrals of the star formation histories. By convention remnant masses are included in stellar mass, and there are recipes for this as well (in this case taken from the BaSTI web page). I display posterior marginal means and 95% confidence intervals for both of these against time.
I think I first encountered empirical estimates of mass growth histories in McDermid et al. (2015), although earlier examples exist in the literature (eg Panter et al. 2007). I may be the first to display them for an individual galaxy at the full time resolution of the input SSP library. Most researchers are reluctant to make detailed claims about star formation histories of individual galaxies based on SED modeling. I’m not quite so inhibited (not that I necessarily believe the models).
The most obvious feature in these is a burst of star formation that began ≈1.25 Gyr ago that was centrally concentrated but with enhanced star formation galaxy wide (or at least IFU footprint wide). In the central fiber the burst strength was as much as 60%, with the amplitude fading away with distance. Is this percentage plausible? First, just summing over all fibers the mass formed during and after the initial burst is about 1/3 of the present day stellar mass. This probably overestimates the burst contribution since the galaxy extent is considerably larger than the IFU and the outer regions of the progenitors likely experienced less enhanced star formation, but even 1/3 is consistent with the typical neutral hydrogen content of present day late type spirals. I will look at the merger simulation literature in more detail later, but simulations do predict that much of the gas is funneled into the central region of the merger remnant where it’s efficiently converted into stars, so this is broadly consistent with theory. But second, I have some evidence from simulated star formation histories that the presence of a late time burst destroys evidence of the pre-burst history, and this leads to models underestimating the early time mass growth. This could have an ≈0.1 dex effect on the total stellar mass estimate.
Most of the SFH models show more or less monotonically declining star formation rates after the initial burst, but the central fiber shows more complex late time behavior with several secondary peaks in star formation rate. It’s tempting to interpret these literally in hopes of constraining the timeline of the merger. In the next post I’ll look at this in more detail. One limitation of this set of models is the coarse time resolution. I only used half the available SSP ages from the EMILES/BaSTI library — the critical 1.25Gyr model in particular is 350Myr wide, which is a significant fraction of the expected timescale of the merger. Next time I’ll look at the results of some higher time resolution model runs.
I look at a large and still growing number of quantities derived from the models. For visualization it’s sometimes useful to create maps like the ones I showed in the first post on this galaxy. Many interesting properties of this particular galaxy are fairly radially symmetric with strong radial trends, so simple scatter plots are most effective.
I posted several graphs in a post on the current GZ Talk. Since those posts I’ve learned how to do Voronoi binning by translating Cappellari’s Python code to R. I also noticed that some of the EMILES spectra are truncated in the red within the range I was using for SED fitting, so I trimmed it to a wavelength range with strictly positive model fluxes (currently rest frame wavelengths 3465-8864 Å) and reran the models on the binned data. Binning has little effect on the results since out of 183 fiber/pointing combinations I ended up with 179 binned spectra. There are small changes due to the reduced wavelength range.
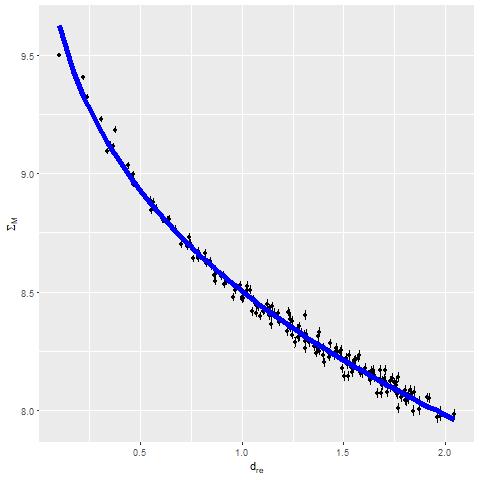
One of the more interesting plots I posted there was the estimated stellar mass density (in log solar masses/kpc^2) against radius (measured in effective radii; the effective radius from the drpall catalog is 5.48″ or about 3.2 kpc). The updated plot is below. The blue line is a single component Sersic model with Sersic index n=3.35 from a nonlinear least squares fit using the R function nls() (no Bayes this time). This is close enough to a deVaucouleurs profile (n=4) and definitely not disky (n=1). I will someday get around to comparing this to a photometric decomposition — they should be similar, although this fit is undoubtedly affected by the low spatial resolution of the IFU data.
The other plots I posted there included the star formation rate density (in \(M_\odot/yr/kpc^2\), averaged over an arbitrarily chosen 100 Myr) against radius and Hα luminosity density (uncorrected for internal attenuation) against radius:
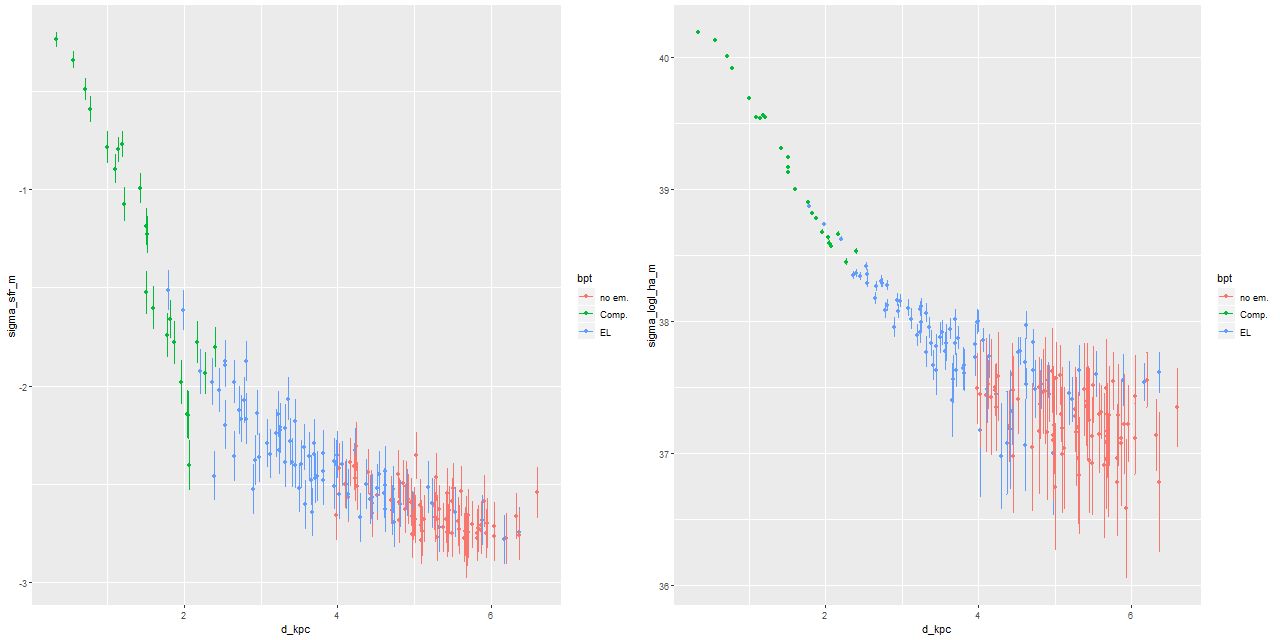
The trends look rather similar, which leads to the obvious (SFR density vs. luminosity density):
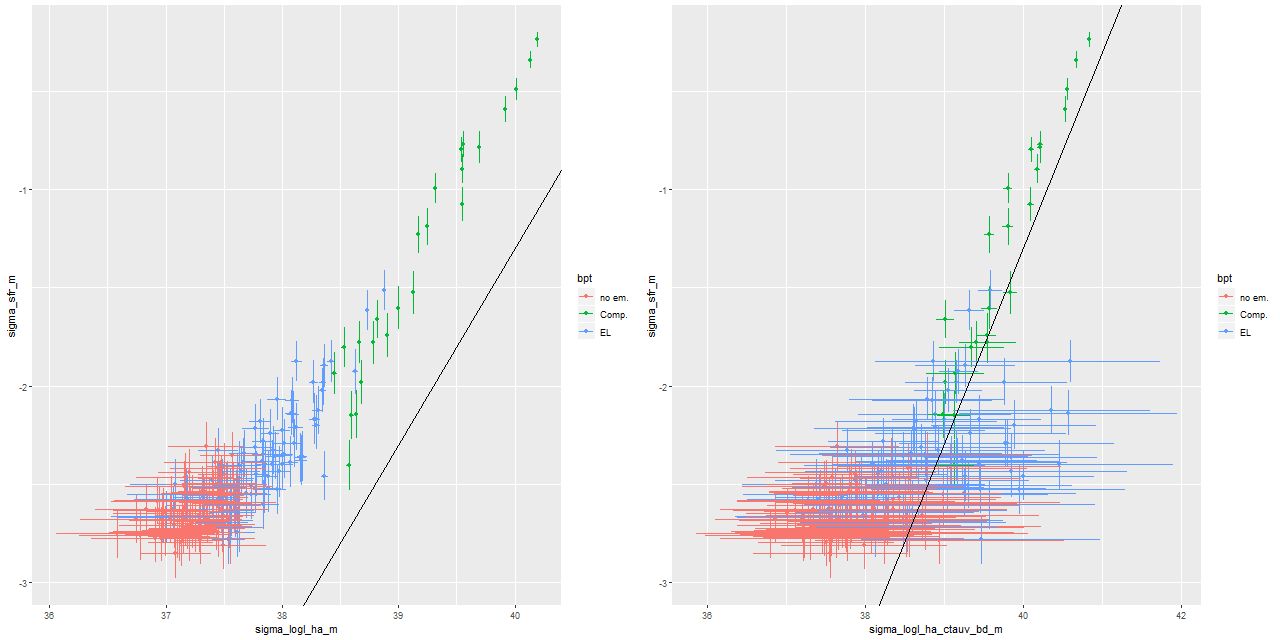
This is one of the more remarkable and encouraging results of these modeling exercises — the star formation rate estimates come entirely from the stellar component fits and are for an order of magnitude longer time scale than is probed by Hα emission. Optical SED fitting is rarely considered suitable for estimating the recent star formation rate, yet we see a tight linear relationship between the model estimates and Hα luminosity, one of the primary SFR calibrators in the optical, that only begins to break down at the lowest luminosities. In the right pane Hα is corrected for attenuation using the Balmer decrement with an assumed intrinsic Hα/Hβ ratio of 2.86. The straight line in both graphs is the Hα-SFR calibration of Moustakas, Kennicutt, and Tremonti (2006) with a 0.2 dex intercept shift to account for different assumed IMFs. At the well constrained high luminosity end most of the points appear to lie above the relation, which could indicate that recent star formation has declined relative to the 100Myr average (or of course it could be a fluke).
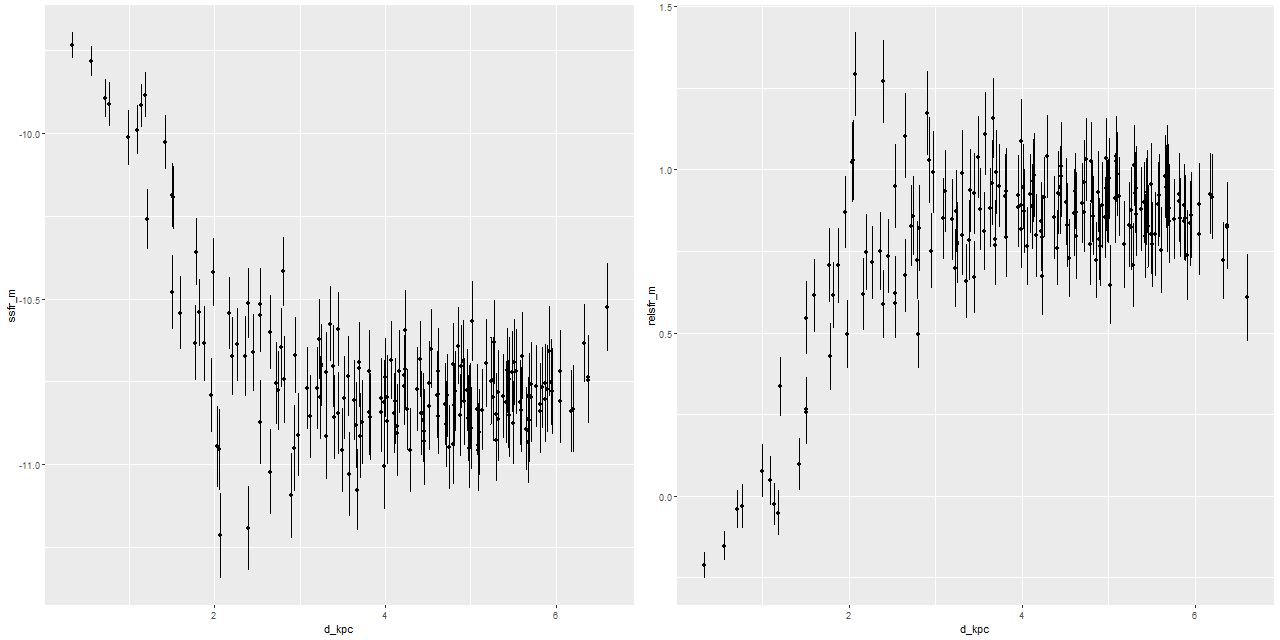
Two other measures of star formation rate I track are specific star formation rate, that is SFR divided by stellar mass (which has units of inverse time), and relative star formation rate, SFR divided by the average SFR over cosmic time. Trends with radius (note that these and just about all other quantities I track are scaled logarithmically):
On longer time scales I track the stellar mass fraction in broad age bins (this has been the customary sort of quantity reported for some years). Here is the intermediate age mass fraction (0.1 < T ≤ 2.3 Gyr), which basically measures the burst strength for this galaxy:
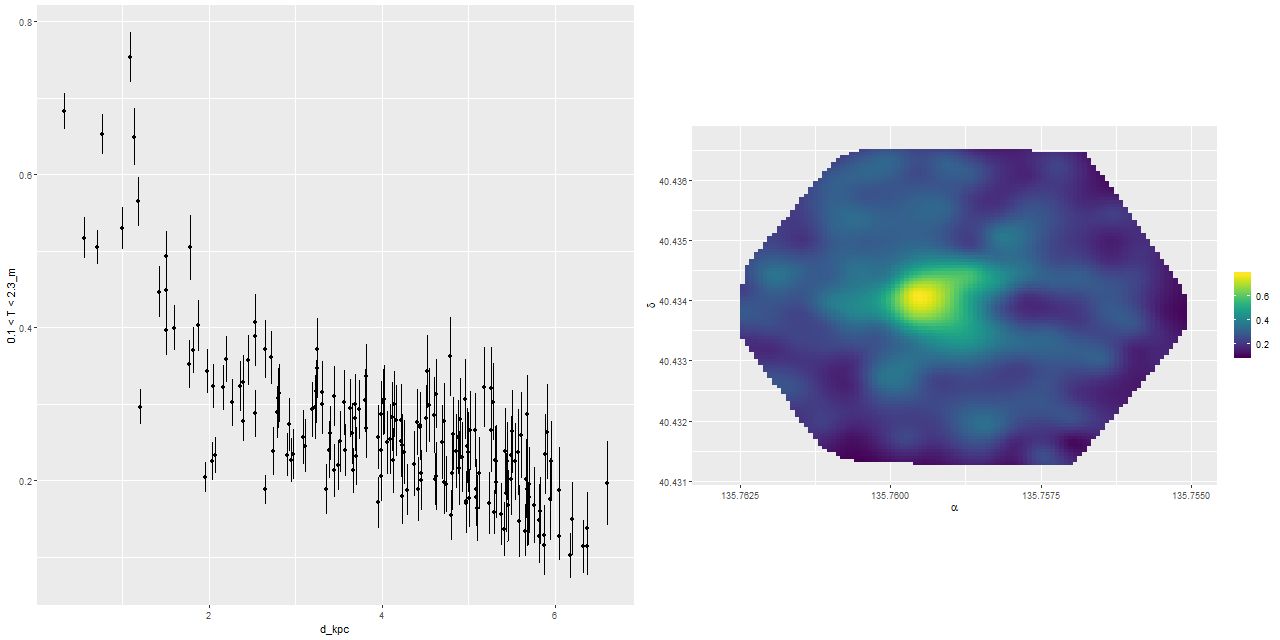
Oddly, the peak burst strength is somewhat displaced from the photometric center.
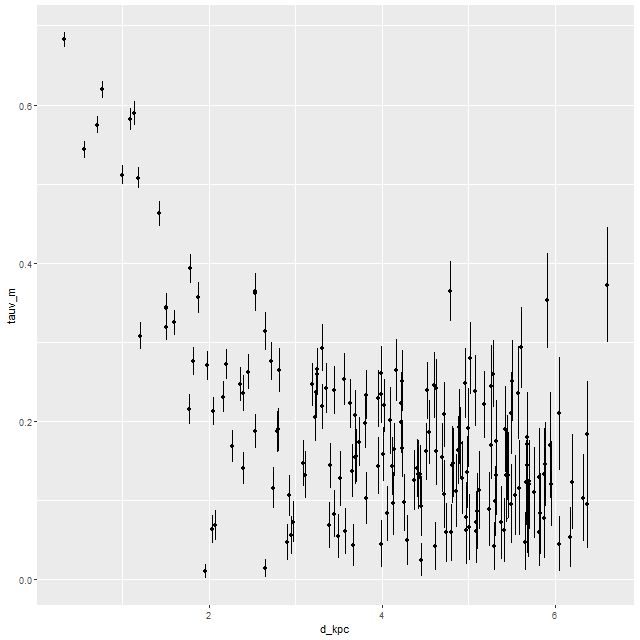
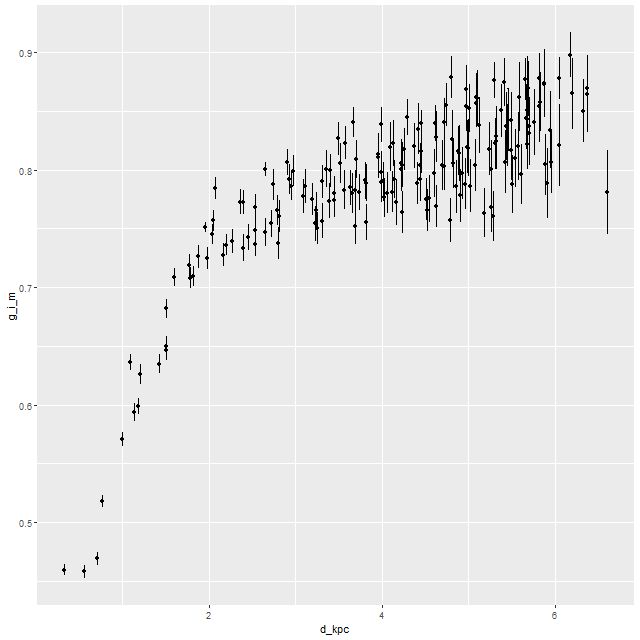
For completeness, here are trends of the modeled optical depth of stellar attenuation and intrinsic g-i color (a long wavelength baseline color serves as a rough proxy for specific star formation rate):
This is very similar to the color trend calculated from the spectral cubes I showed in the first post.
Finally, in recent months I have begun to track several “strong line” gas phase metallicity indicators. Here is an oxygen abundance estimate from the O3N2 index as calibrated by Pettini and Pagel (2004). Astronomers present “heavy” element abundances in the peculiar form 12 + log(O/H) where O/H is the number ratio of Oxygen (or other element) to Hydrogen.
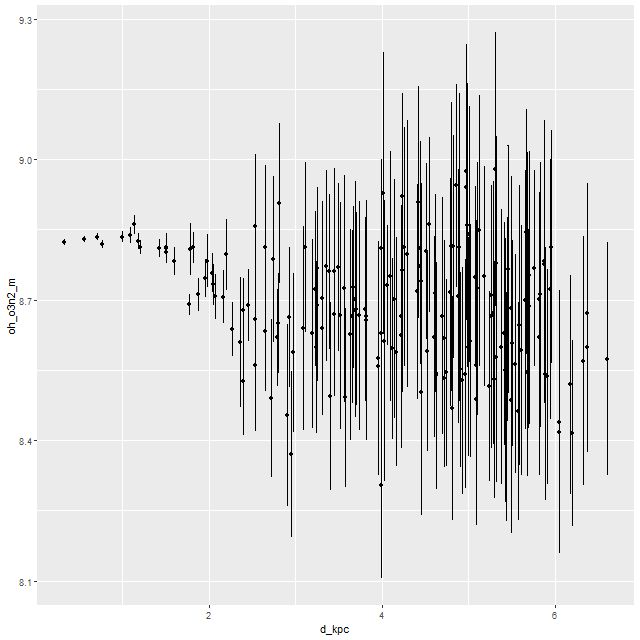
Unlike just about everything else there’s no clear abundance trend here, although the precision drops dramatically outside the central few kpc. For reference the solar Oxygen abundance (which is surprisingly unsettled) is around 8.7, so the gas phase metallicity is around or perhaps a little above solar.
So, to summarize, there was a powerful burst of star formation that began ~1Gyr ago that was clearly triggered by a gas rich major merger. The starburst was centrally concentrated but enhanced star formation occurred galaxy wide (perhaps not uniformly distributed). Star formation is ongoing, at least within the central few kiloparsecs, although there is some evidence that it is fading now and is certainly much lower than the peak.
The stellar mass distribution is elliptical-like although perhaps not quite fully relaxed to a new equilibrium. As we saw in the previous post there is no evidence of regular rotation, although there is a rotating kinematically decoupled core that coincides in position with the region where the starburst was strongest.
Next post I’ll look at some of the recent merger literature, and also show some results from higher time resolution modeling.