
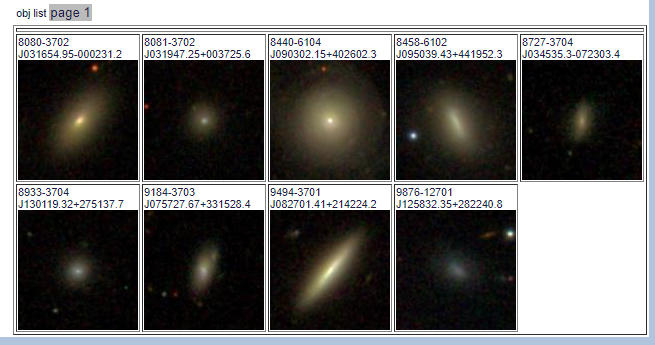
This paper (arxiv ID 2103.16070) is pretty old by now, having been posted on arxiv back in early April. The basic premise of the work is mildly interesting: the author searched MaNGA for galaxies that would meet conventional criteria for post-starburst (aka K+A etc.) spectra if observed at a redshift high enough that the entire galaxy would be covered by a single fiber like the original SDSS spectroscopes. Somewhat surprisingly, he found just 9 that met his selection criteria in the DR15 sample of ~4500 galaxies.
I have to say the paper itself is forgettable, but a manageably sized sample of MaNGA data that’s complete by some criterion is worth a look, and I have a long-standing interest in post-starburst galaxies in particular. So, I ran my current SFH modeling code on all 9 — by the way this was completed some time ago. It’s just taken me a while to get around to generating some graphics and sitting down to write.
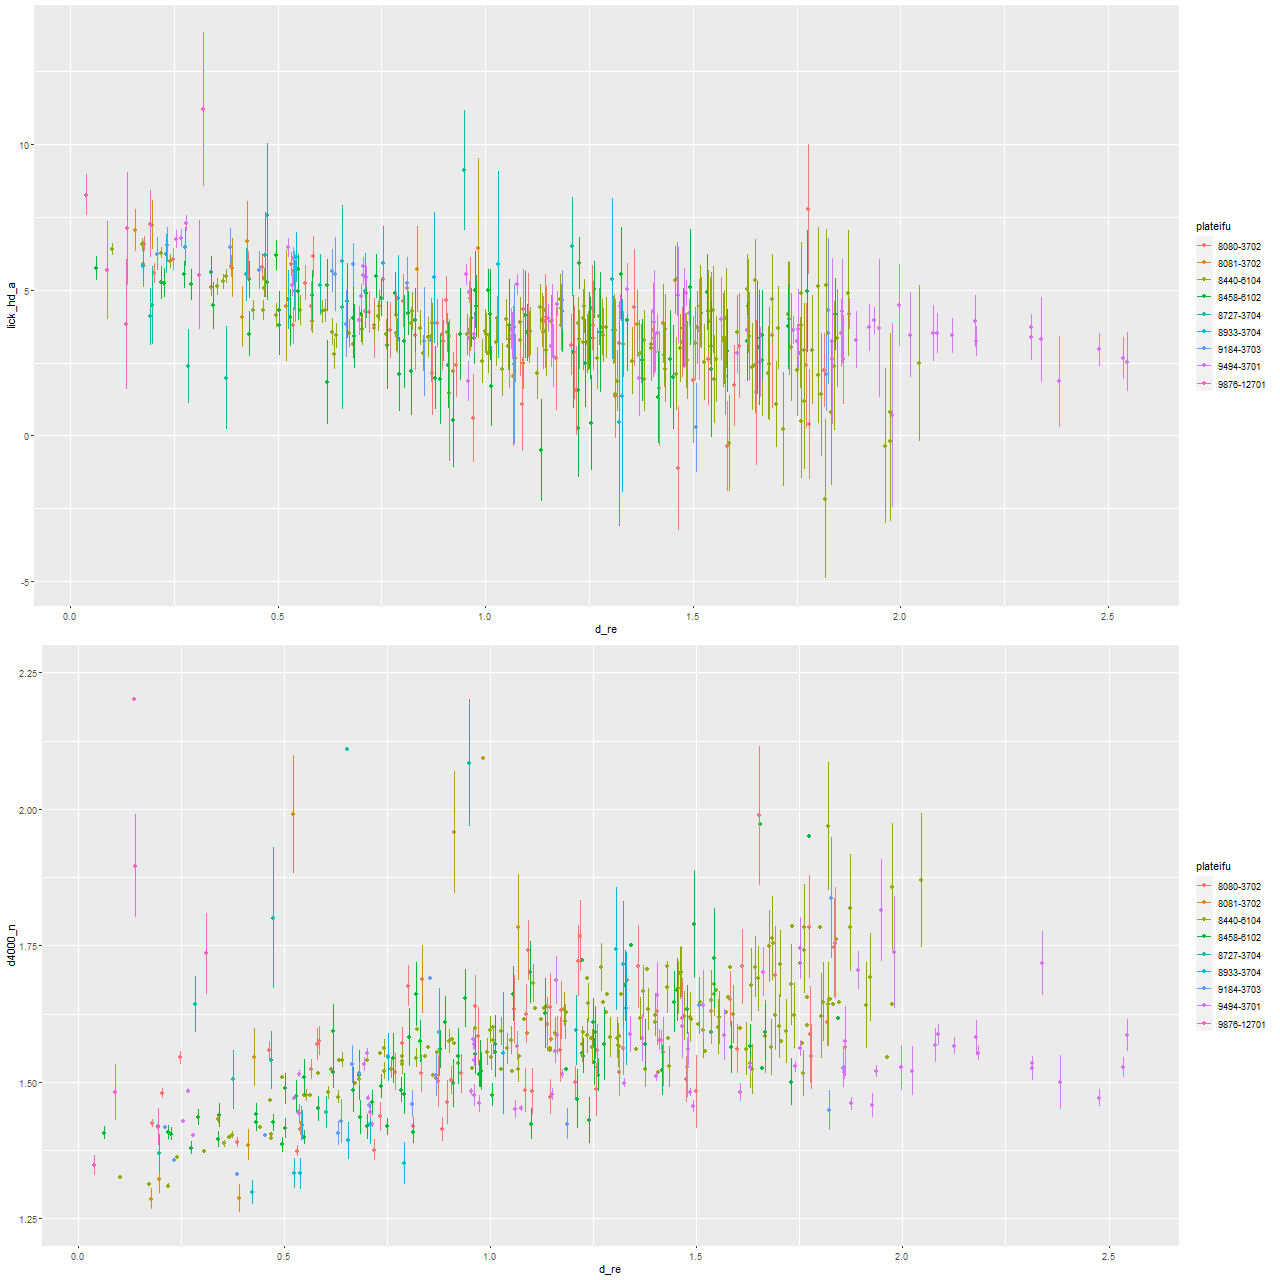
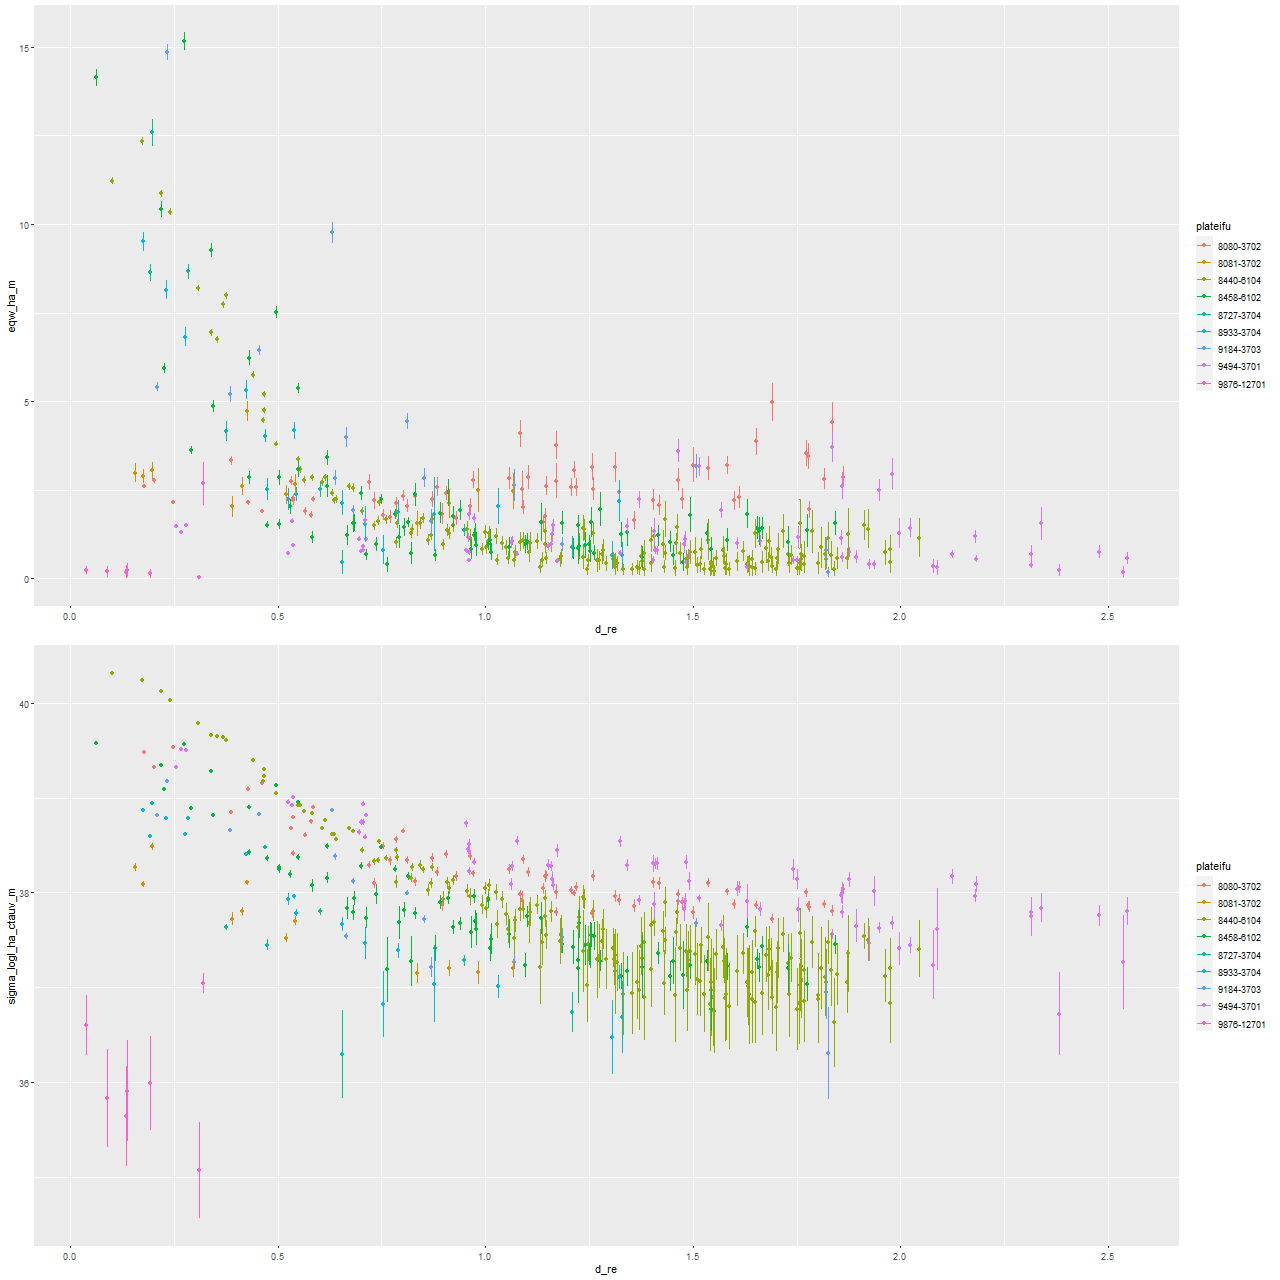
The author only measured a few observable quantities: Hδ equivalent width and the 4000Å break index Dn(4000), along with Hα emission equivalent width and (normalized) fluxes. I long ago validated my own absorption line measurements of SDSS single fiber spectra against the MPA-JHU measurement pipeline, which was the gold standard for several years (but last run on DR8). My measurements and uncertainty estimates are in excellent agreement with theirs, so I have a fair amount of confidence in them. Emission line fluxes also agree with published measurements with considerably more scatter. My emission line equivalent widths on the other hand are completely unchecked. So, one of my tasks was to compare my equivalent width measurements with Wu’s. I did not attempt to exactly reproduce his work – I binned spatially using my usual Voronoi partitioning approach whereas Wu binned in elliptical annuli. With that difference in mind the next two plots should be compared to his Figures 4 and 5.
The first two graphs show the radial trends (relative to the effective radii per the NASA/SLOAN catalog) in the Lick HδA and Dn(4000) indexes. These both show very similar trends to Wu’s measurements although with more scatter. This is expected because fewer spectra go into each point in general — from the text it appears Wu binned several separate measurements for each displayed point. Also, I made no attempt to deproject distances. One feature of the Hδ versus radius plot that’s a little different is the trend generally flattens out beyond ∼1 effective radius, while Wu shows a roughly linear trend out to 1.5 Re. This might just be a visible effect of me displaying the trends out to larger radii.
The Hα emission line measurements are similarly in broad agreement. Like Wu, I find that there are two distinct trends in emission: either moderately strong centrally with a rapid decline or weak throughout with a relatively flat trend. One galaxy (with MaNGA plateifu 9876-12701) has no detectable emission. I haven’t looked in detail at emission line ratios to compare to Wu’s Figure 7, but there’s general agreement that some residual star formation is present in some of the sample and weak AGN or ionization by hot evolved stars in others.
A fairly common failing of this literature (IMO) is the use of proxies for recent star formation but not attempting actually to model star formation histories. There are plenty of publicly available tools for that available now, so there’s really no reason not to perform such modeling exercises. Wu did do some toy evolutionary modeling and posted a graph of trajectories through the Hα emission – Hδ absorption plane, which can scarcely unambiguously constrain star formation histories. Of course much of my hobby time is spent generating fine grained model star formation histories, so let’s take a look at a few selected results.
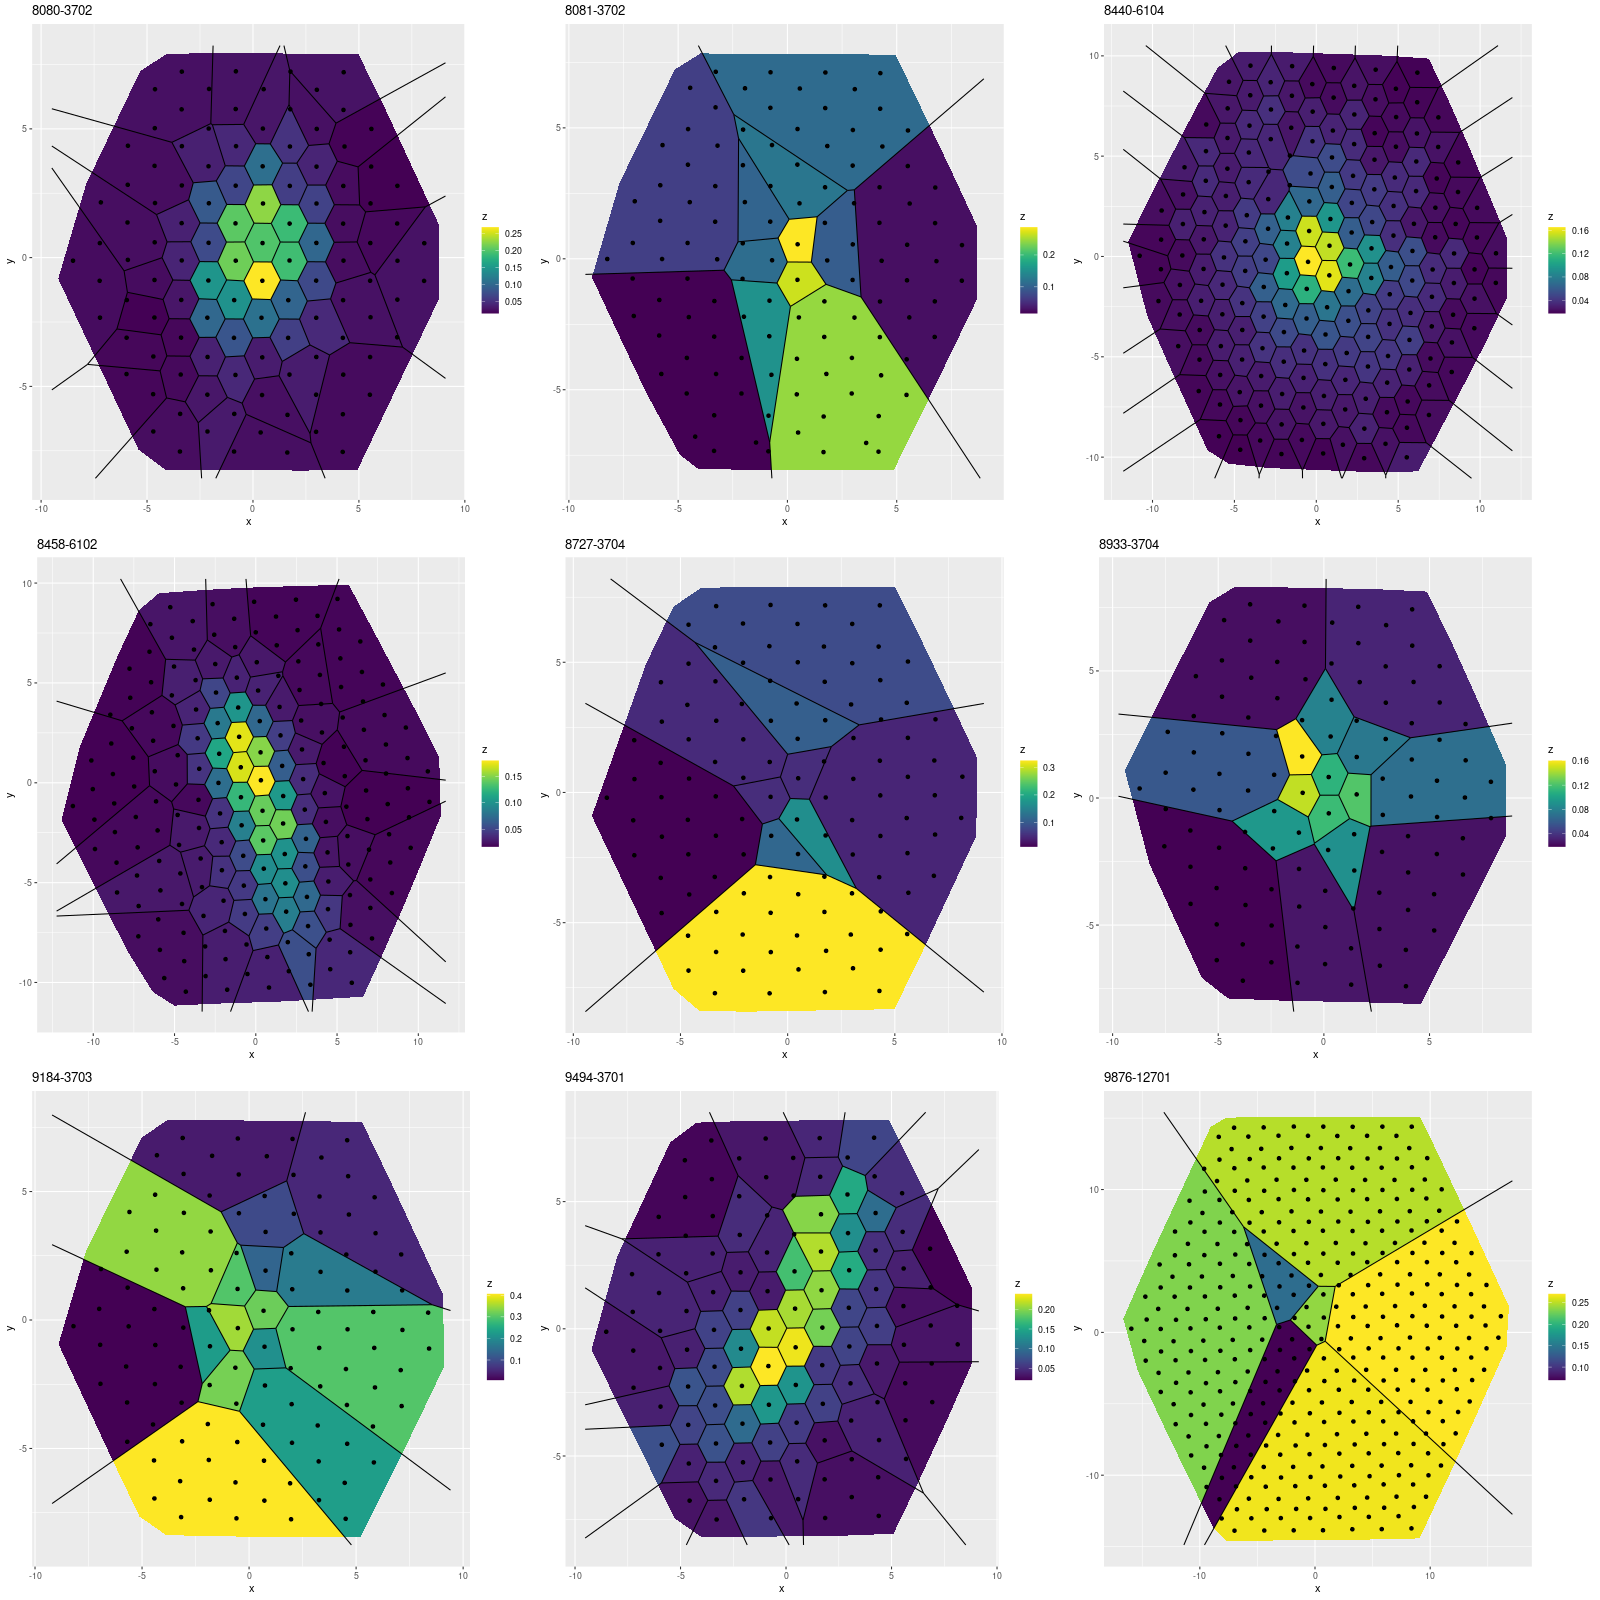
First, here are maps of the modeled fraction of the current stellar mass in stars of ages between 0.1 and 1 Gyr, very roughly the age range that produces a post-starbursty spectrum. Six of the galaxies have more or less strongly centrally concentrated intermediate age populations, which is generally what’s expected especially in the major merger pathway to a post-starburst interval. I’ll discuss this a little further below.
In more detail here are summed mass growth histories for the sample, that is all modeled star formation histories for a given observation are summed to produce a single global estimate. I’ve shown total masses here. Because of the pointing strategy MaNGA uses the fiber positions overlap to produce a 100% filling factor, so simply summing overestimates masses by about 0.2dex according to a calculation I performed some time ago. The present day masses in the plot below actually agree pretty well with the values listed in Table 1 of the paper, with an average difference of ~0.1 dex (this is probably because at least some of the light falls outside the IFU footprint in most of these galaxies, offsetting some of the overcounted mass).
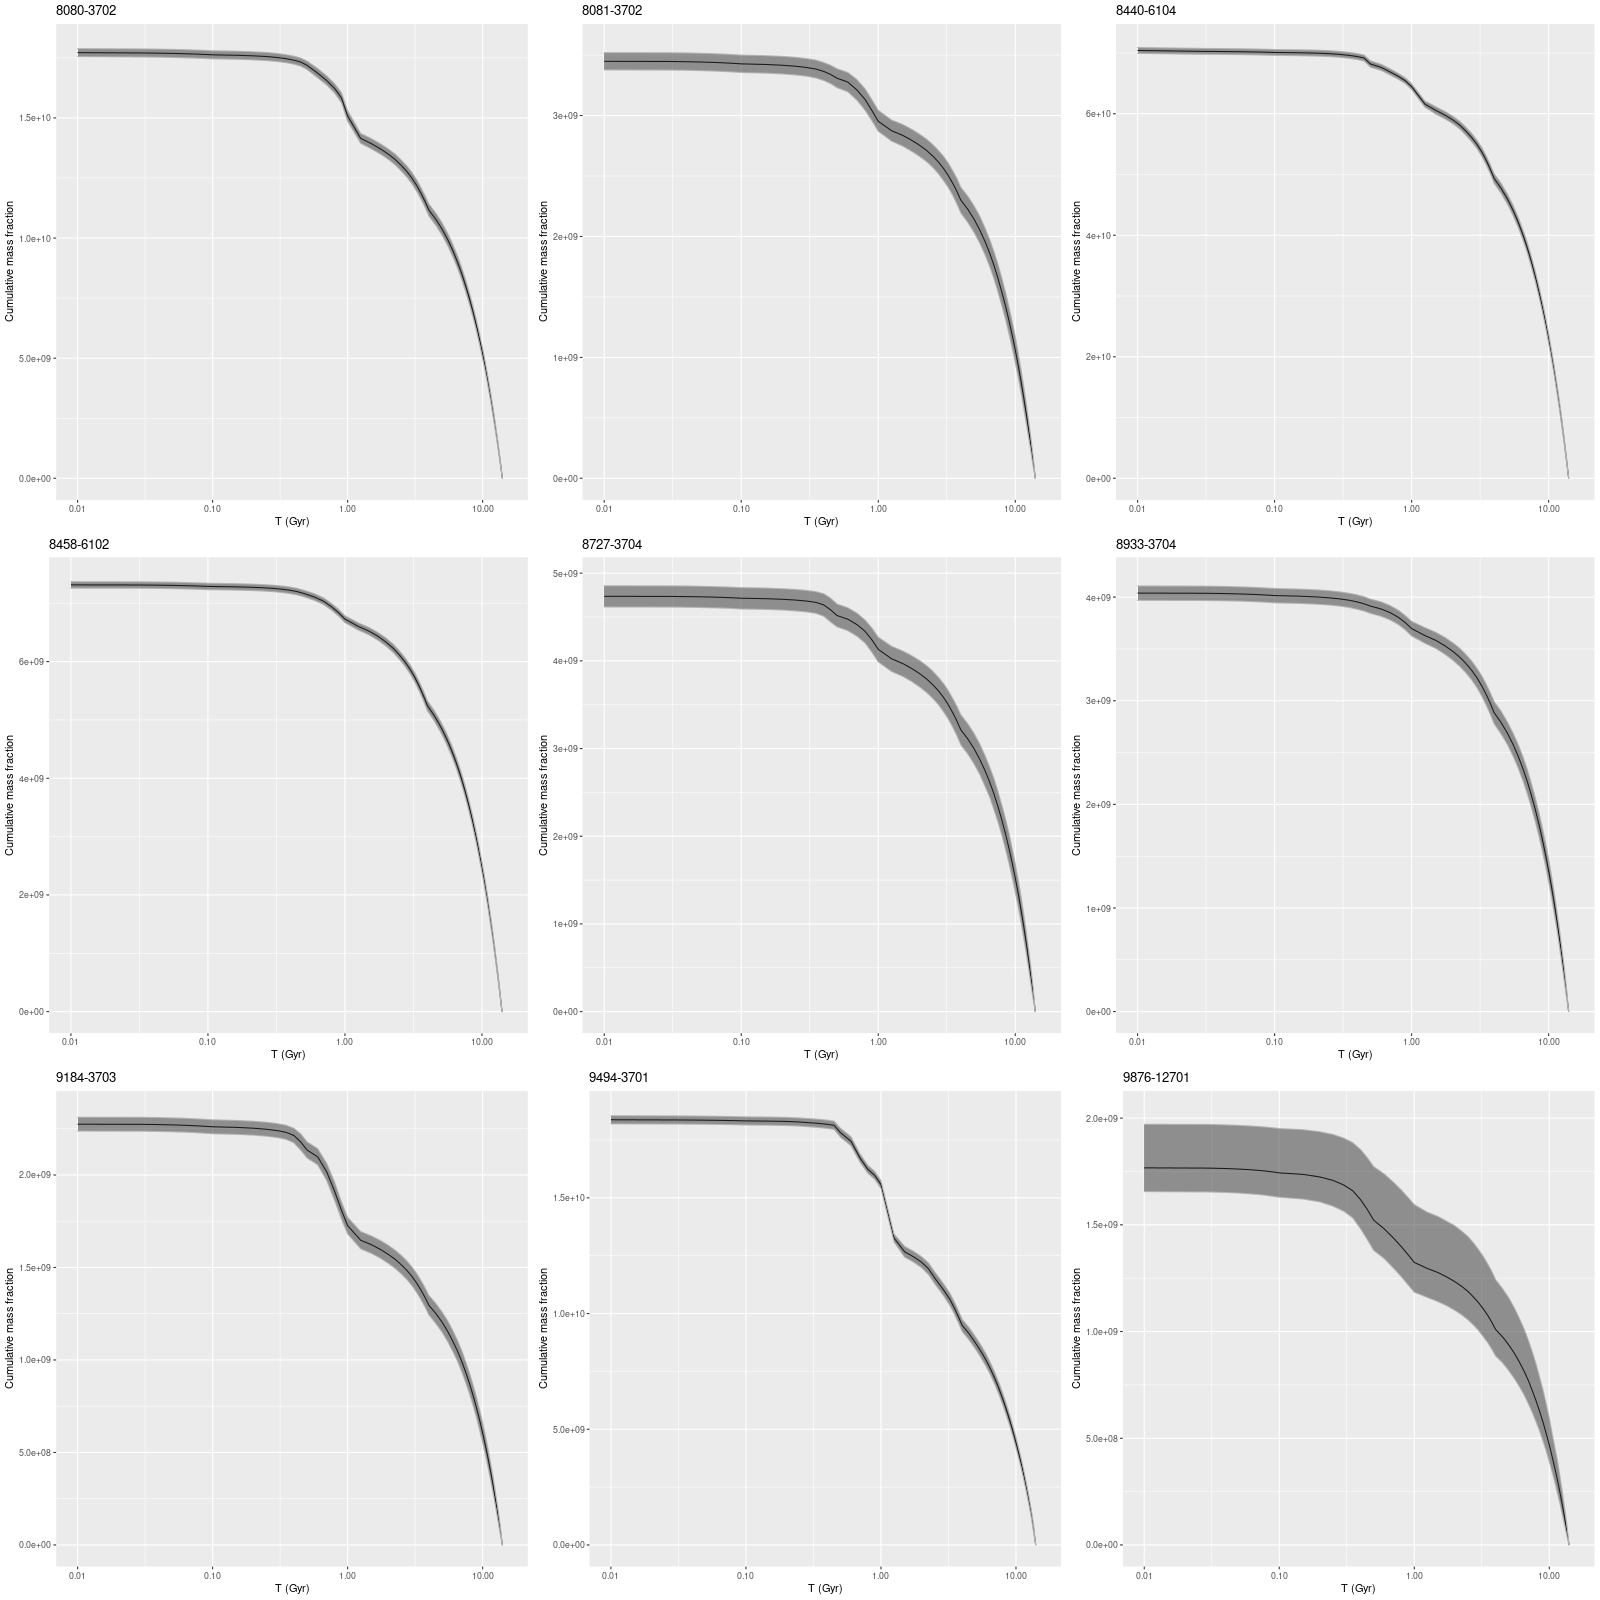
Somewhat surprisingly several of these galaxies show little evidence of an actual burst of star formation in the recent past, at least at the global level. Some of these could simply have had star formation truncated recently, which can produce a poststarburst spectral signature for a time. Overall intermediate age stars contribute ~ 6-20% of the present day stellar mass, with the two largest contributions in the low mass galaxies in the bottom row of the plot.
There are some other oddities in this small sample. At least 3 galaxies are dwarf ellipticals or perhaps dwarf irregulars (in the case of plateifu 9876-12701), and two others have stellar masses under ~5 x 10⁹ M⊙. Two of the low mass galaxies are in or near the Coma cluster, which suggests environmental effects as the probable cause of quenching. Another possible issue with the low mass galaxies is the infamous “age-metallicity degeneracy,” which refers to the fact that old, low metallicity populations “look like” younger, more metal rich ones by many measures. The Balmer lines in particular fade more slowly with age in lower metallicity populations, and the 4000Å break also becomes metallicity sensitive (smaller at low metallicities) at older ages.
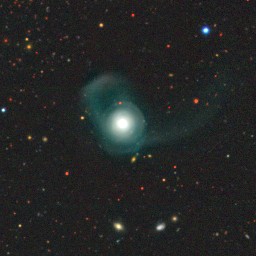
There is only one clear merger remnant in the sample (with plateifu 8440-6104, which I will get to in a moment). One other galaxy (plateifu 8458-6102) is located in a compact group that appears (in Legacy survey imaging) to be embedded in a cloud of extragalactic light. Finally, two galaxies in this sample have been cataloged as K+A based on SDSS spectra — 8080-3702 and 9494-3701, while two others in the catalog of Melnick and dePropris (2013) are not.
The one clear merger remnant in the sample is an old friend of mine, and in fact I wrote three lengthy posts about this one back in 2018. In perusing those posts I noticed that the current set of model runs have a slightly weaker and more recent burst than the earlier runs. Also a double peak in the earlier runs has gone away in these, which means my early speculation that it might be possible to time crucial events in a merger from the detailed SFH model was too optimistic. On the other hand the model burst strength in the earlier runs was uncomfortably large, indicating an exceptionally gas rich merger and efficient processing of gas into stars. The current runs have a more reasonable ~10% of mass in the burst. So, I will look into those earlier runs and try to figure out what changed. Fortunately I’m a data hoarder and R is self-archiving to some extent.
The idea of looking at the integrated properties of IFU data to pick a post-starburst sample seems reasonable, but this sample appears to me to be both incomplete and possibly with some false positives. When DR17 is finally released I plan to try to develop my own criteria. As I’ve already shown using SDSS spectra alone to select a sample is doomed to produce lots of false positives.
I should finally mention one other paper pursuing a similar idea by Greene et al. (2021) showed up on arxiv recently. The authors lost me when they used the phrase “carefully curated” in their introduction, which was otherwise pretty well written up to that point. Maybe I’ll take another look anyway.