
Back in July a paper by Millan-Irigoyen et al. titled “HY-PYPOPSTAR: high wavelength-resolution stellar populations evolutionary synthesis model” was posted to arxiv, and shortly thereafter data in the form of the promised high resolution spectra were made available at https://www.fractal-es.com/PopStar/#ingredients. Unlike MILES and its variations or BC03 this is a purely theoretical library, with the spectra calculated from model atmospheres instead of using empirical spectra of actual stars.
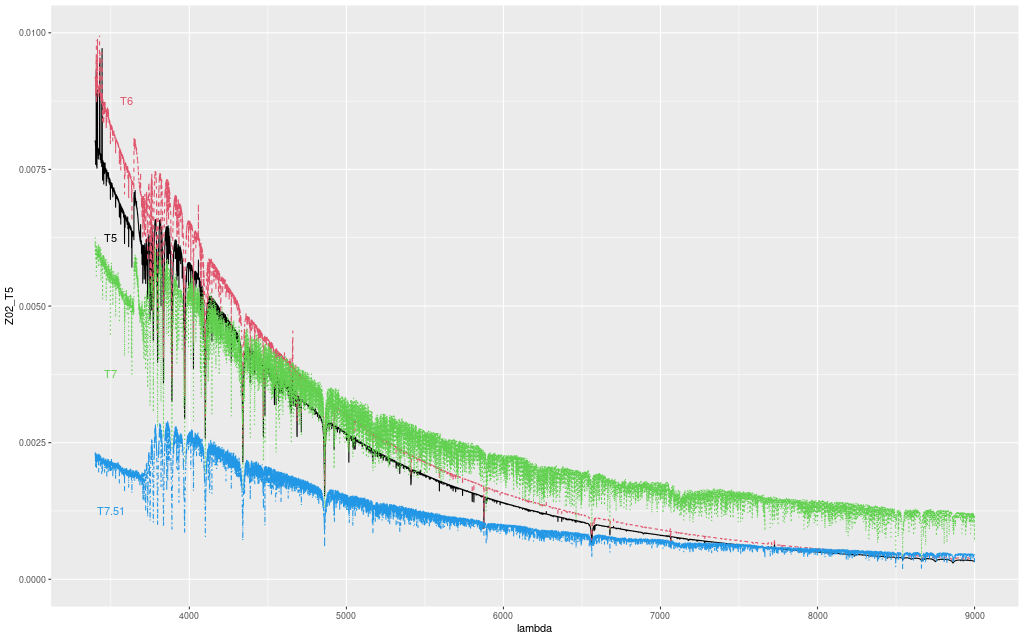
I looked briefly at one other theoretical library some time ago and concluded (IIRC) that the model spectra had much too blue continua at all ages, making it unsuitable for full spectrum fitting. A brief visual inspection of this library (as well as Figure 8 in the paper) indicates that’s not the case here. One thing that may compromise its usefulness is that although there are 106 age bins in the models they are very irregularly spaced and heavily weighted towards younger ages as shown below.
| Age range | Number of spectra |
| 5 ≤ log T < 6 | 4 |
| 6 ≤ log T < 7 | 34 |
| 7 ≤ log T < 8 | 35 |
| 8 ≤ log T < 9 | 9 |
| 9 ≤ log T < 10 | 15 |
| log T ≥ 10 | 9 |
At least in the wavelength range of SDSS/MaNGA spectra there is little evolution in spectroscopic properties between 105 and 106 years and even though it speeds up afterwards the effective time resolution of SFH models is still lower than the supplied number of time bins for the next two decades.
For a preliminary look at the library’s suitability for full spectrum modeling I selected a 42 time bin subset with all 4 available metallicity bins and Kroupa IMF, truncating the wavelength range to 3400-9000 Å, which is just a little larger than the Emiles subset I use. The time bins were chosen by hand — I was trying to get evenly spaced bins in log time but this proved not to be feasible. The authors produced two sets of libraries for each of 4 IMFs: they did an apparently careful job of counting the number of ionizing photons for several species and calculated sets of SSP models with and without emission continuum. For these trial runs I used both sets of libraries, which I’ll compare below. No code modifications were required because they use the same peculiar but computationally convenient flux units for spectra.
I just ran a few models for the central fiber spectrum of KUG 0859+406 (MaNGA plateifu 8440-6104). First, here is the star formation rate history compared to the most recent Emiles run:
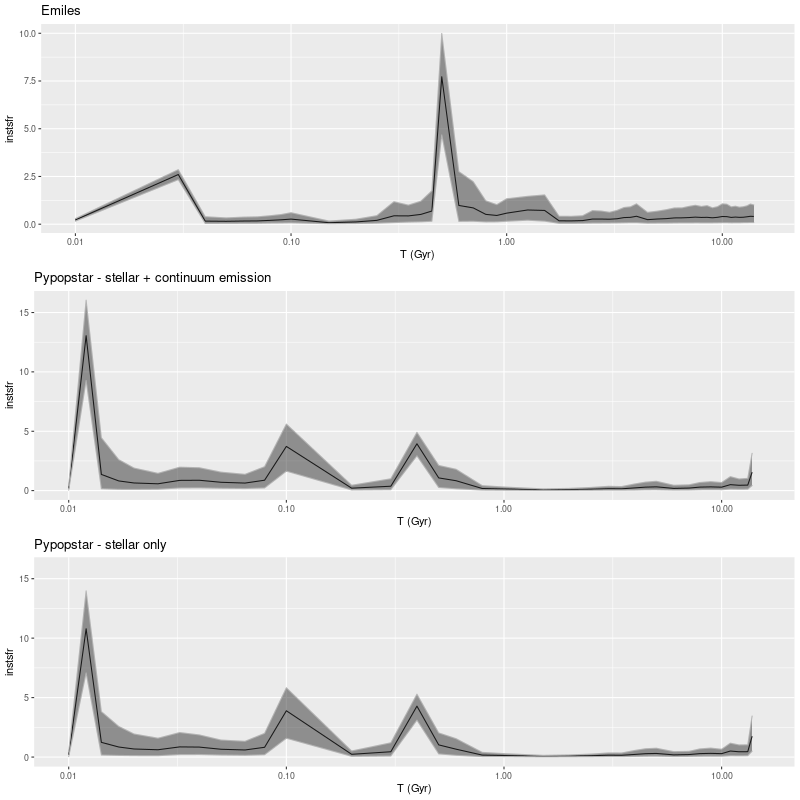
(T) Emiles
(M) hrPypopstar with emission continuum (
B) hrPypopstar stellar light only
Or, looking at the model mass growth histories:
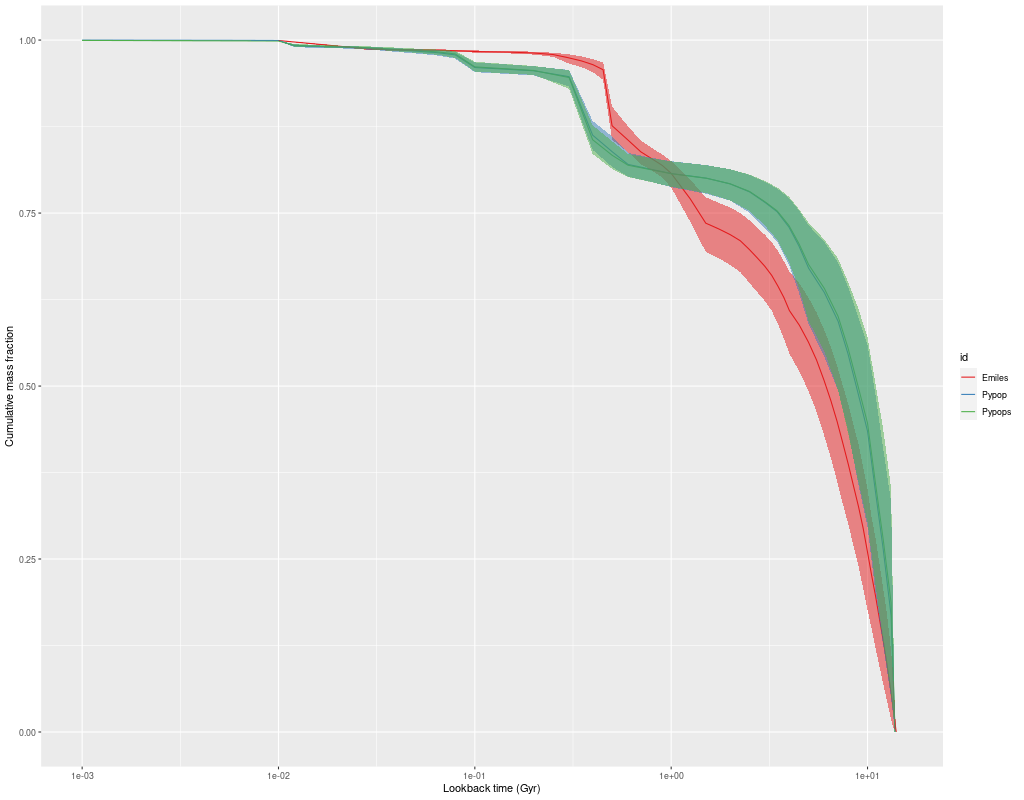
The starburst occurs later and is somewhat weaker in the pypopstar models. Interestingly all models have a late time revival of star formation after a period of quiescence. To get all the graphs to line up I truncated the pypopstar model star formation histories at 10 Myr. Here are the full histories:
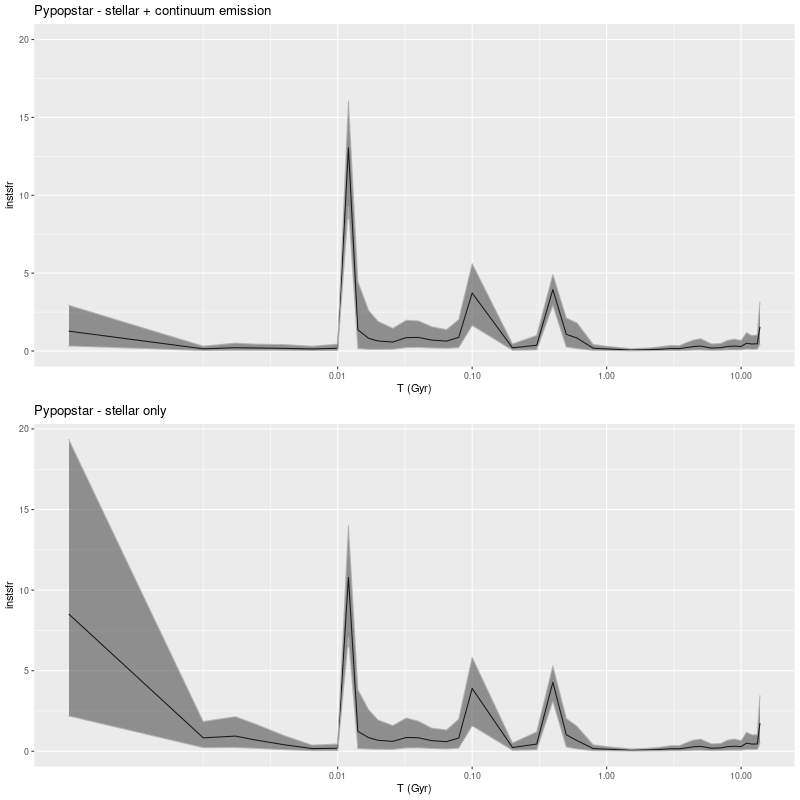
Emission continuum is significant mostly at ages < 10Myr and this is reflected in some difference in late time model star formation histories. This has little effect on other modeled quantities.
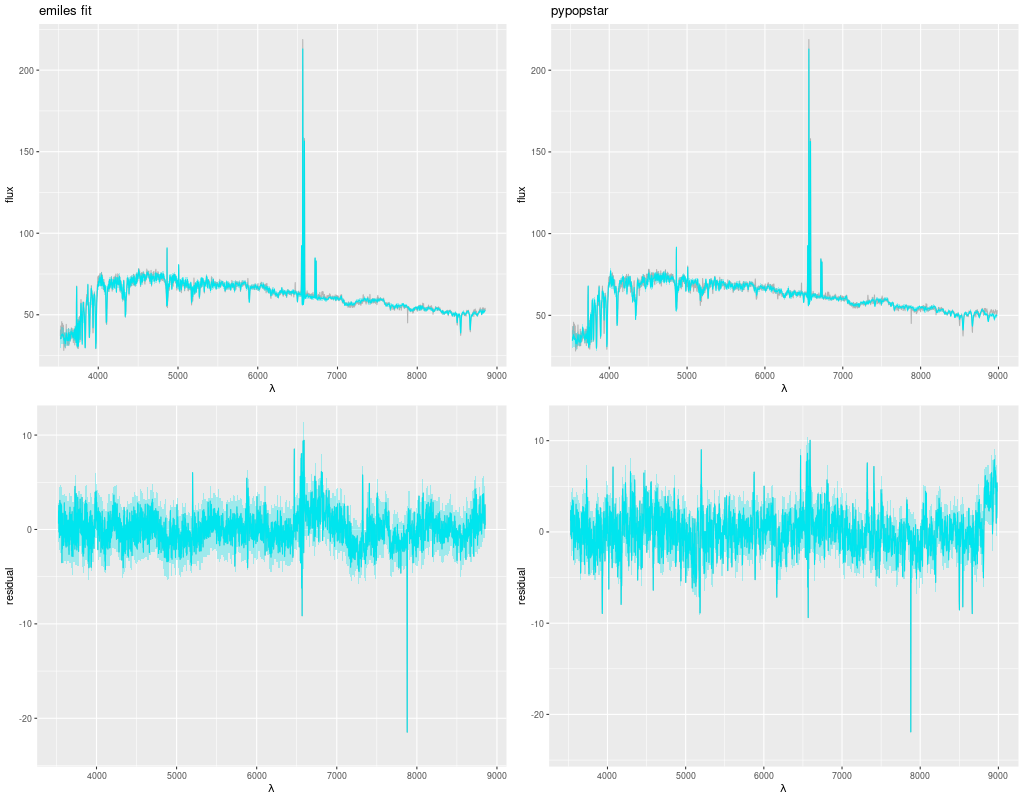
At a glance fits to the galaxy flux data look very similar. Both sets of models have problems in some wavelength ranges and both have some issues with the [N II]+Hα emission complex, probably because the lines don’t quite have gaussian profiles. In terms of summed log-likelihood the Emiles fit is actually almost a factor of 2 better than pypopstar.
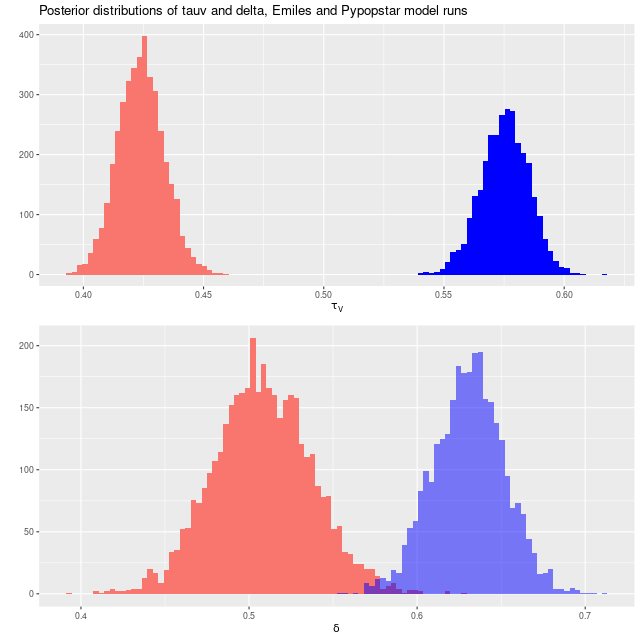
The pypopstar models have larger optical depths of attenuation and steeper attenuation curves than the Emiles models, demonstrating once again the interplay among attenuation, attenuation relationship, and stellar ages:
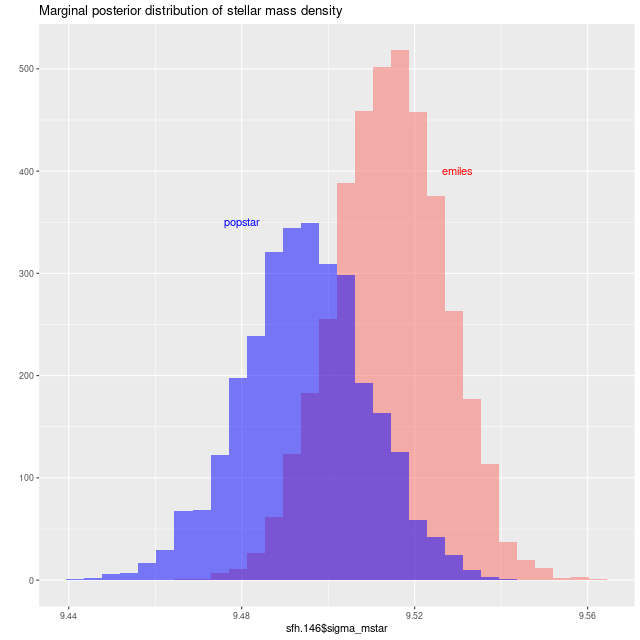
Some other modeled quantities are very similar, for example the stellar mass density:
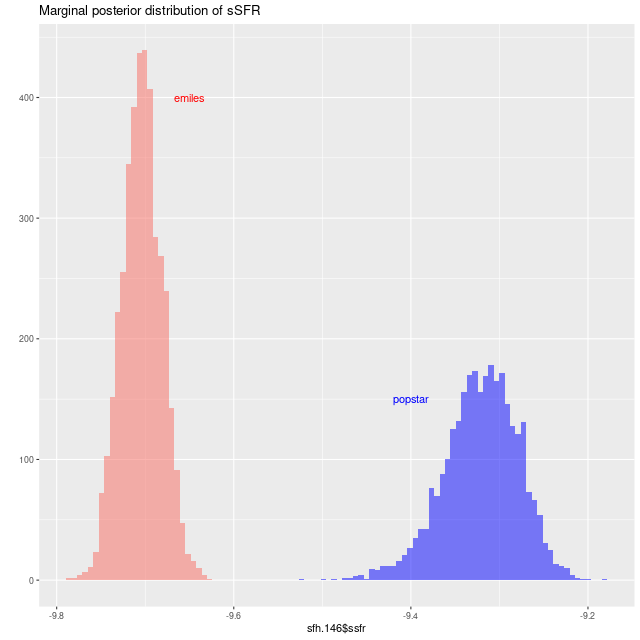
While the modeled specific star formation rate differs by ~0.4 dex thanks to the more recent starburst in the pypopstar models:
I still haven’t decided exactly what to do with these interesting SSP model libraries. I will probably take a more systematic look at extracting a subset of time bins that evolve at a consistent rate by some measure. This will certainly require many fewer than the published 106 bins. What may be more promising is to graft some young age SSPs onto my existing Emiles library. The 4 published metallicity bins are pretty closely matched to the Emiles subset I use, and 4 or 5 SSP’s would fill out the ages up to the youngest (30 Myr) in the BaSTI isochrones. I already use unevolved BC03 models for this purpose. Using the models that include continuum emission would also solve the problem of how to model that in starforming galaxies (but not galaxies with strong AGN emission unfortunately).