
This isn’t quite an accidental “discovery.” There’s been a fair amount of interest in recent years in finding “transitional” galaxies that are rapidly shutting down star formation but that don’t meet the traditional criteria for K+A galaxies (see for example Alatalo et al. 2014, 2016; Wild et al. 2007 among many others). A while back I made my own effort at assembling a sample of post-starburst candidates by looking for spectra in SDSS with strong Hδ absorption and emission line ratios other than starforming in the MPA data tables. This sample had some thousands of candidates, of which there are just 26 in the first two MaNGA data releases. As many as half of those were false positives, which is a little too high, so it’s back to the drawing board. But there were a few interesting hits:
This legacysurvey.org cutout (from the MzLS+BASS surveys) shows clearly a pair of tidal tails and some shells, clear signs of a recently consummated merger. The region covered by the IFU footprint on the other hand looks rather featureless:

In the remainder of this post I’ll look at a few measured, not too model dependent, properties of the IFU data. In future post(s) I’ll look at the results of star formation history models and other model dependent properties. One thing I’m interested in learning more about is if SFH models of merger remnants tell us anything about the chronology of mergers. We’ll see!
MaNGA data cubes include synthesized griz images created by projecting the spectra onto the filter transmission functions at each spaxel. Below is a g-i color map from these synthetic images, with the color corrected for galactic extinction but not any internal attenuation that might be present. There are hints of structure that indicate the merger remnant hasn’t quite reached equilbrium, but more importantly there is a clear positive color gradient with radius as seen on the right, with a turnover in the slope of the gradient at ≈2 kpc. A positive color gradient is the opposite of what would be seen in a normal disk galaxy, but exactly what we’d expect from the aftermath of a major merger with a centrally concentrated starburst.
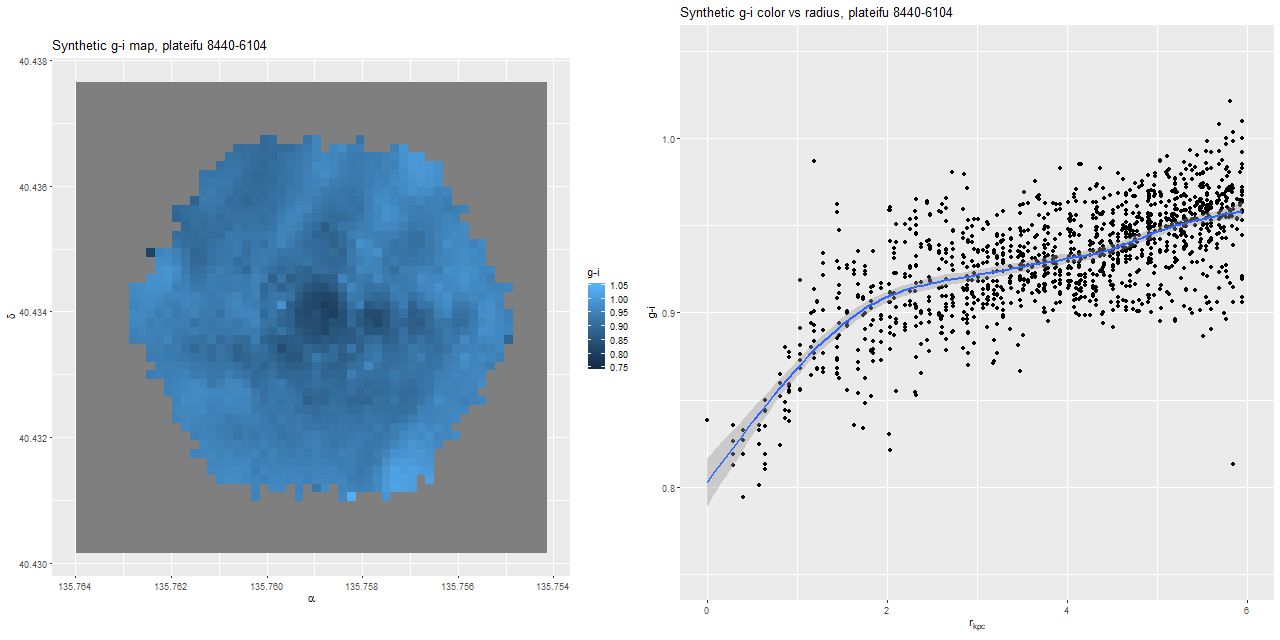
R: g-i color trend with radius
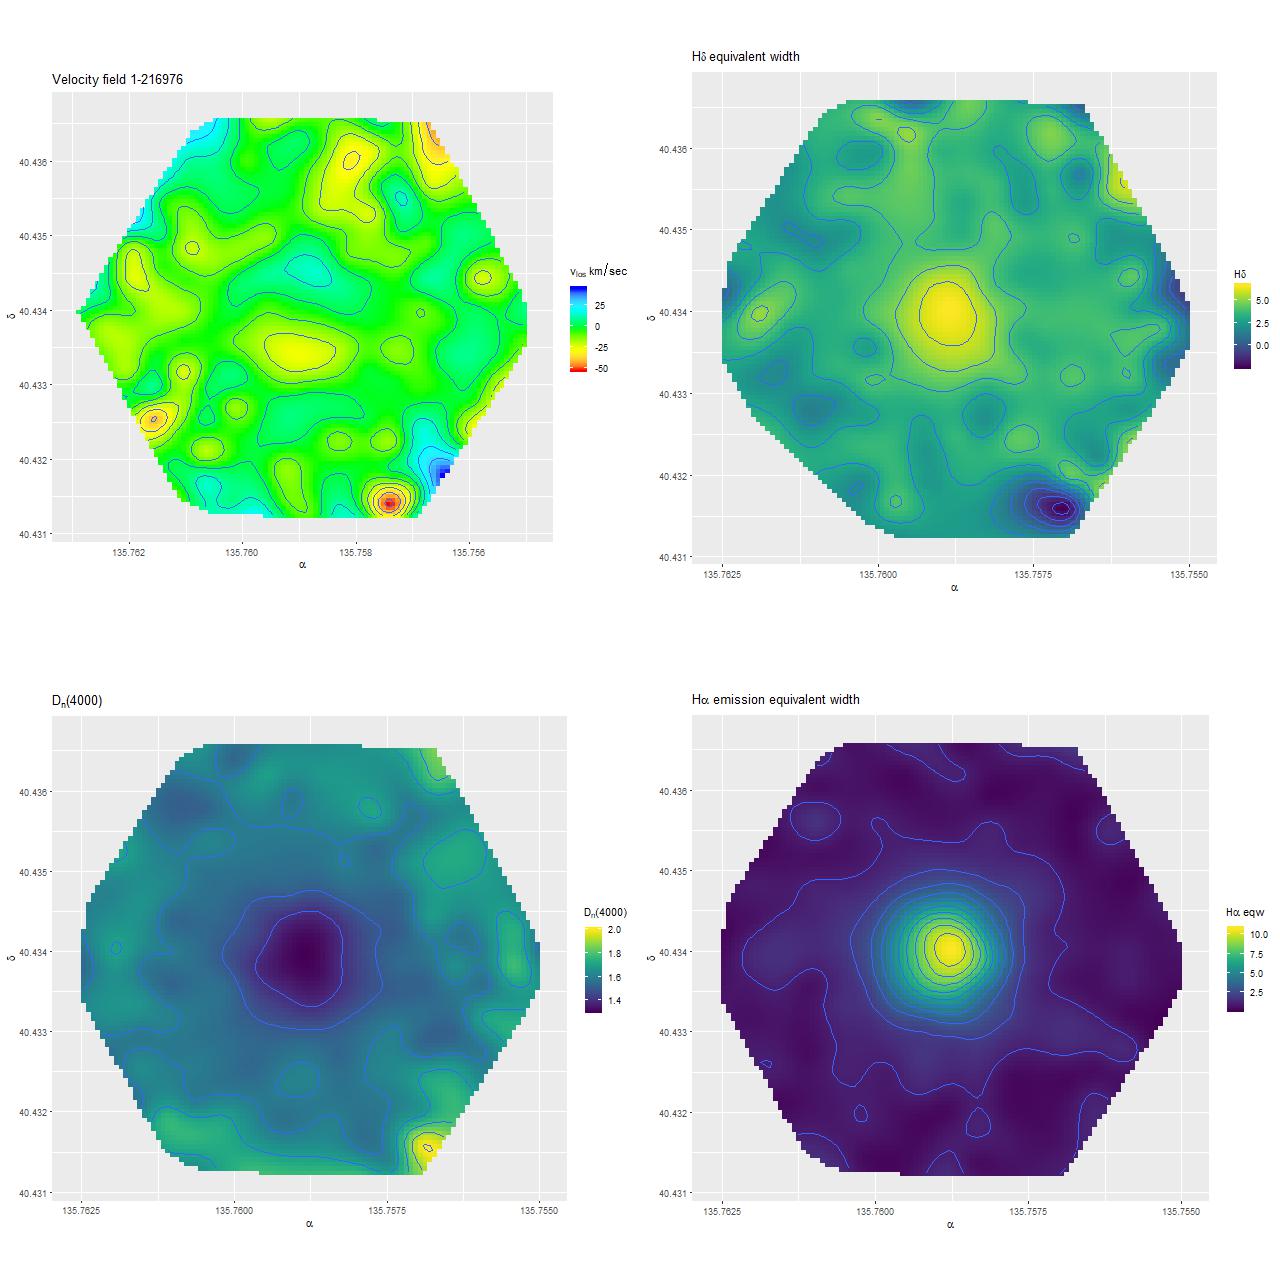
Several measured quantities are shown below. The input data for these were the stacked RSS files, with the measurements interpolated onto a fine grid for visualization. The velocity field (top left) has several interesting features. First, there is no apparent overall rotation, but the symmetrical pair of lobes with opposite velocity signs just outside the nucleus indicate the presence of a rotating disk or torus. These are known as “kinematically distinct cores” and are somewhat common in early type galaxies (for example Krajnovic et al. 2011), and are expected in some cases in major gas rich mergers (eg Bekki et al. 2005).
The other three panes of this plot are the equivalent width in absorption of the Balmer line Hδ (TR), the 4000Å break strength D\(_n\)(4000) (BL), and Hα emission equivalent width (BR). Hδ is a measure of Balmer absorption line strength and is sensitive to the presence of an intermediate age population. A threshold of around 5Å is usually used to select post-starburst galaxies (eg Goto 2005). My measured peak line strength is \(6.5 \pm 0.2 \)Å (the same as the MPA estimated emission corrected value for the SDSS fiber spectrum), and the inner \(\approx 1.5\) kpc. has Hδ > 5Å, with scattered regions at larger radius also exceeding this threshold (although measurement errors are much larger). However emission line strengths are too large in the central region for traditional K+A selection criteria, which usually require Hα equivalent width (in emission) \(\lesssim 3-5\)Å. I estimate the peak Hα equivalent with to be about 11Å (my code for this is still experimental and hasn’t been validated against other measurements. The MPA value for the SDSS fiber was 14Å. My absorption line index measurements and uncertainty estimates on the other hand agree very well with the MPA values, so I consider them well validated).
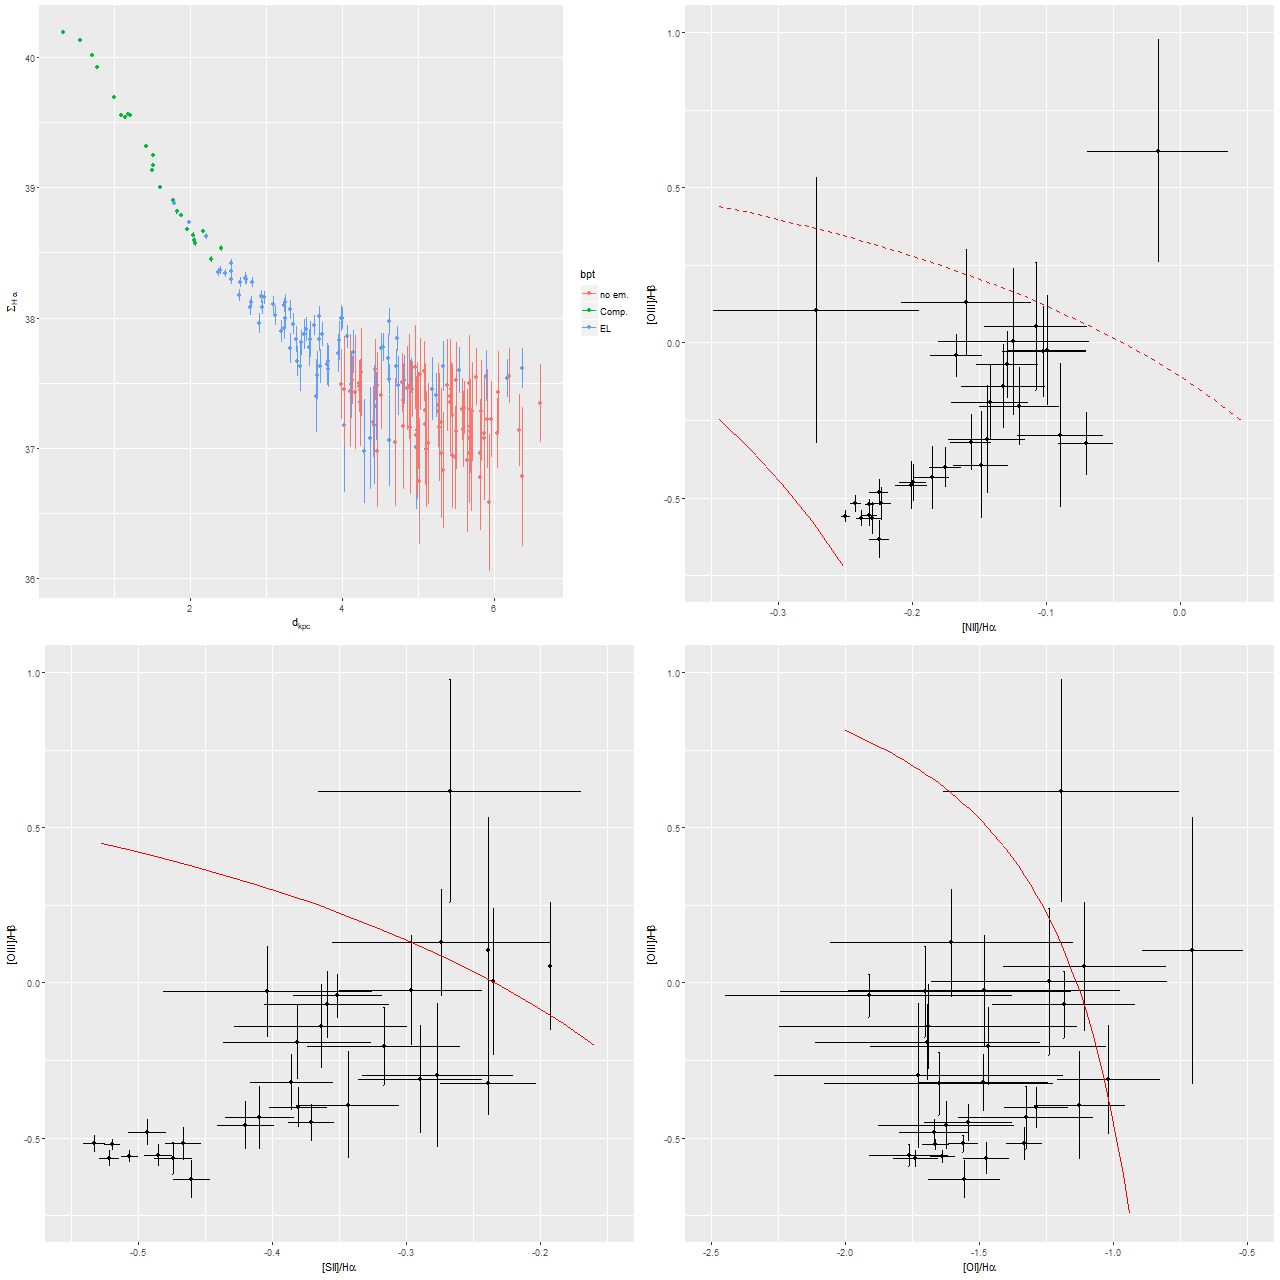
The plot below shows a few properties of the emission lines. Hα luminosity declines monotonically with radius, with a fairly sharp transition at ≈2.5 kpc where Hβ is no longer securely detected. The peak luminosity would indicate a central star formation rate density of \(\approx 0.1 \mbox{M}_{sun} \)/yr/kpc\(^2\) if the ionizing source is entirely young stars. This is almost certainly as much as 3 orders of magnitude lower than the star formation rate at the peak of the starburst.
Somewhat surprisingly, I don’t find this galaxy in any compilations of “transitional galaxies,” including for example the “SPOGS” sample of Alatalo et al. (2106). This is probably because the emission line ratios don’t quite meet their criteria for shocks as the dominant ionizing mechanism. The remaining 3 panes below show the 3 most popular BPT diagnositic diagrams for fibers within 2.5 kpc of the center (beyond that emission line ratios are too uncertain to display). Most of the points in the [N II]/Hα diagram (TR) fall in the so called “composite” region (Kauffmann et al. 2003), which was originally interpreted as indicating a mix of AGN and star formation as the source of ionization. While there might be a weak AGN present (there is a compact radio source visible in FIRST, which could indicate either an AGN or centrally concentrated star formation) it’s unlikely to be a significant ionizing source here. The other diagnostics mostly lie on the starforming side of the boundaries proposed by Kewley et al. (2006), while the handful of points on the Seyfert/LINER side of the boundaries are far from the nucleus. In fact all three sets of line ratios show a trend with radius that’s opposite of what would be expected if an AGN were a significant ionizing source.
To conclude for now, this is a clear case of a galaxy rapidly transitioning in the aftermath of a major merger. Next up, I’ll look at the results of star formation history models, and speculate about how believable they are. Later perhaps I’ll look at other examples, and maybe discuss why the false positives happened.