ProGeny: The solution to my SSP model problems?

I’ve written a few times about my dissatisfaction with the EMILES based SSP model library that I’ve used for star formation history modeling for some years and my desultory search for a replacement: This post from early 2024 was the most detailed. Unfortunately neither of the two alternatives I tested were quite satisfactory and my hopes for a MaStar based library from the final MaNGA data release haven’t yet materialized nearly a year later. I’ve given some thought to producing my own but I don’t know exactly how to create sets of summed spectra from a collection of isochrones and given IMF, and it wasn’t really something I wanted to learn. It’s also the case that even though MaStar has many more stellar spectra than any other publicly available collection (MILES, which is the basis for most (semi-)empirical libraries contains just 985) it still doesn’t fully span the space of physical parameters, so additional theoretical or empirical inputs will be required.

Somewhat serendipitously since I was traveling at the time and could easily have missed them a pair of papers appeared on arxiv on 23 October describing an R package named “ProGeny” that does precisely what I need: 2410.17697 and 2410.17698 by A. Robotham and S. Bellstedt. The first paper introduces the package and describes the data currently available for generating what they call Stellar Population Libraries (SPL). While it might seem surprising they used R for this1Python is the language of choice for most astronomers these days. the senior author has published several R packages for various astronomy related tasks, so it isn’t actually surprising that given their apparent need for this tool they chose R to implement it. This was a timely publication for me since I’ve about reached the limit of what I want to do with the EMILES library.

Besides the software which is written entirely in R, the authors did a good job of collating the publicly available data for the required inputs of isochrones and stellar atmospheres and packaging them into FITS files that are readable in R with the help of addon packages. Functions within ProGeny take care of reading the files and creating R objects for further processing.

After installing the software and dependencies and downloading the data files (several GB unzipped) I spent a little time browsing the (rather sparse) documentation and the two vignettes that have been published so far and it was then pretty straightforward to create a library with the recommended inputs. Specifically I used the MIST isochrones combined with the following stellar atmospheres: “C3K” for the base, “PHOENIX” extended, “AGB” from Lancon, “TMAP” for hot stars including remnants: see Table 3 of the first paper for descriptions and references. I used a Kroupa IMF with lower and upper mass limits of 0.1 and 100 M☉, which are fairly standard choices and the same as my EMILES based library. The constructed library has 107 age bins in logarithmic intervals of 0.05 dex ranging from log(T) = 5.0 to 10.3, 15 metallicity bins with log(Z/Z☉) ranging from -4 to +.5 with adopted Z☉ = 0.02, and wavelengths from 5.6 Ã… to 36 mm. Almost all of the data that I use as model inputs is calculated, including of course the spectra and remaining stellar mass at each age and metallicity. The only thing missing is relative g, r, i band fluxes that I use to calculate model intrinsic colors (something I occasionally look at as a sort of proxy for specific star formation rate). This I have existing code for.

These are more age/metallicity combinations than I need or probably can use and definitely a much larger wavelength range than needed for MaNGA data, so I’m experimenting with subsets. For a first pass I created a “small” subset with 42 ages ranging from log(T) = 6 to 10.1 in 0.1 dex increments and 5 metallicities log(Z/Z☉) = {-0.75, -0.25, 0, 0.25, 0.5}. The metallicity range is similar to my EMILES based library but with one more bin, while there are fewer but more evenly spaced age bins. I’ve also created a “large” subset with all 83 age bins between log(T) = 6 and 10.1, and the same 5 metallicities. I didn’t include younger populations for the simple reason that there’s not much evolution in the first Myr, which makes it difficult or impossible to disentangle their contributions. Similar considerations apply at the old end, and in addition there’s the fact that the current consensus age of the universe is 13.8 Gyr (log(T) = 10.14).

I’ve tentatively chosen a wavelength range of 3300-9000Ã…. The blue end was chosen to cover the shortest rest frame wavelength in MaNGA spectra for redshifts out to z ≈ 0.1. The red limit is more of a judgment call. Night sky lines become problematic at wavelengths as short as ≈ 8000Ã…, and in addition there’s an artifact called “blowtorch” by the SDSS team that causes an upturn at the very red end in some spectra. The chosen cutoff is just to the red of a set of Calcium triplet absorption lines at 8500-8700Ã… that are prominent in some spectra.

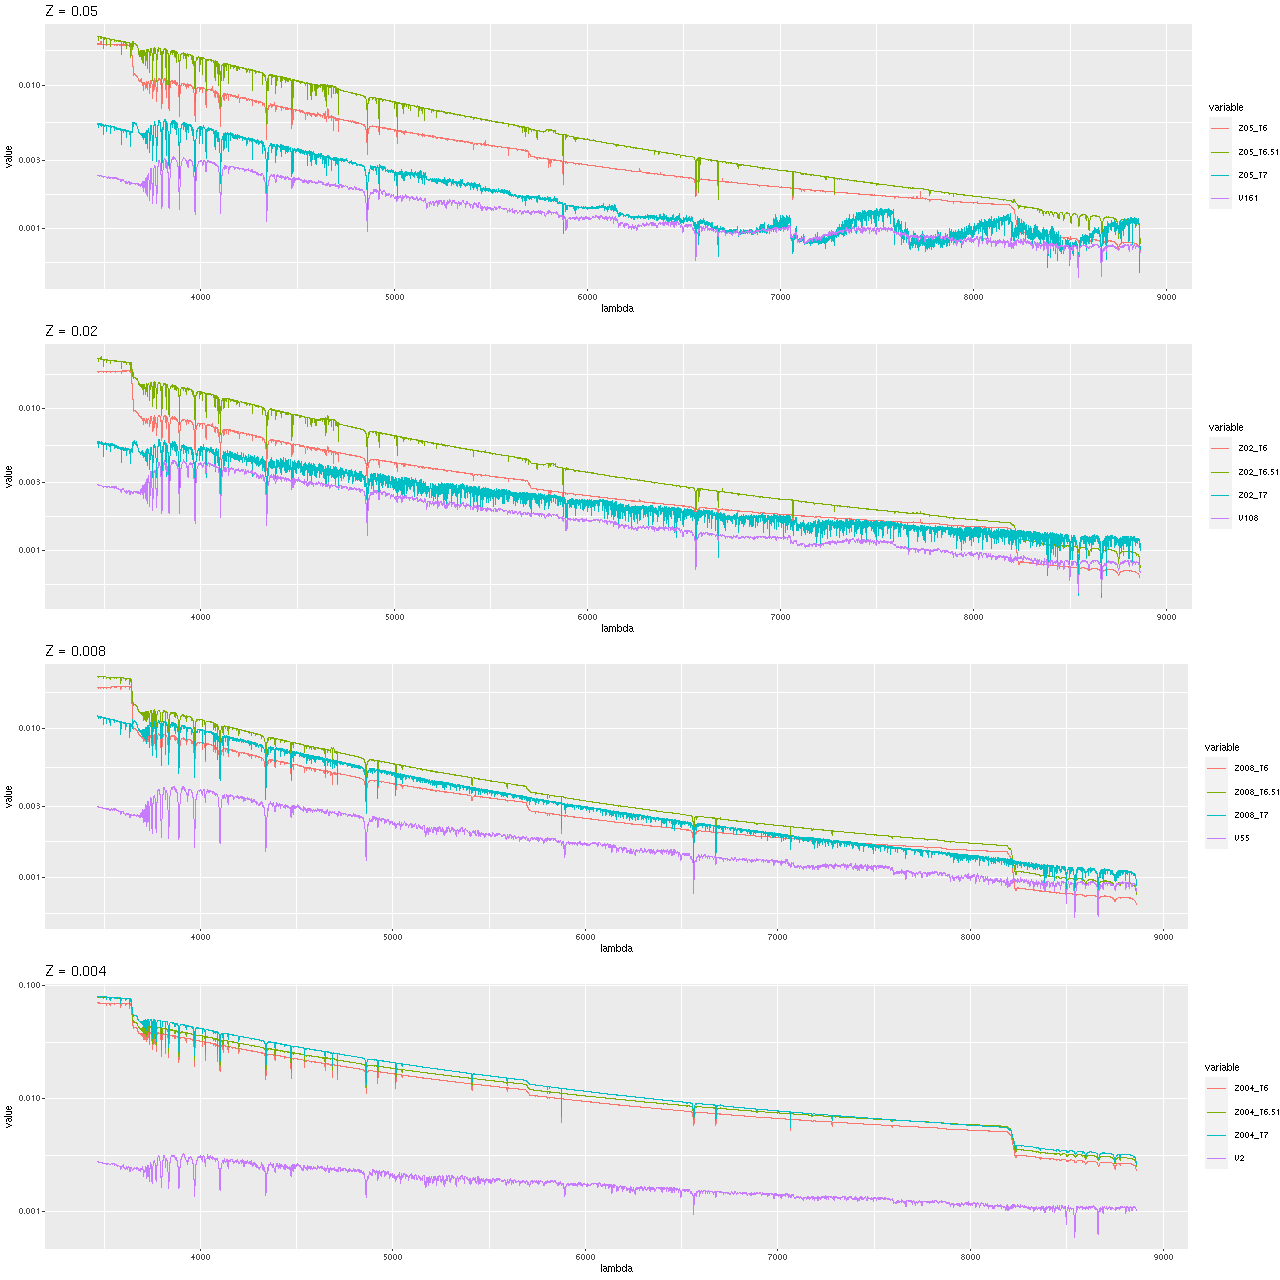
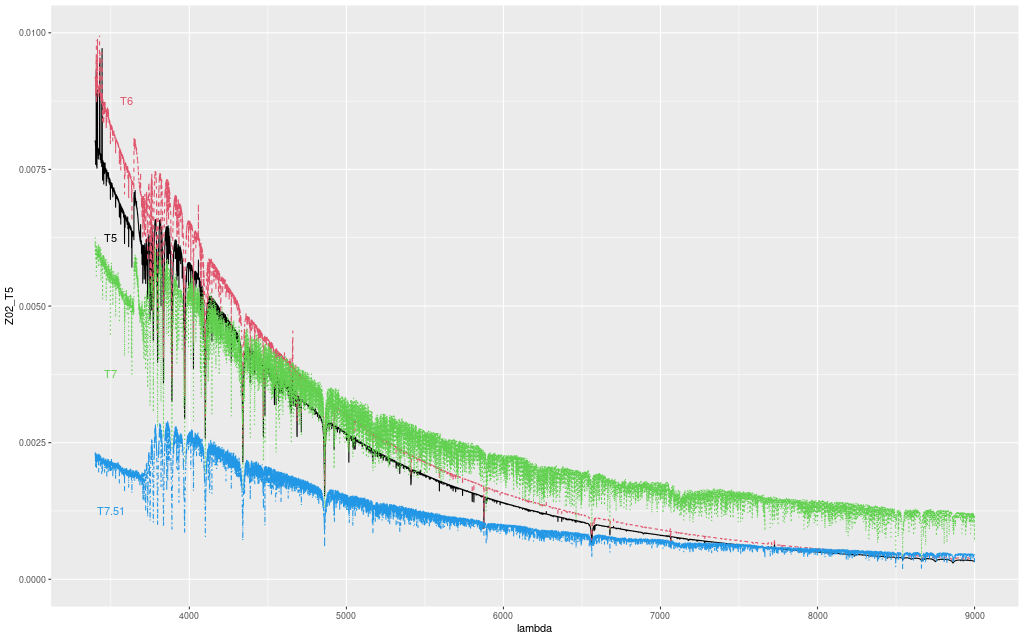
Below are comparisons of a few model spectra at solar metallicity and decade age intervals. Recall that the 106 and 107 year models are from the Hr-PyPopStar models of Millan-Irigoyen et al. (2021) including continuum emission. Evidently the newly constructed models are rather more luminous and bluer than the PyPopstar models, while closer to the EMILES models especially at ages > 1 Gyr. Possible differences in absorption line strengths could be due to finer wavelength sampling in the ProGeny models. One possibly significant difference is the MIST isochrones track more stages of stellar evolution than the version of BaSTI used for EMILES, including the asymptotic giant branch and stellar remnants. How much these contribute to the light in the relevant wavelength range and at what ages has yet to be investigated by me.
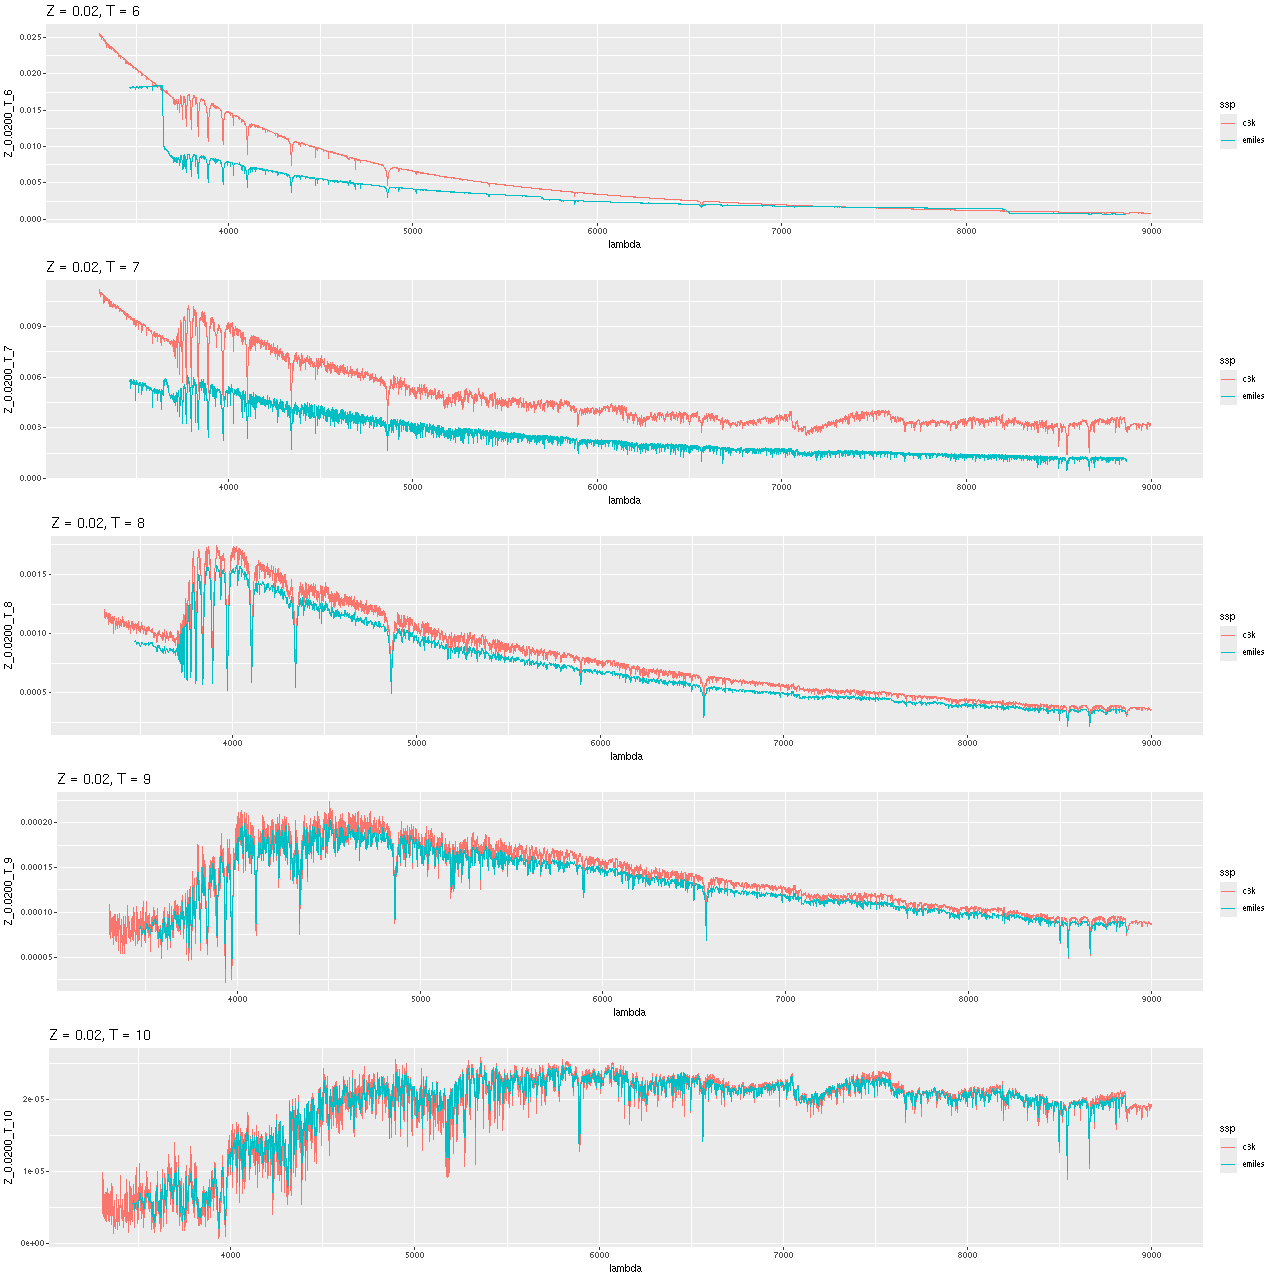
Sample SSP model spectra – ProGeny generated from c3k base models and EMILES + Pypopstar

Modern collections of stellar isochrones generally include a prescription for mass loss and remnant masses in evolving populations. ProGeny calculates these and includes a data table of stellar masses in its SSP model output. The graph below compares the remaining stellar mass (including remnants) with age for the provisional library versus EMILES. I had assigned a relative stellar mass of 1 to the PyPopstar models, while the MIST isochrones indicate about a 10% mass loss by 107 years. At older ages the masses are very similar. This is much closer agreement than the equivalent graph in Figure 12 of paper 1, so the adopted relation shouldn’t be a source of significant differences in present day stellar mass computations.
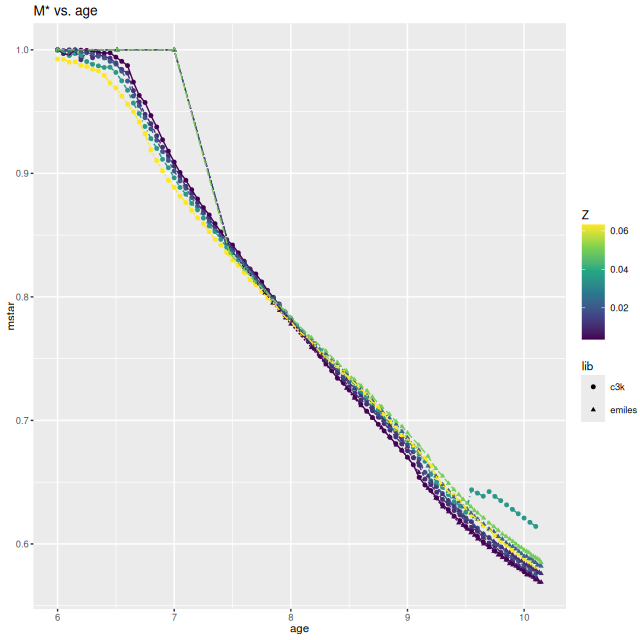
Stellar mass vs. age – MIST vs. BaSTI isochrones at several metallicities

So far I’ve only run models for two galaxies with rather different properties, the same ones I wrote about in this post: the post-starburst plateifu 10220-3703 (mangaid 1-201936; NED name WISEA J080218.38+323207.8) and the late type spiral plateifu 11018-12704 (mangaid 1-233951; UGC 8162). Since it has taken much longer to prepare this post than I anticipated, I’m only going to discuss the post-starburst for now. The spiral will have to wait for the new year.

I did an initial set of runs with the same model formulation that I’ve used for a few years now and got some rather surprising results, particularly for outlying regions of the galaxy: model star formation histories looked more like an actively star forming galaxy than a passively evolving one, with younger populations and higher recent star formation rates. The models also had relatively high attenuation values with much steeper attenuation curves than are reported in the literature. This is I think a known “degeneracy” between attenuation and stellar age. The tentative solution was simply to tighten the priors on the two attenuation parameters: I set both upper and lower bounds on the steepness parameter δ: -0.5 < δ < 1.2 and also decreased the scale parameters on the priors for both Ï„V and δ (see this post for my initial discussion of the attenuation model and the following one for problems I initially encountered; the parameterization was based on the work of Salim et al. 2018). Plugging into equation 4 of Salim et al. the limits on δ correspond to 1.6 < RV < 8.7, which is still a very large range.

As can be seen from the SFH and mass growth plots below the C3K based models are fairly consistent with EMILES, although with generally higher late time star formation rates. Interestingly, the “big” models also have generally higher late time SFR than the “small” models even though they have the same stellar ingredients with just different time resolution. Both sets of models have gotten rid of the objectionable artificial jumps in star formation rates where the BaSTI models have abrupt changes in age intervals.

One fairly significant difference is that in the EMILES based models the burst appears to be strongly centrally concentrated, fading beyond about 2 kpc from the center. The C3K based models by contrast show a burst throughout. In the center the EMILES models have a complex, multipeaked evolution through the burst, while the C3K models have a fairly smooth rise and decline. Whatever hopes I had that it might be possible to time major events in possible merger scenarios seem to have been misguided., although the age and magnitude of the burst agree in all model runs.
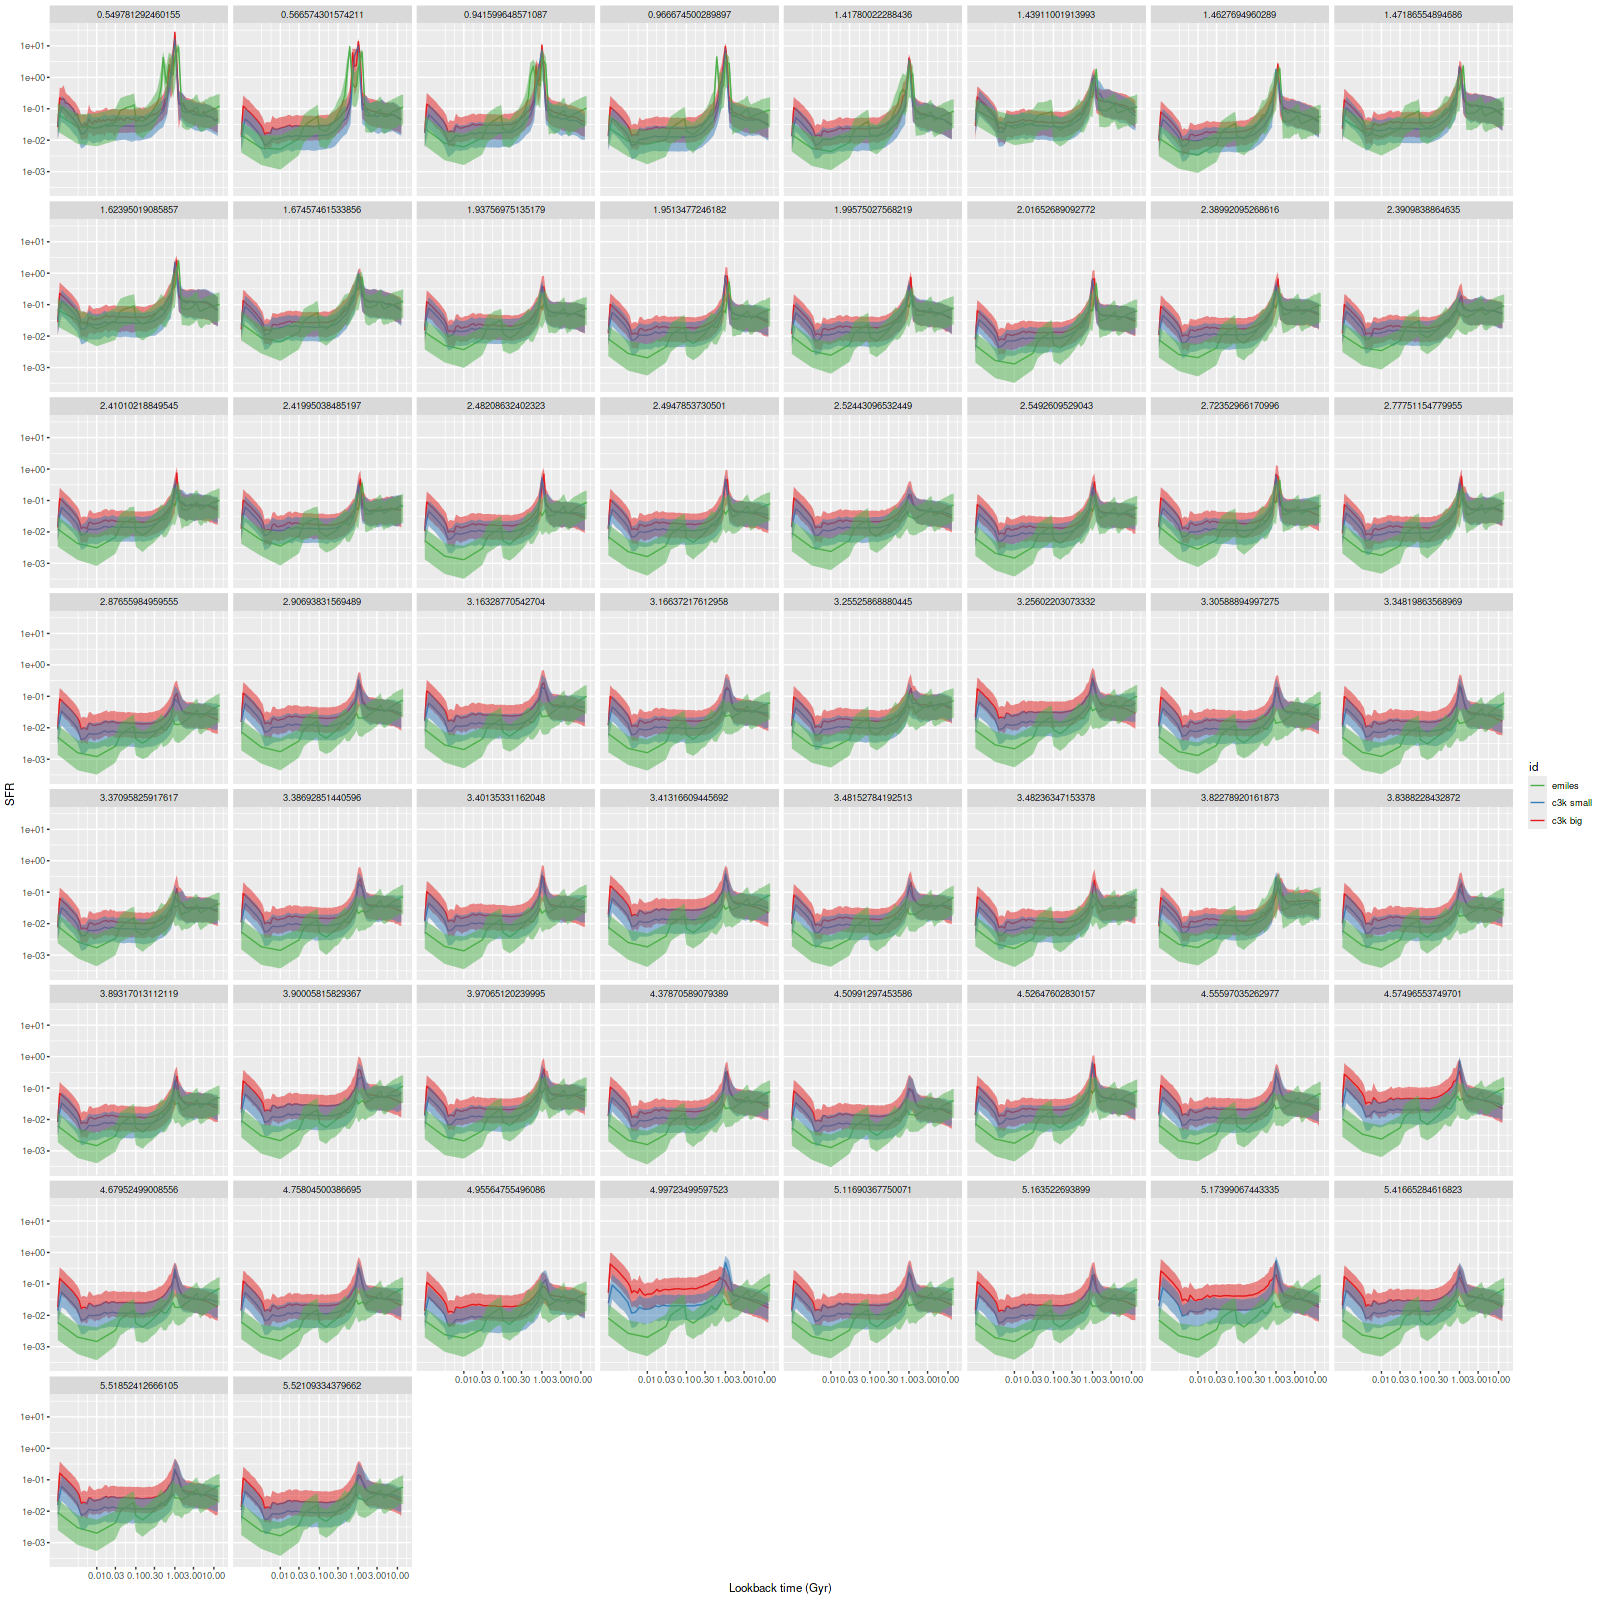
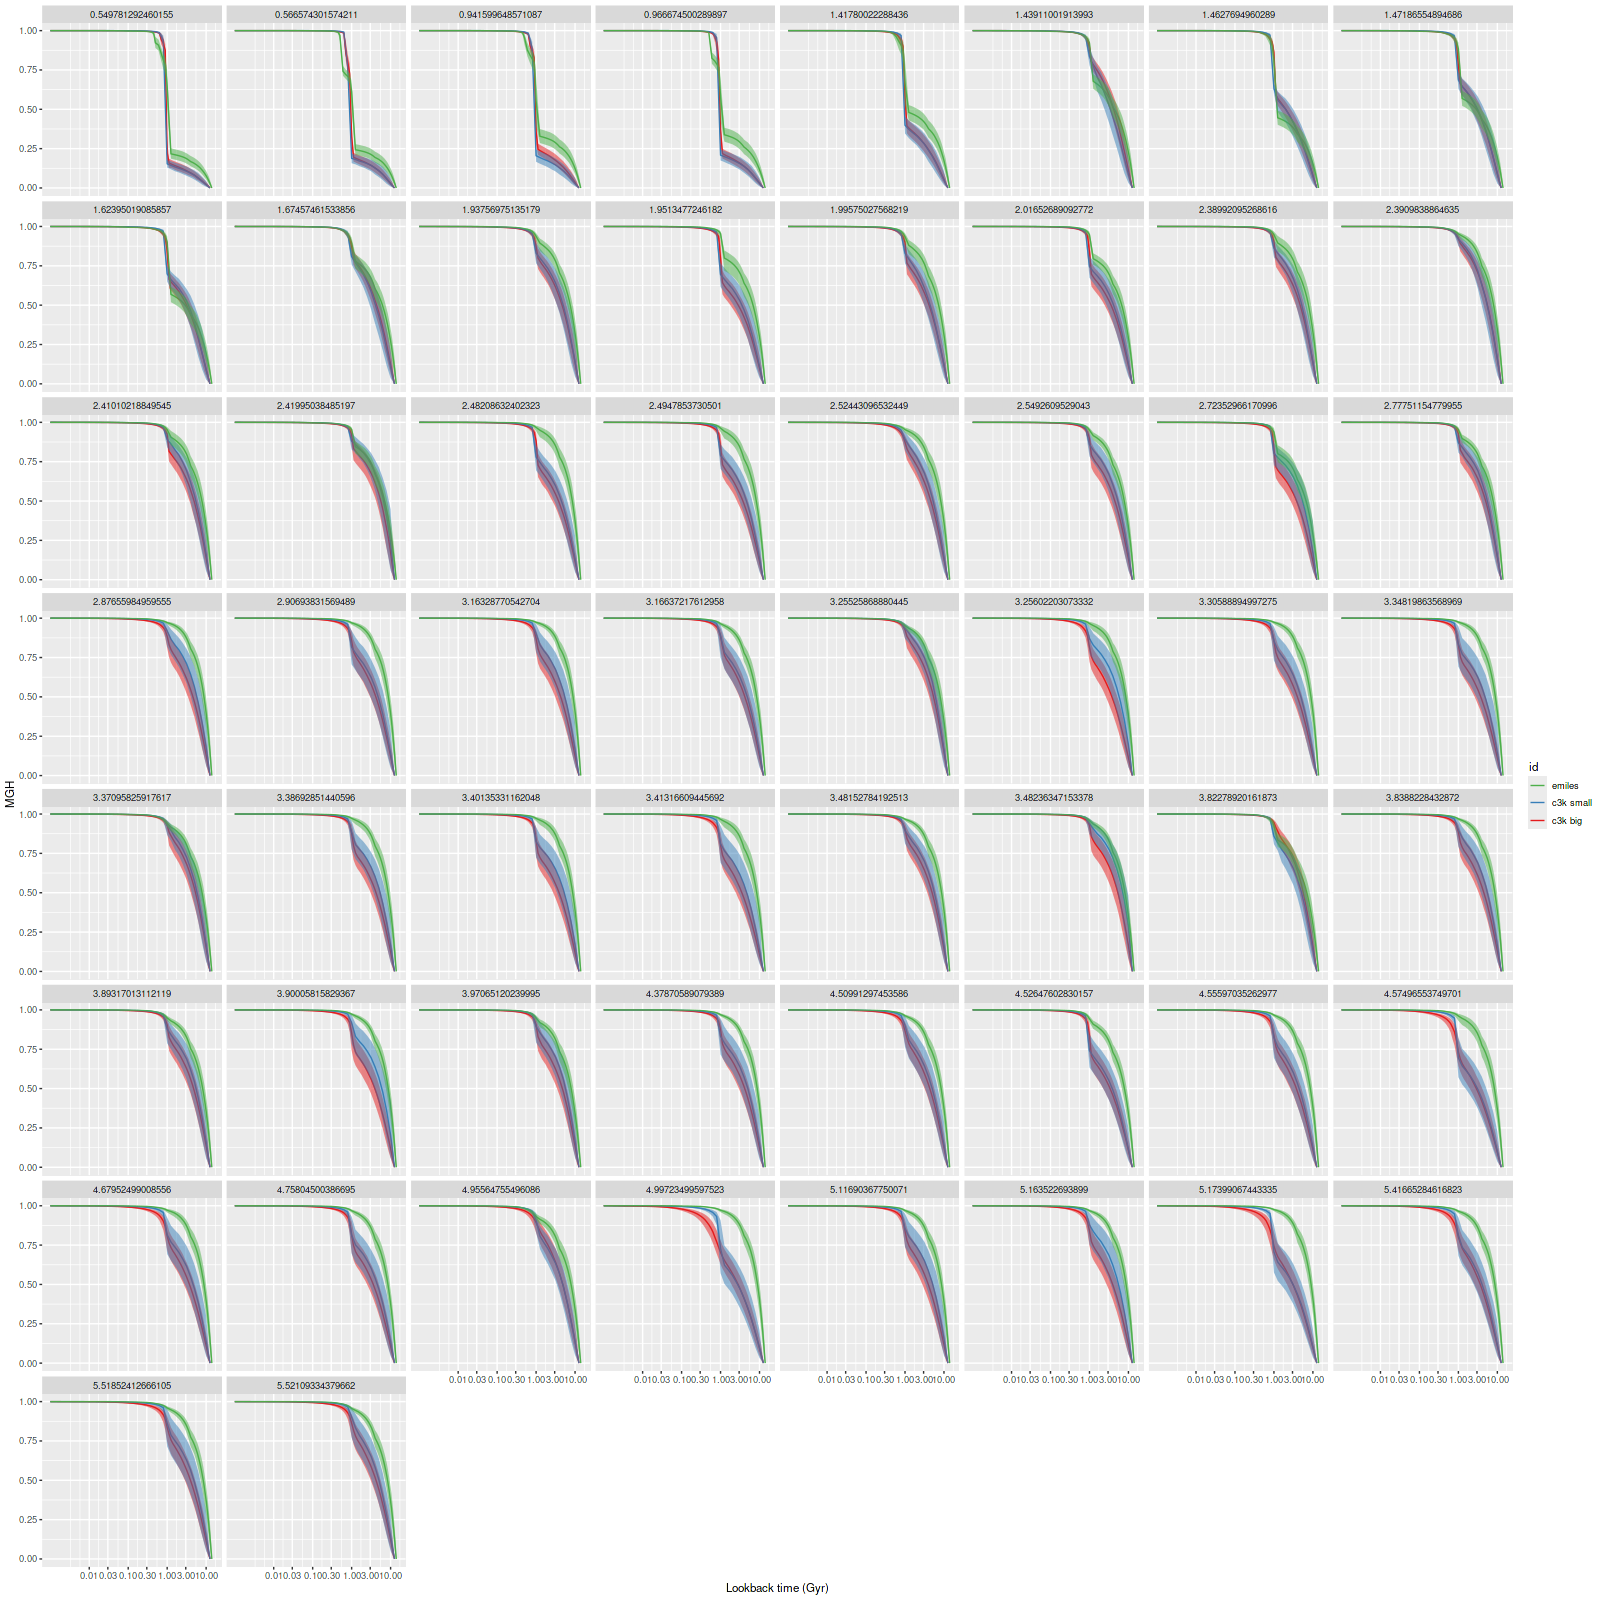
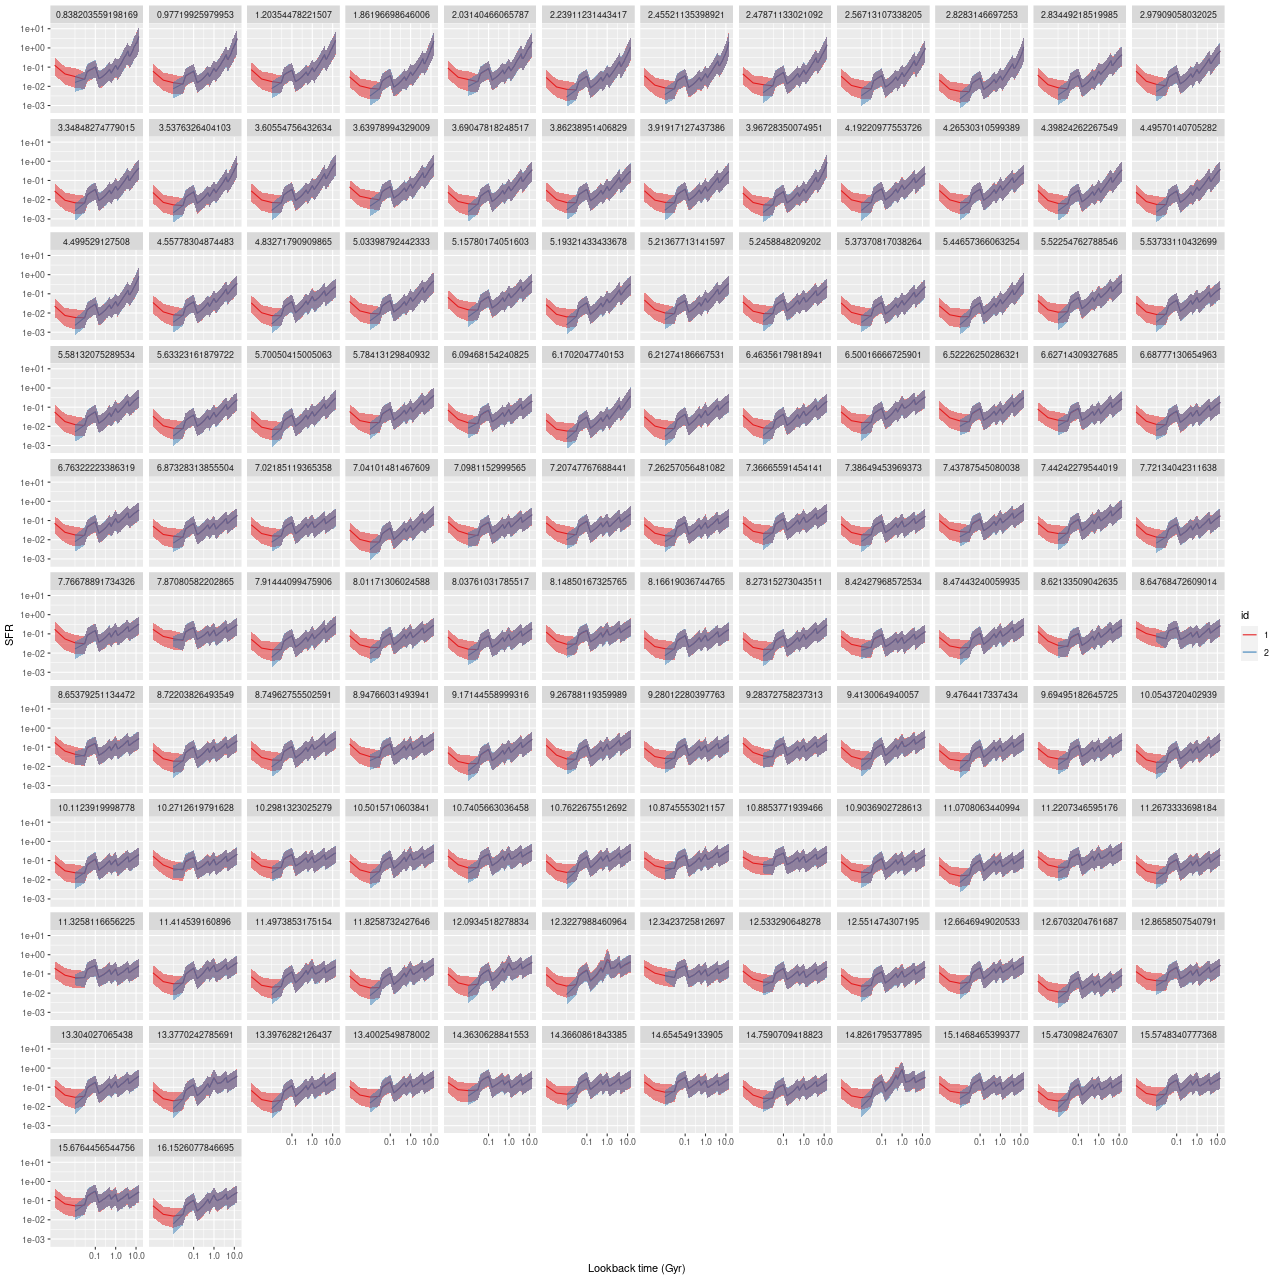
Plateifu 10220-3703 (mangaid 1-201936) Model star formation histories for all binned spectra and 3 distinct SSP model libraries
Plateifu 10220-3703 (mangaid 1-201936) Model mass growth histories for all binned spectra and 3 distinct SSP model libraries

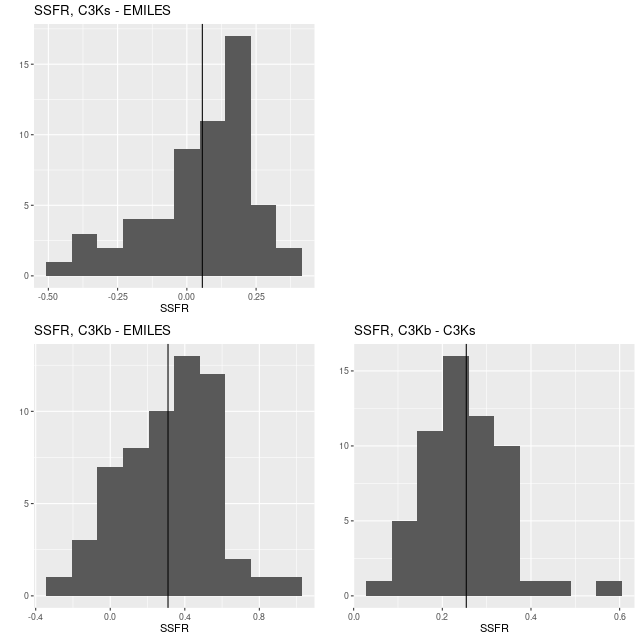
Here are pairwise differences in mean values between the models for some of the summary quantities I track. Some of the differences are fairly large, which just reinforces my longstanding opinion that true uncertainties are much larger than what’s captured in the posteriors of model runs.
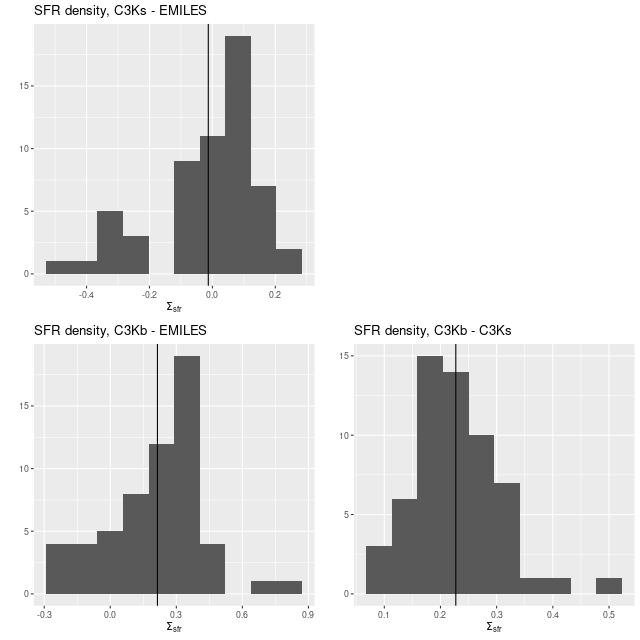
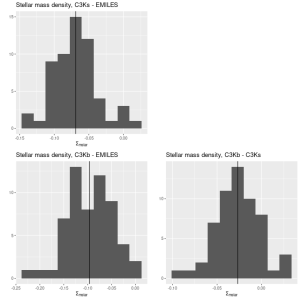
And finally, here is a closer look at star formation history models for the two fibers closest to the center:
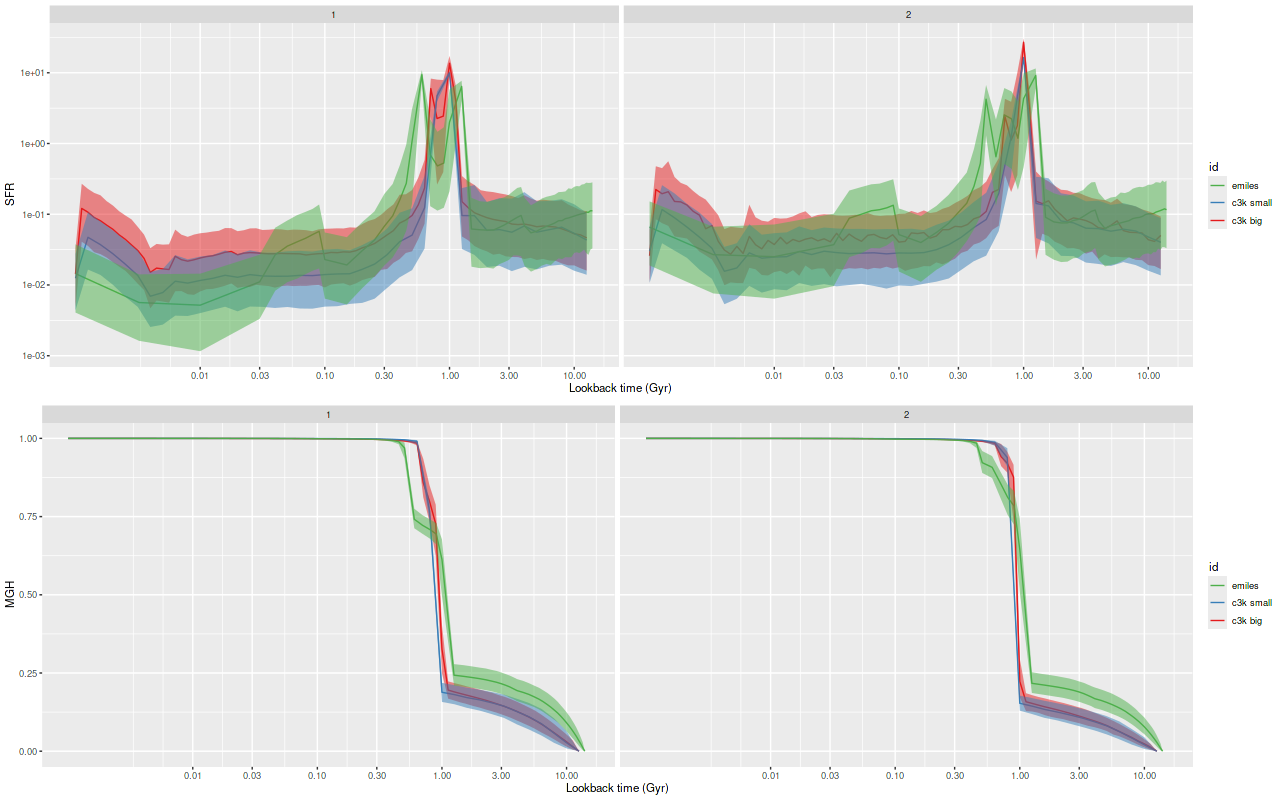
Plateifu 10220-3703 (mangaid 1-201936) SFH and mass growth history estimates for innermost 2 spectra and 3 SSP libraries

And here are (posterior predictive) fits to the data for the central spectrum with the large C3K based model (L) and EMILES (R). Both of these have some problematic areas, with some stretches of continuum and absorption line strengths “off” a bit. Note that the C3K model does better with the trough around 7200Ã…. The continuum upturn at the red end can also be seen in C3K model, which suggests I may want to consider truncating the model spectra a few hundred Ã…ngstroms to the blue. Overall though fits to the data are very similar, and there’s little difference between the “large” and “small” C3K subsets.
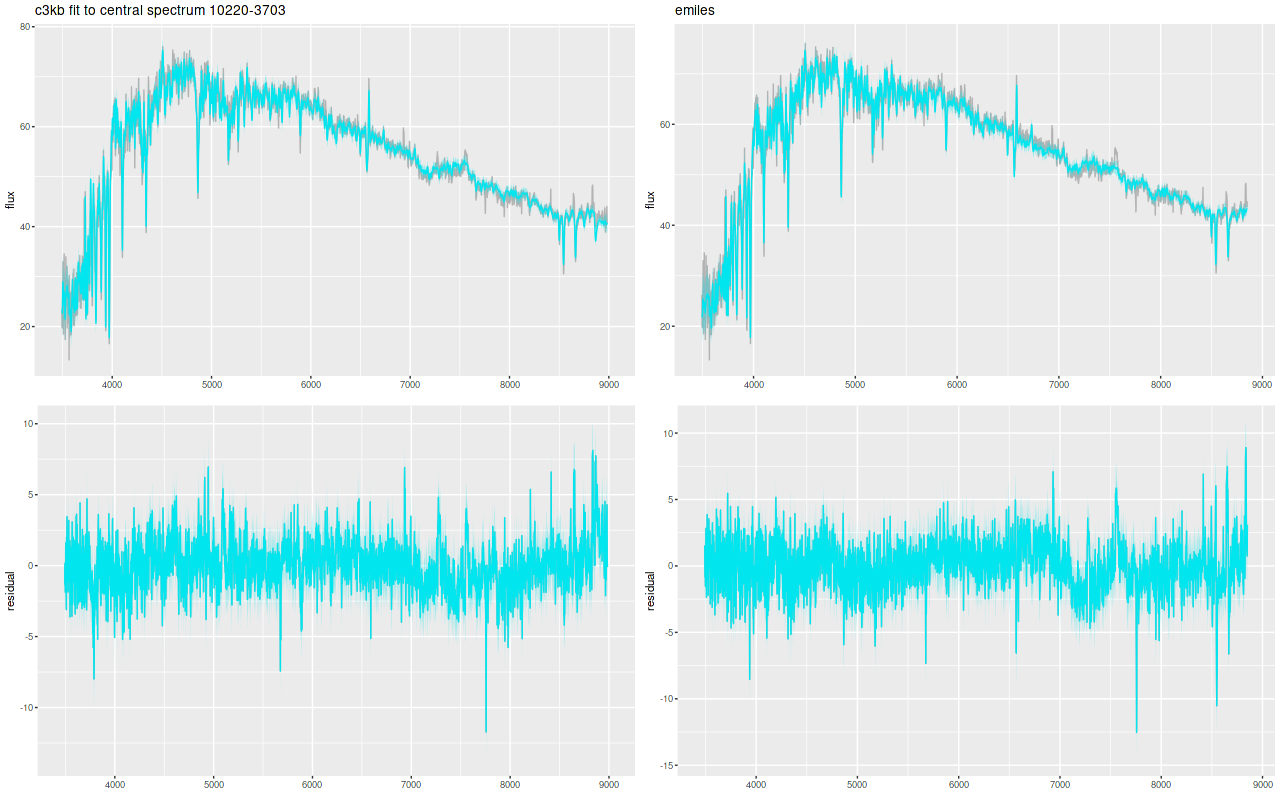
Plateifu 10220-3703 (mangaid 1-201936) fits to the central spectrum with C3K and EMILES libraries

ProGeny is a useful tool and I hope the authors will be able to maintain it and add new capabilities and data sources. I still have a few things to do before resuming a modeling campaign: most importantly perhaps choosing a final subset of the full library, specifically the number of age and metallicity bins. The execution time of a model run is roughly proportional to the number of stellar contribution parameters. For this data set the average time with the EMILES library (224 SSP model spectra) was 618 sec, 576 sec for the small C3K library (210 spectra), and 1038 sec. for the large C3K library (415 spectra). That’s more time than I’d like to take. Would it be preferable to have a coarser metallicity grid, say log(Z/Z☉) = {-0.75, 0, 0.5} with the full 0.05 dex age spacing or a finer metallicity grid with 0.1 dex age bins? I don’t know: some fake data exercises might be appropriate at this point.

I still have some interest in using the MaStar spectra but there are some technical issues to solve. For one thing the data available on Skyserver are corrected to above the atmosphere but not for galactic extinction and are just apparent flux values rather than absolute ones. They also need to be reduced to rest frame wavelengths. ProGeny’s model spectra have a very wide wavelength range, which I assume is required to make the integrated model flux equal to the bolometric luminosity. Even though I don’t really need wavelengths outside the range of BOSS spectra I would need to extend them somehow anyway. Finally (?) the parameter coverage (temperature, gravity, metallicity) is still not quite complete, especially at for hot stars and very luminous ones so it would still be necessary to supplement the base library.

Another look at the PYPOPSTAR SSP model library

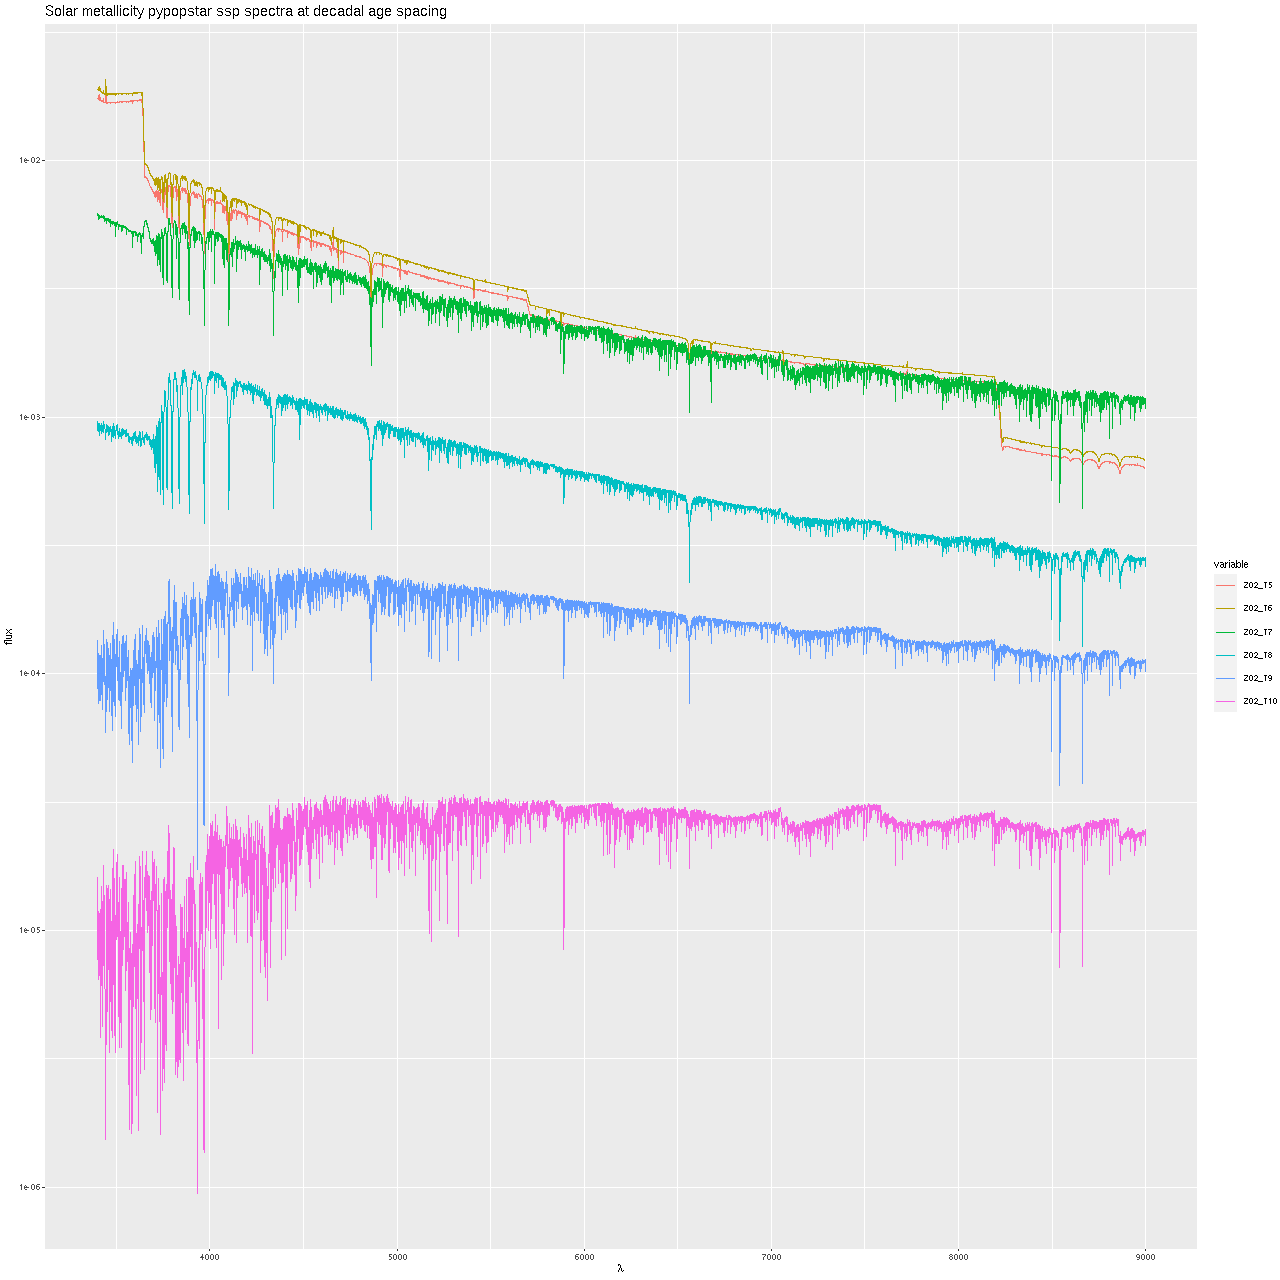
After a month off I returned to have another look at Millan-Irigoyen et al.’s high resolution “pypopstar” SSP model spectral libraries. First, I couldn’t find a more suitable subset of the full library than I used last time, so I decided just to try augmenting the existing Emiles based library with some younger spectra from pypopstar. Of course I had already done this with models from the 2013 update of BC03, so the plan was to replace those with a slightly finer grained selection at the young end. That raises the question of which ages to select. The youngest age model in the BaSTI isochrone based library is 30Myr (log T = 7.48), and we’re spoiled for choice of models at younger ages than that: there are 53 between log T = 5 and log T = 7.45, far more than necessary. Looking at the graph below, which just plots model spectra for the solar metallicity bin at decadal time invervals there’s very little spectral evolution between 105 and 106 years with the latter being slightly brighter at all relevant wavelengths. This is no surprise since even the most massive stars have main sequence lifetimes ∼106 years. The model spectra continue to get brighter up to around 106.6 years (4 Myr) and then turn around, becoming noticeably fainter and redder by 107 years.

pyspecz02
pypopstar solar metallicity model spectra in decadal age increments

I decided to take the log T = 6 models as youngest, discarding the sub Myr ones altogether. This is mostly due to the inability to distinguish them and also just for purposes of visualization. I usually use logarithmically scaled lookback time axes in SFH history plots, and selecting a minimum value of 5 results in too much real estate given to very recent times where usually nothing much is happening.

Without giving this a lot of thought I selected just 3 ages to add: log T = 6, 6.51, and 7. The youngest Emiles model is log T = 7.48, so this gives nearly constant increments around 0.5 dex. This choice gives a reasonably smooth transition from the theoretical spectra to empirical ones, except for maybe the lowest metallicity bin. I also chose the “total” spectra including both stellar and emission continuum light in hopes of better modeling the continuum in star forming galaxies. To merge the high resolution pypopstar models into the library I just used a spline fit to interpolate the model spectra onto the same wavelength grid as Miles. This should (I hope) preserve total flux nearly enough. A more refined treatment would also consider that these still have higher resolution than Miles spectra, which are around 2.5 Ã…. I didn’t take the time. The merged library therefore has 56 time bins times 4 metallicity bins for a total of 224 model spectra. I retained the same rest frame wavelength range (3464.9 – 8864 Ã…) as the Emiles subset I’ve been using for several years

youngspec_combo
The youngest SSP model spectra for the EMILES library augmented with young pypopstar spectra

The obvious next step is to use this library in some models and see how they compare to Emiles. Paging through my samples of spirals with MaNGA observations I picked, for no really good reason, this one:

MaNGA plateifu 8452-12703 (mangaid 1-148068)

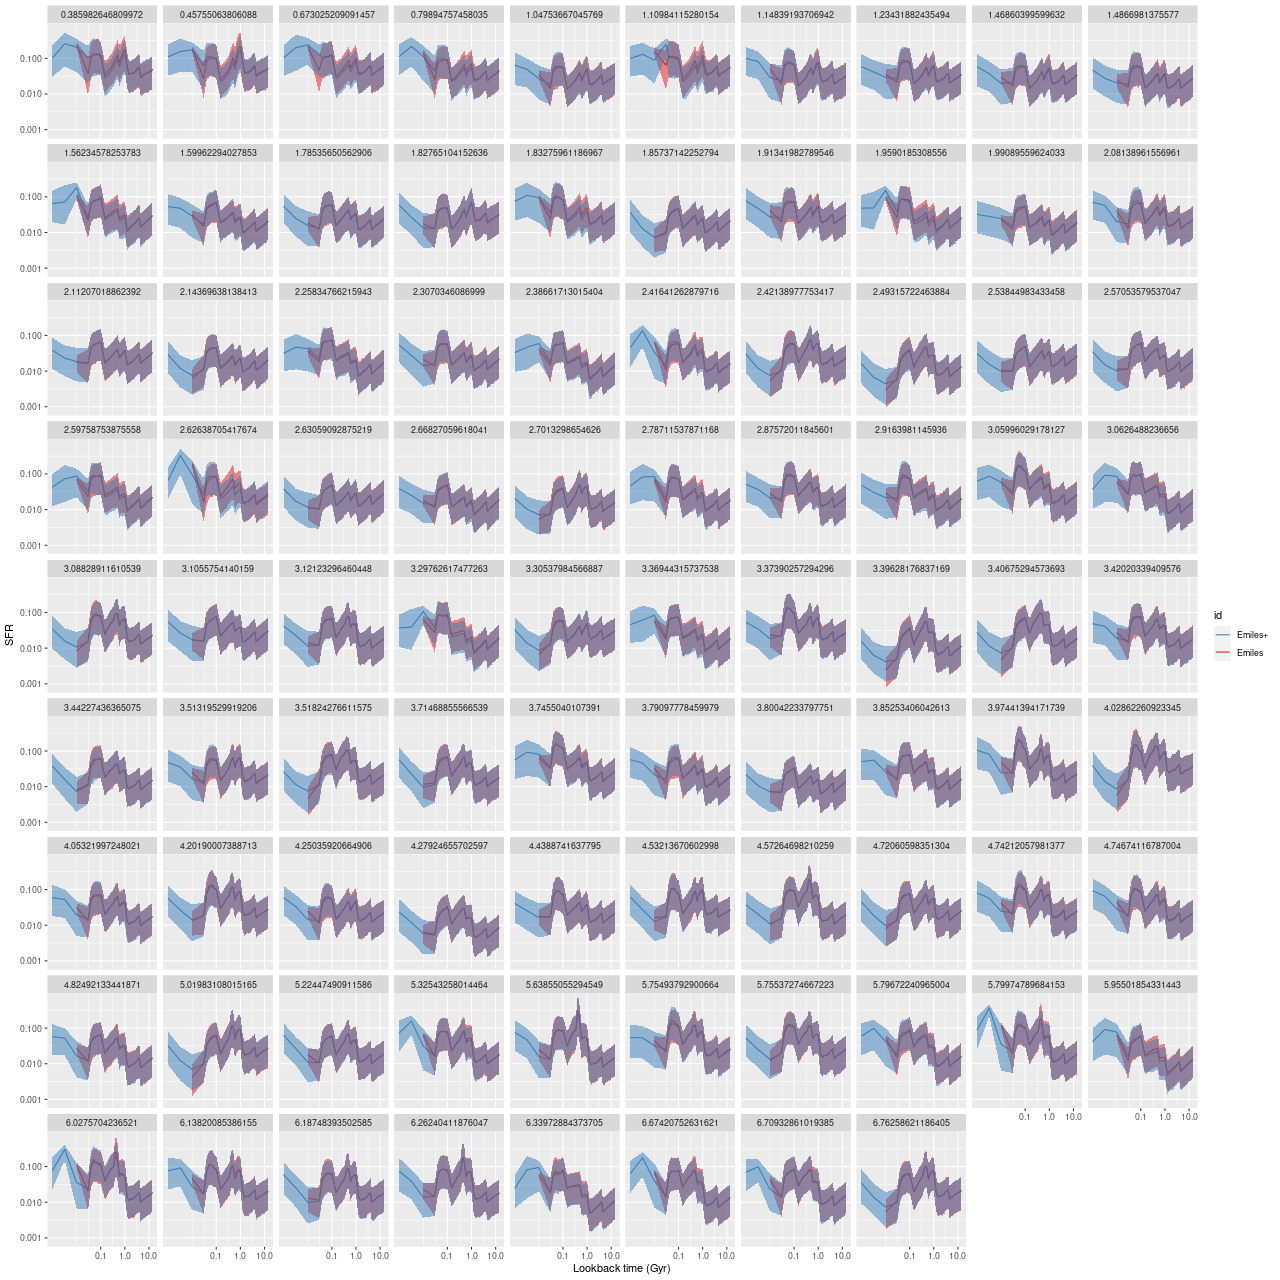
Clearly it has star forming regions in its arms as well as a prominent bar and rather red, possibly passively evolving nucleus. After binning to my usual threshold S/N of 5 there were 122 spectra, which were analyzed in the usual way using both Emiles and Emiles + popstar. And here’s the main result of interest, the model star formation histories for all 122 spectra, ordered by distance from the nucleus.

Model star formation histories for MaNGA plateifu 8452-12703 compared. Red: Emiles + pypopstar Blue: Emiles + BC03

There’s little or no difference in the model star formation histories for the common components of the libraries. The pypopstar components indicate that the star formation rate continues at relatively constant rates up to recent times. The modest differences at the young end don’t necessarily mean anything. I more or less arbitrarily assigned an age of 10Myr to the BC03 model spectra, which were actually taken from 1Myr models. There’s no real way to tell what the actual effective age of those contributors is — if it’s typically younger than 10Myr the SFR in the youngest bin would be correspondingly higher and a little lower in the next age bin.

Given the similarities in the detailed star formation histories it shouldn’t be much of a surprise that summary quantities are quite similar too. To illustrate a few, here are mean values of the stellar mass surface density:

Model mean values of stellar mass density for MaNGA plateifu 8452-12703 compared — Emiles + pypopstar vs Emiles + BC03

the star formation rate surface density (100 Myr average):

Model mean values of SFR density for MaNGA plateifu 8452-12703 compared — Emiles + pypopstar vs Emiles + BC03

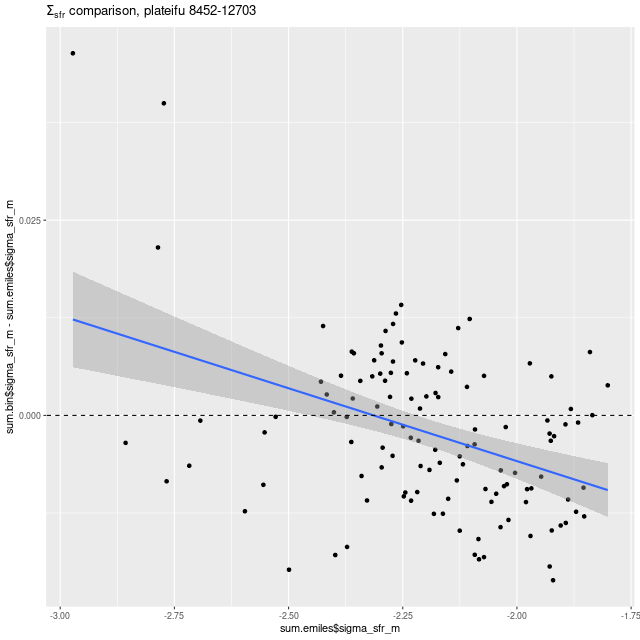
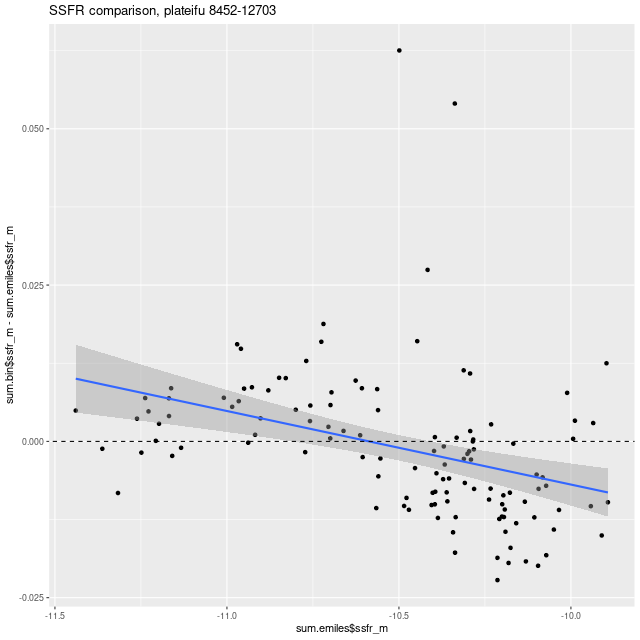
The specific SFR:

ssfr_comp
Model mean values of SSFR for MaNGA plateifu 8452-12703 compared — Emiles + pypopstar vs Emiles + BC03

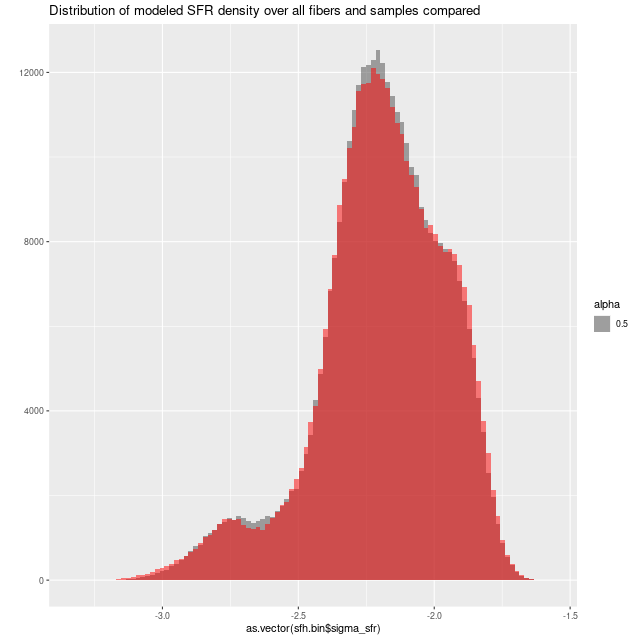
The lines with confidence intervals in these plots are from OLS fits taking no account of nominal uncertainties in either sets of variables, and shouldn’t be used to infer any trends. In any case all differences are very small. Finally, here are histograms of all sample values of SFR density for all spectra. Again, these are nearly identical:

sigma_sfr_dist_comp
Sample distributions of SFR density over all spectra compared — Emiles + pypopstar vs Emiles + BC03

After running multiple sets of models it became apparent that this wasn’t a very stringent test of the usefulness of the proposed library additions because this galaxy has very anemic star formation. In fact it’s one of Masters et al.‘s “passive” red spirals, which I should have recognized. It was also one of the first several dozen galaxies with AGN found in MaNGA, which doesn’t necessarily (but might, along with perhaps the prominent bar) account for the weak star formation. My model runs show “LINER” like emission line ratios in the center, which does point to the presence of a weak AGN.

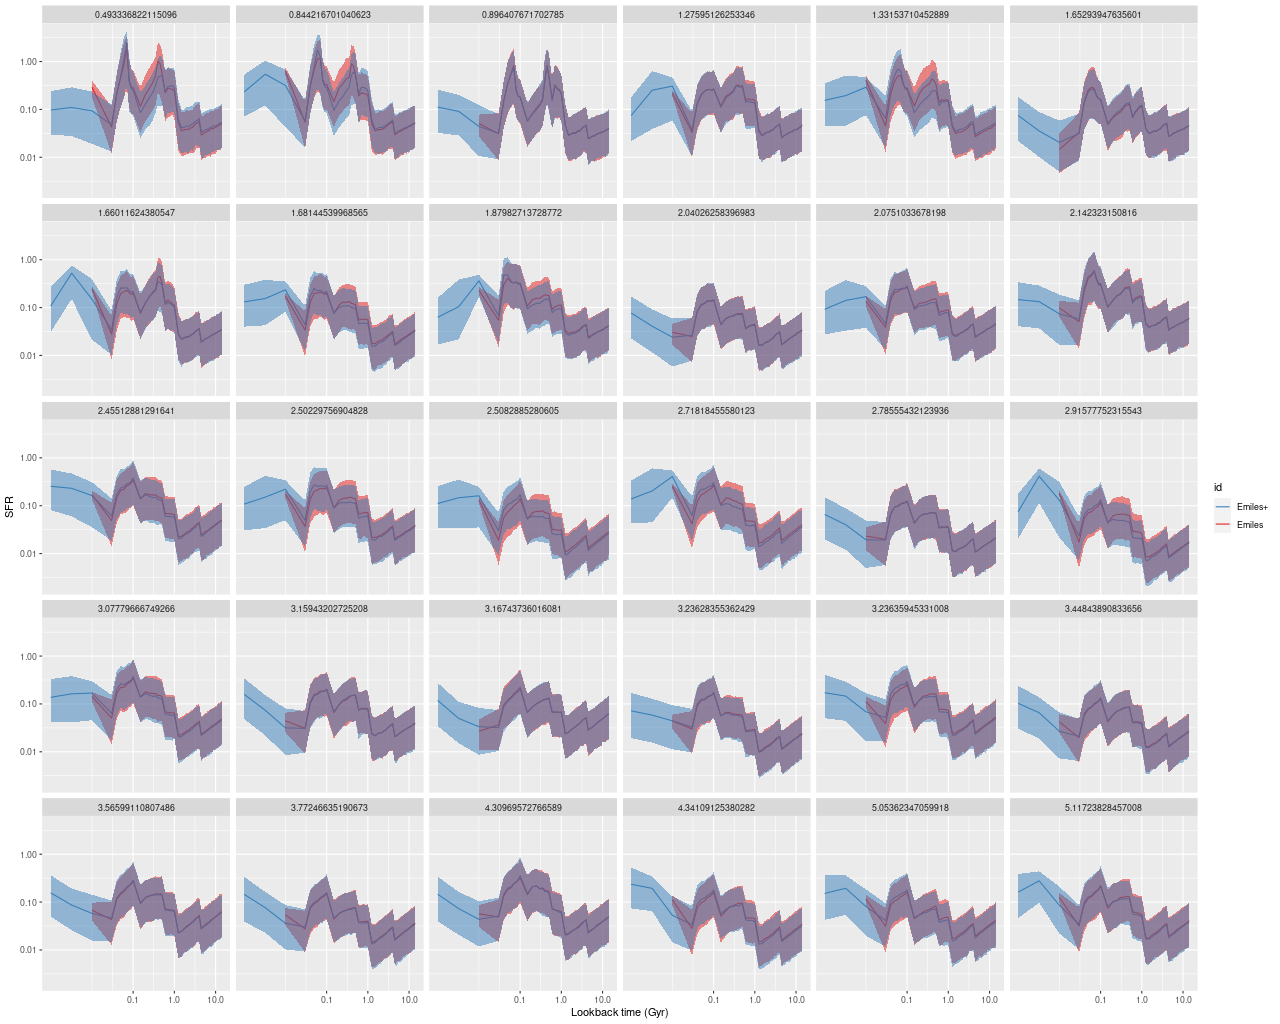
Briefly now, I picked two more disk galaxies with obvious regions of vigorous star formation and repeated this exercise. To make this short I’m just going to post the star formation histories for all binned spectra.

MaNGA plateifu 8449-3703 (RA 169.299, DEC 23.586)

MaNGA 1-488712, plateifu 8449-3703 — SDSS cutout
Model star formation histories for MaNGA plateifu 8449-3703 compared. Blue: Emiles + pypopstar Red: Emiles + BC03

MaNGA plateifu 8318-9101 (RA 196.086 DEC 45.057)

MaNGA 1-259618, plateifu 8318-9101 — SDSS cutout
Model star formation histories for MaNGA plateifu 8318-9101 compared. Blue: Emiles + pypopstar Red: Emiles + BC03

Spectra in nearby age and metallicity bins are highly corrrelated, which among other things means that adding or subtracting some from the set of “predictors” potentially changes the values inferred for others as well. In these two sets of model runs we do see some differences in the common Emiles portion of the libraries, but they’re quite small and change no qualitative inferences. So my conclusion for now is that adding these theoretical spectra is a reasonable strategy, but one that doesn’t have much apparent impact on model results.

Well that’s probably all for a while. The final MaNGA data release is now promised for December 2021, which should approximately double the number of galaxies and I hope offer some data reduction improvements. There will also be a very large release of stellar spectra that should form the basis for new SSP libraries in the (hopefully) near future.

One final look at KUG0859+406 and a new SSP model library

Back in July a paper by Millan-Irigoyen et al. titled “HY-PYPOPSTAR: high wavelength-resolution stellar populations evolutionary synthesis model” was posted to arxiv, and shortly thereafter data in the form of the promised high resolution spectra were made available at https://www.fractal-es.com/PopStar/#ingredients. Unlike MILES and its variations or BC03 this is a purely theoretical library, with the spectra calculated from model atmospheres instead of using empirical spectra of actual stars.

I looked briefly at one other theoretical library some time ago and concluded (IIRC) that the model spectra had much too blue continua at all ages, making it unsuitable for full spectrum fitting. A brief visual inspection of this library (as well as Figure 8 in the paper) indicates that’s not the case here. One thing that may compromise its usefulness is that although there are 106 age bins in the models they are very irregularly spaced and heavily weighted towards younger ages as shown below.

Age rangeNumber of spectra
5 ≤ log T < 64
6 ≤ log T < 734
7 ≤ log T < 835
8 ≤ log T < 99
9 ≤ log T < 1015
log T ≥ 109
Number of SSP model spectra by age range in HR-pypopstar

At least in the wavelength range of SDSS/MaNGA spectra there is little evolution in spectroscopic properties between 105 and 106 years and even though it speeds up afterwards the effective time resolution of SFH models is still lower than the supplied number of time bins for the next two decades.

pypop_young_spec
Sample young population spectra from hrPypopstar

For a preliminary look at the library’s suitability for full spectrum modeling I selected a 42 time bin subset with all 4 available metallicity bins and Kroupa IMF, truncating the wavelength range to 3400-9000 Ã…, which is just a little larger than the Emiles subset I use. The time bins were chosen by hand — I was trying to get evenly spaced bins in log time but this proved not to be feasible. The authors produced two sets of libraries for each of 4 IMFs: they did an apparently careful job of counting the number of ionizing photons for several species and calculated sets of SSP models with and without emission continuum. For these trial runs I used both sets of libraries, which I’ll compare below. No code modifications were required because they use the same peculiar but computationally convenient flux units for spectra.

I just ran a few models for the central fiber spectrum of KUG 0859+406 (MaNGA plateifu 8440-6104). First, here is the star formation rate history compared to the most recent Emiles run:

sfh_emiles_popstar
Model star formation histories for central fiber of MaNGA plateifu 8440-6104
(T) Emiles
(M) hrPypopstar with emission continuum (
B) hrPypopstar stellar light only

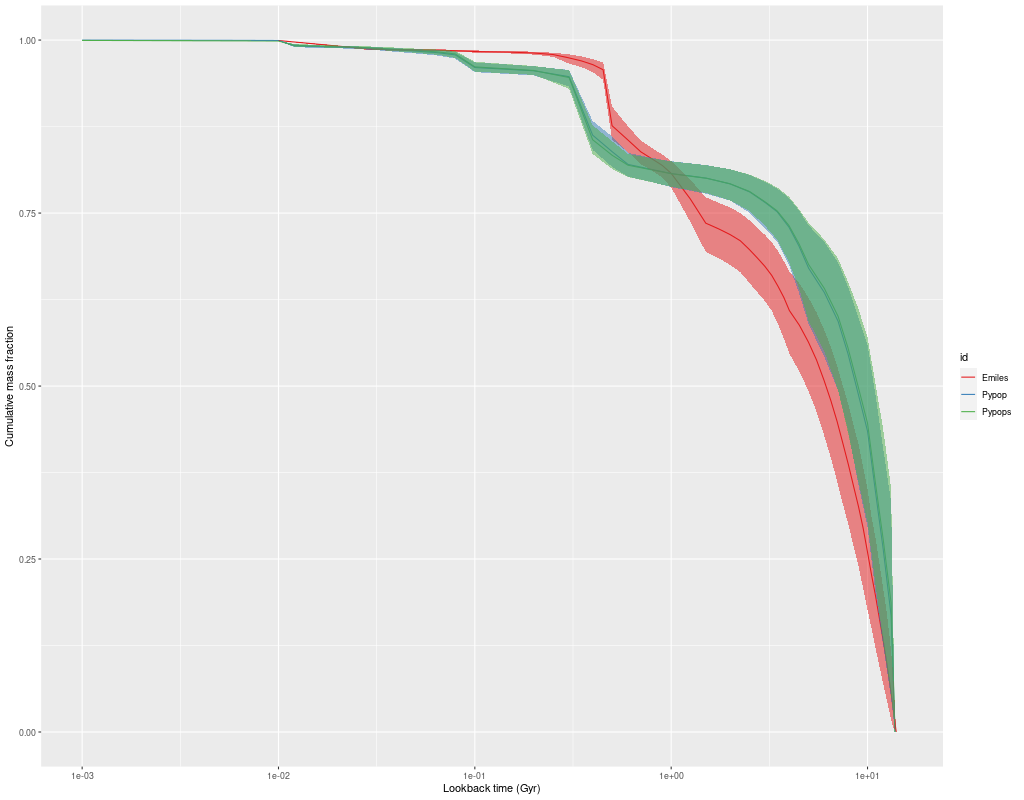
Or, looking at the model mass growth histories:

mgh_emiles_popstar
Model mass growth histories for central fiber of MaNGA plateifu 8440-6104 Red: Emiles Blue: hrpypopstar including emission continuum Green: hrpypostar stellar light only

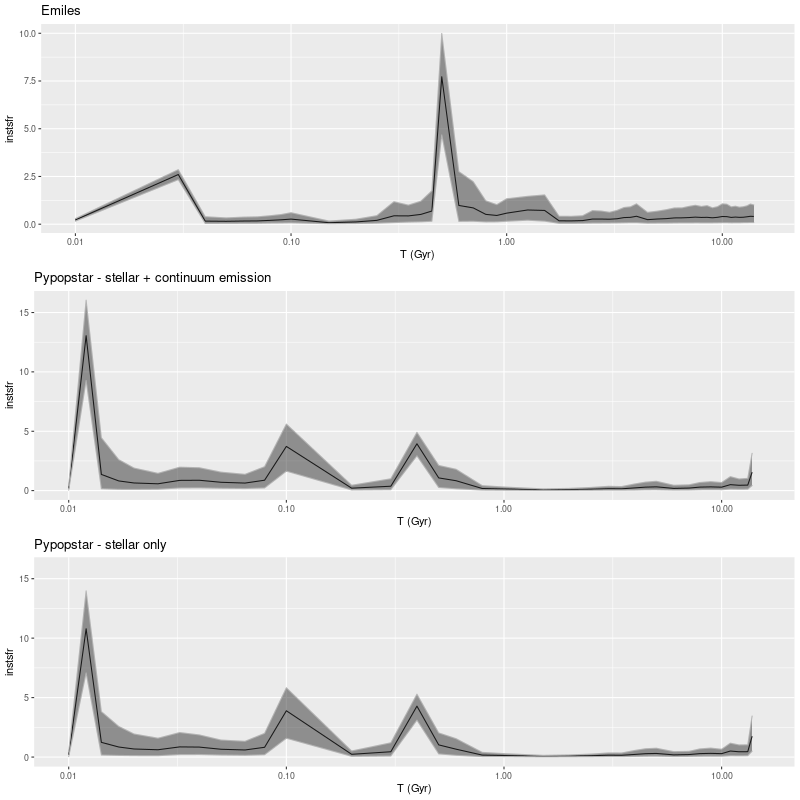
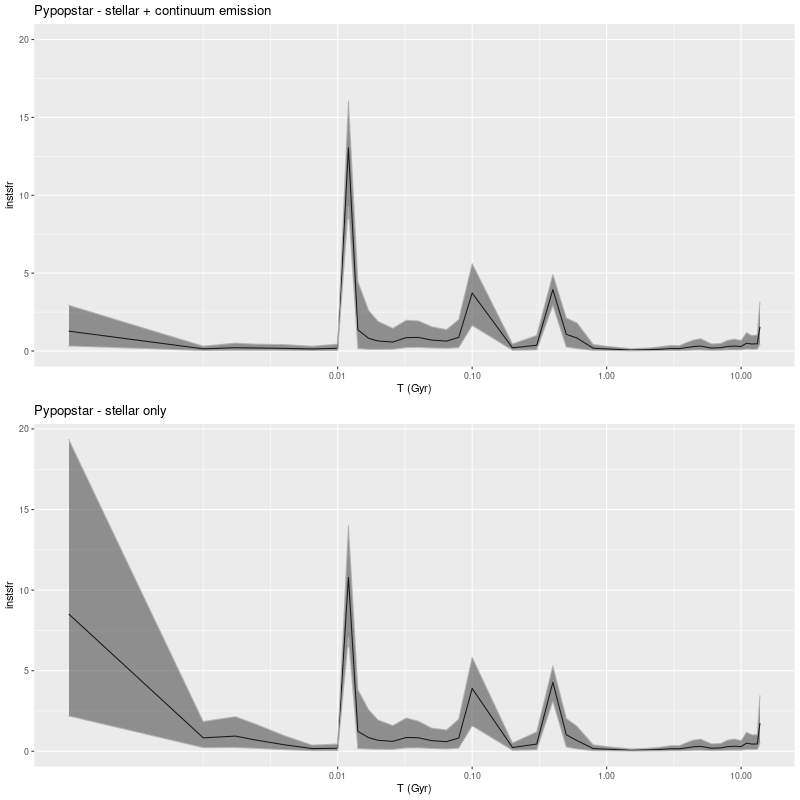
The starburst occurs later and is somewhat weaker in the pypopstar models. Interestingly all models have a late time revival of star formation after a period of quiescence. To get all the graphs to line up I truncated the pypopstar model star formation histories at 10 Myr. Here are the full histories:

sfh_popstar_popstarst
Model star formation histories for central fiber of MaNGA plateifu 8440-6104 (T) hrPypopstar with emission continuum (B) hrPypopstar stellar light only

Emission continuum is significant mostly at ages < 10Myr and this is reflected in some difference in late time model star formation histories. This has little effect on other modeled quantities.

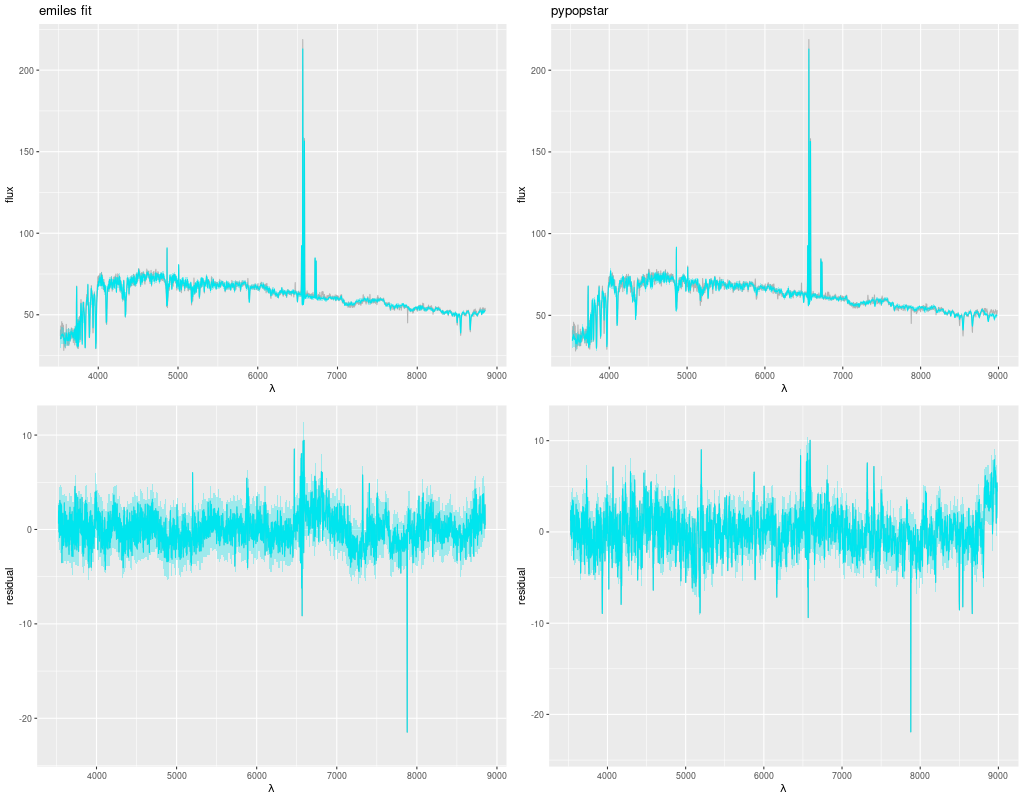
At a glance fits to the galaxy flux data look very similar. Both sets of models have problems in some wavelength ranges and both have some issues with the [N II]+Hα emission complex, probably because the lines don’t quite have gaussian profiles. In terms of summed log-likelihood the Emiles fit is actually almost a factor of 2 better than pypopstar.

ppfits_compared
Comparison of model fits to data (L) Emiles (R) Hrpypopstar

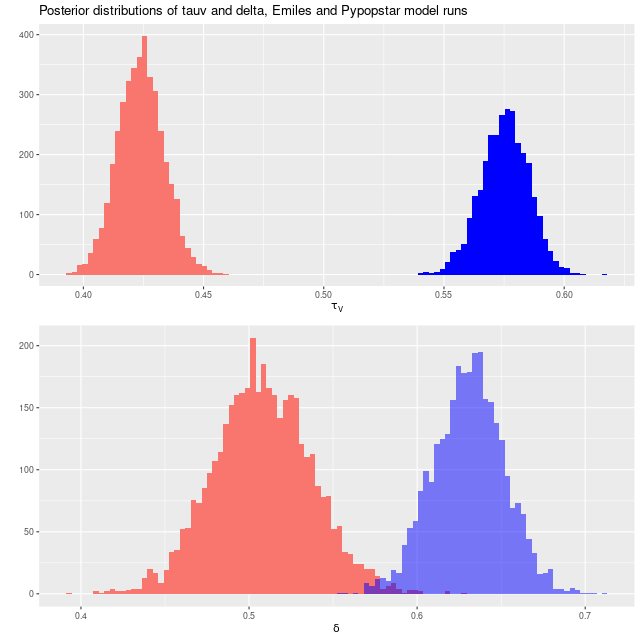
The pypopstar models have larger optical depths of attenuation and steeper attenuation curves than the Emiles models, demonstrating once again the interplay among attenuation, attenuation relationship, and stellar ages:

tauv_delta_emiles_pypostar
Model distributions of attenuation parameters τV and δ for runs with Emiles library and hrPypopstar on the central fiber of MaNGA plateifu 8440-6104

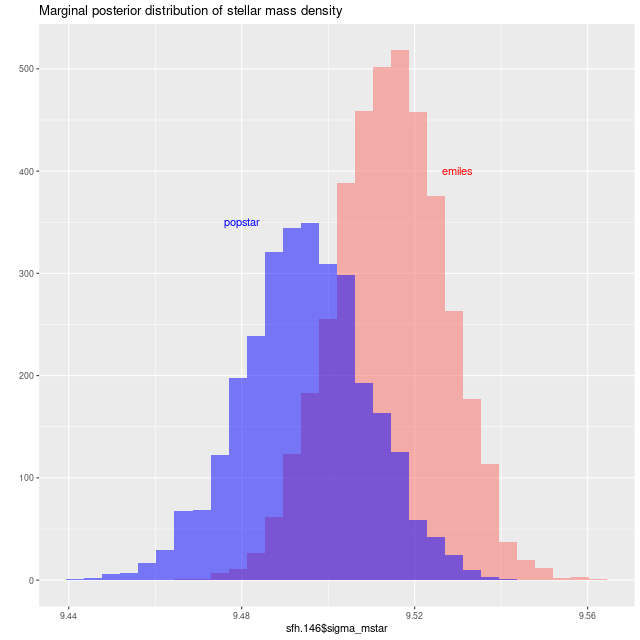
Some other modeled quantities are very similar, for example the stellar mass density:

sigma_mstar_comp
Comparison of model stellar mass density red: Emiles blue: hrpypopstar with emission continuum

While the modeled specific star formation rate differs by ~0.4 dex thanks to the more recent starburst in the pypopstar models:

ssfr_comp
Comparison of model specific star rate (sSFR) red: Emiles blue: hrpypopstar with emission continuum

I still haven’t decided exactly what to do with these interesting SSP model libraries. I will probably take a more systematic look at extracting a subset of time bins that evolve at a consistent rate by some measure. This will certainly require many fewer than the published 106 bins. What may be more promising is to graft some young age SSPs onto my existing Emiles library. The 4 published metallicity bins are pretty closely matched to the Emiles subset I use, and 4 or 5 SSP’s would fill out the ages up to the youngest (30 Myr) in the BaSTI isochrones. I already use unevolved BC03 models for this purpose. Using the models that include continuum emission would also solve the problem of how to model that in starforming galaxies (but not galaxies with strong AGN emission unfortunately).
Arxiv notes: Wu (2021), “Searching for local counterparts of high-redshift post-starburst galaxies…”

This paper (arxiv ID 2103.16070) is pretty old by now, having been posted on arxiv back in early April. The basic premise of the work is mildly interesting: the author searched MaNGA for galaxies that would meet conventional criteria for post-starburst (aka K+A etc.) spectra if observed at a redshift high enough that the entire galaxy would be covered by a single fiber like the original SDSS spectroscopes. Somewhat surprisingly, he found just 9 that met his selection criteria in the DR15 sample of ~4500 galaxies.

I have to say the paper itself is forgettable, but a manageably sized sample of MaNGA data that’s complete by some criterion is worth a look, and I have a long-standing interest in post-starburst galaxies in particular. So, I ran my current SFH modeling code on all 9 — by the way this was completed some time ago. It’s just taken me a while to get around to generating some graphics and sitting down to write.

The author only measured a few observable quantities: Hδ equivalent width and the 4000Ã… break index Dn(4000), along with Hα emission equivalent width and (normalized) fluxes. I long ago validated my own absorption line measurements of SDSS single fiber spectra against the MPA-JHU measurement pipeline, which was the gold standard for several years (but last run on DR8). My measurements and uncertainty estimates are in excellent agreement with theirs, so I have a fair amount of confidence in them. Emission line fluxes also agree with published measurements with considerably more scatter. My emission line equivalent widths on the other hand are completely unchecked. So, one of my tasks was to compare my equivalent width measurements with Wu’s. I did not attempt to exactly reproduce his work – I binned spatially using my usual Voronoi partitioning approach whereas Wu binned in elliptical annuli. With that difference in mind the next two plots should be compared to his Figures 4 and 5.

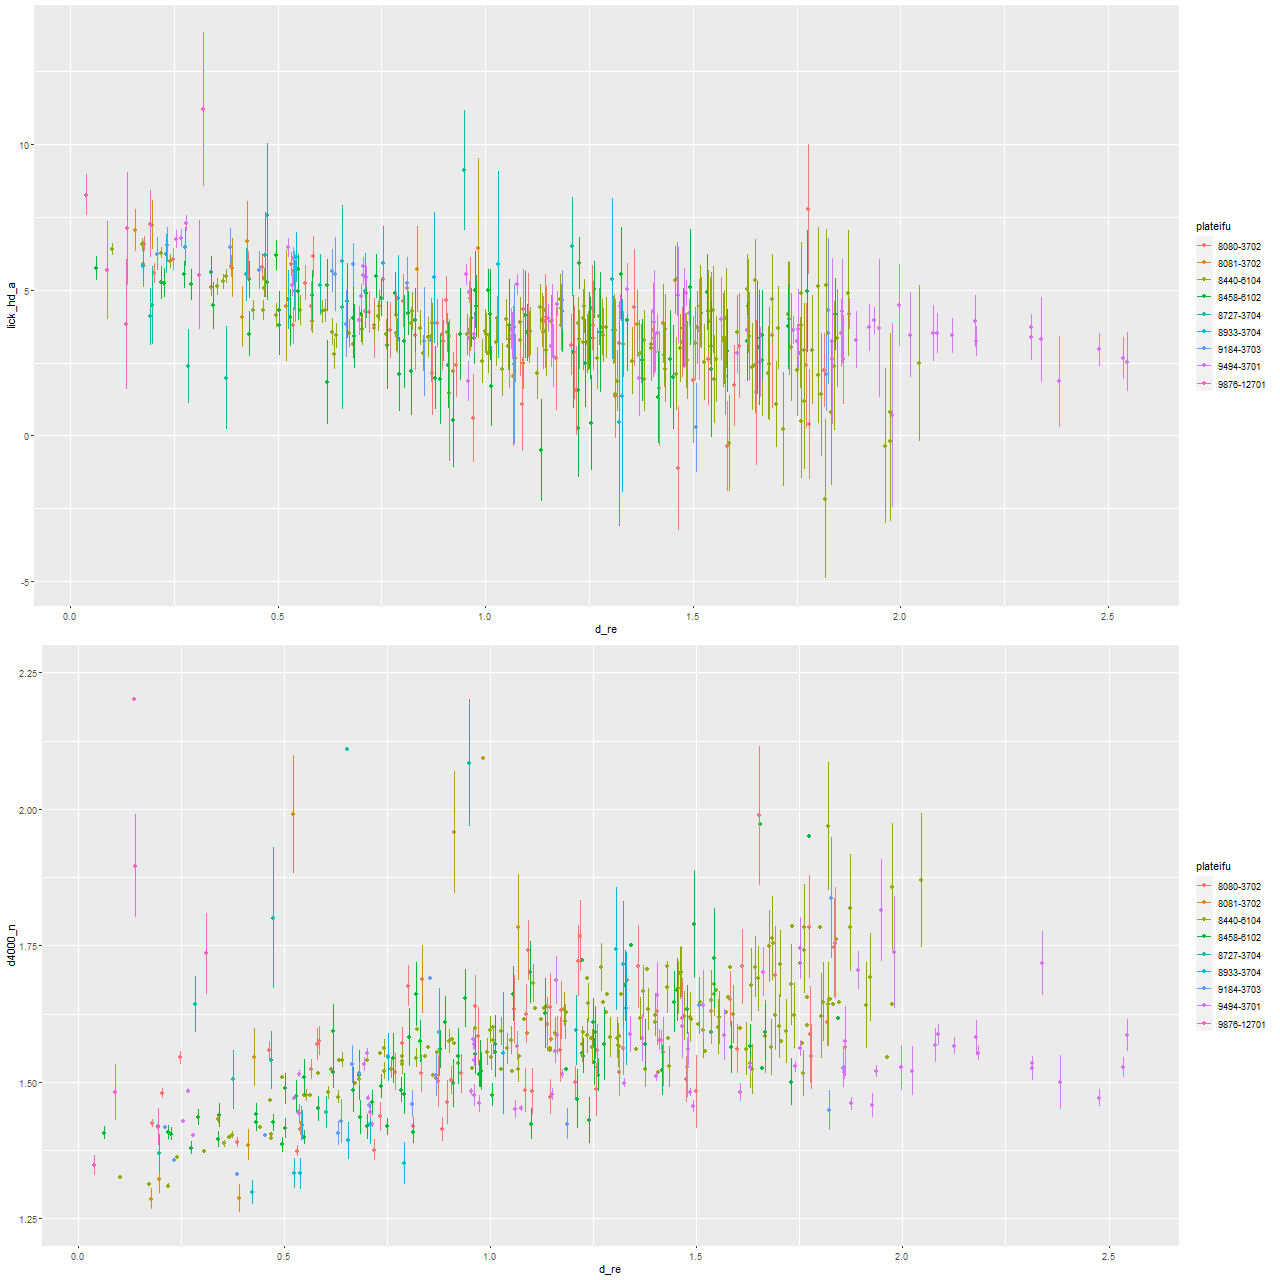
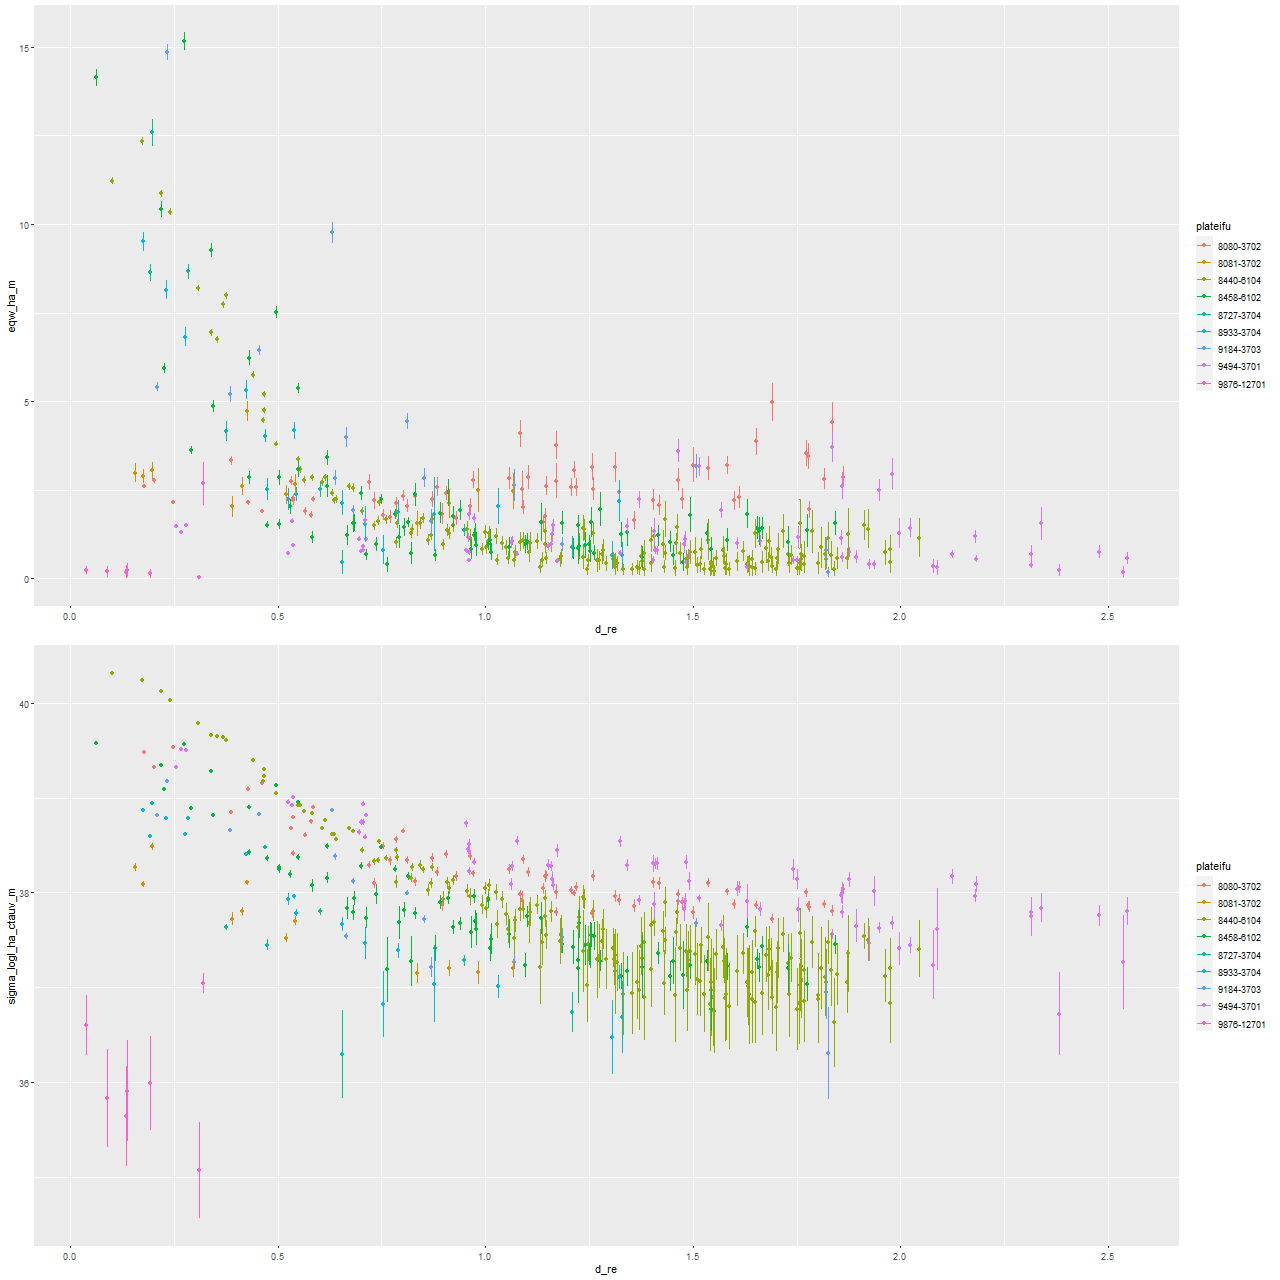
The first two graphs show the radial trends (relative to the effective radii per the NASA/SLOAN catalog) in the Lick HδA and Dn(4000) indexes. These both show very similar trends to Wu’s measurements although with more scatter. This is expected because fewer spectra go into each point in general — from the text it appears Wu binned several separate measurements for each displayed point. Also, I made no attempt to deproject distances. One feature of the Hδ versus radius plot that’s a little different is the trend generally flattens out beyond ∼1 effective radius, while Wu shows a roughly linear trend out to 1.5 Re. This might just be a visible effect of me displaying the trends out to larger radii.

d4000_hdelta_re
Radial trends of Lick HδA and Dn4000 for 9 MaNGA “post-starburst” galaxies from Wu (2021) – arxiv 2103.16070

The Hα emission line measurements are similarly in broad agreement. Like Wu, I find that there are two distinct trends in emission: either moderately strong centrally with a rapid decline or weak throughout with a relatively flat trend. One galaxy (with MaNGA plateifu 9876-12701) has no detectable emission. I haven’t looked in detail at emission line ratios to compare to Wu’s Figure 7, but there’s general agreement that some residual star formation is present in some of the sample and weak AGN or ionization by hot evolved stars in others.

Radial trends of Lick Hα equivalent width and luminosity density for 9 MaNGA “post-starburst” galaxies from Wu (2021) – arxiv 2103.16070

A fairly common failing of this literature (IMO) is the use of proxies for recent star formation but not attempting actually to model star formation histories. There are plenty of publicly available tools for that available now, so there’s really no reason not to perform such modeling exercises. Wu did do some toy evolutionary modeling and posted a graph of trajectories through the Hα emission – Hδ absorption plane, which can scarcely unambiguously constrain star formation histories. Of course much of my hobby time is spent generating fine grained model star formation histories, so let’s take a look at a few selected results.

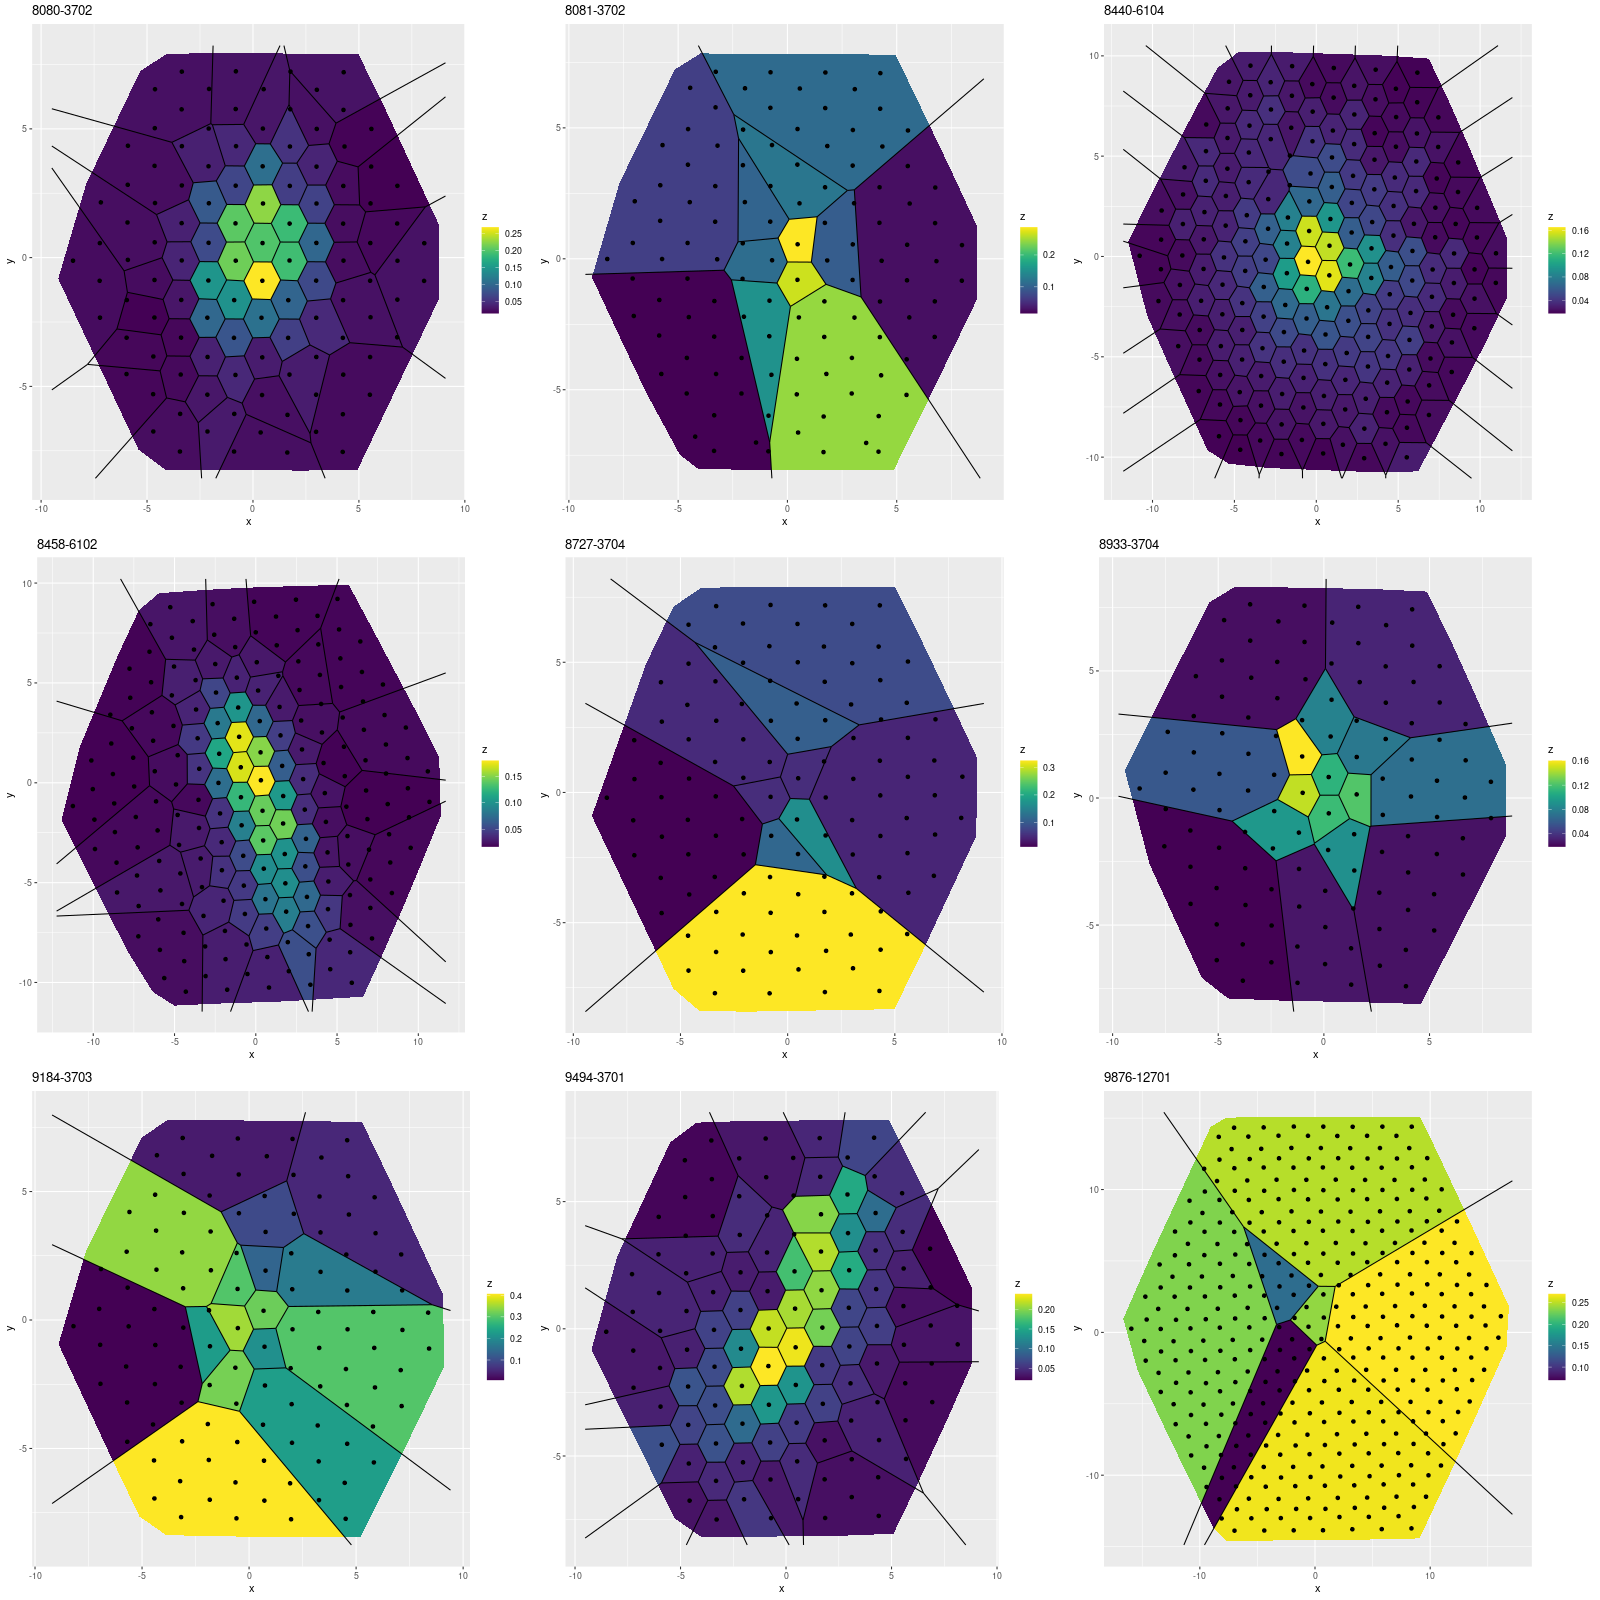
First, here are maps of the modeled fraction of the current stellar mass in stars of ages between 0.1 and 1 Gyr, very roughly the age range that produces a post-starbursty spectrum. Six of the galaxies have more or less strongly centrally concentrated intermediate age populations, which is generally what’s expected especially in the major merger pathway to a post-starburst interval. I’ll discuss this a little further below.

burst_fraction_maps
Maps of fractional stellar mass in intermediate age populations for 9 MaNGA “post-starburst” galaxies from Wu (2021) – arxiv 2103.16070

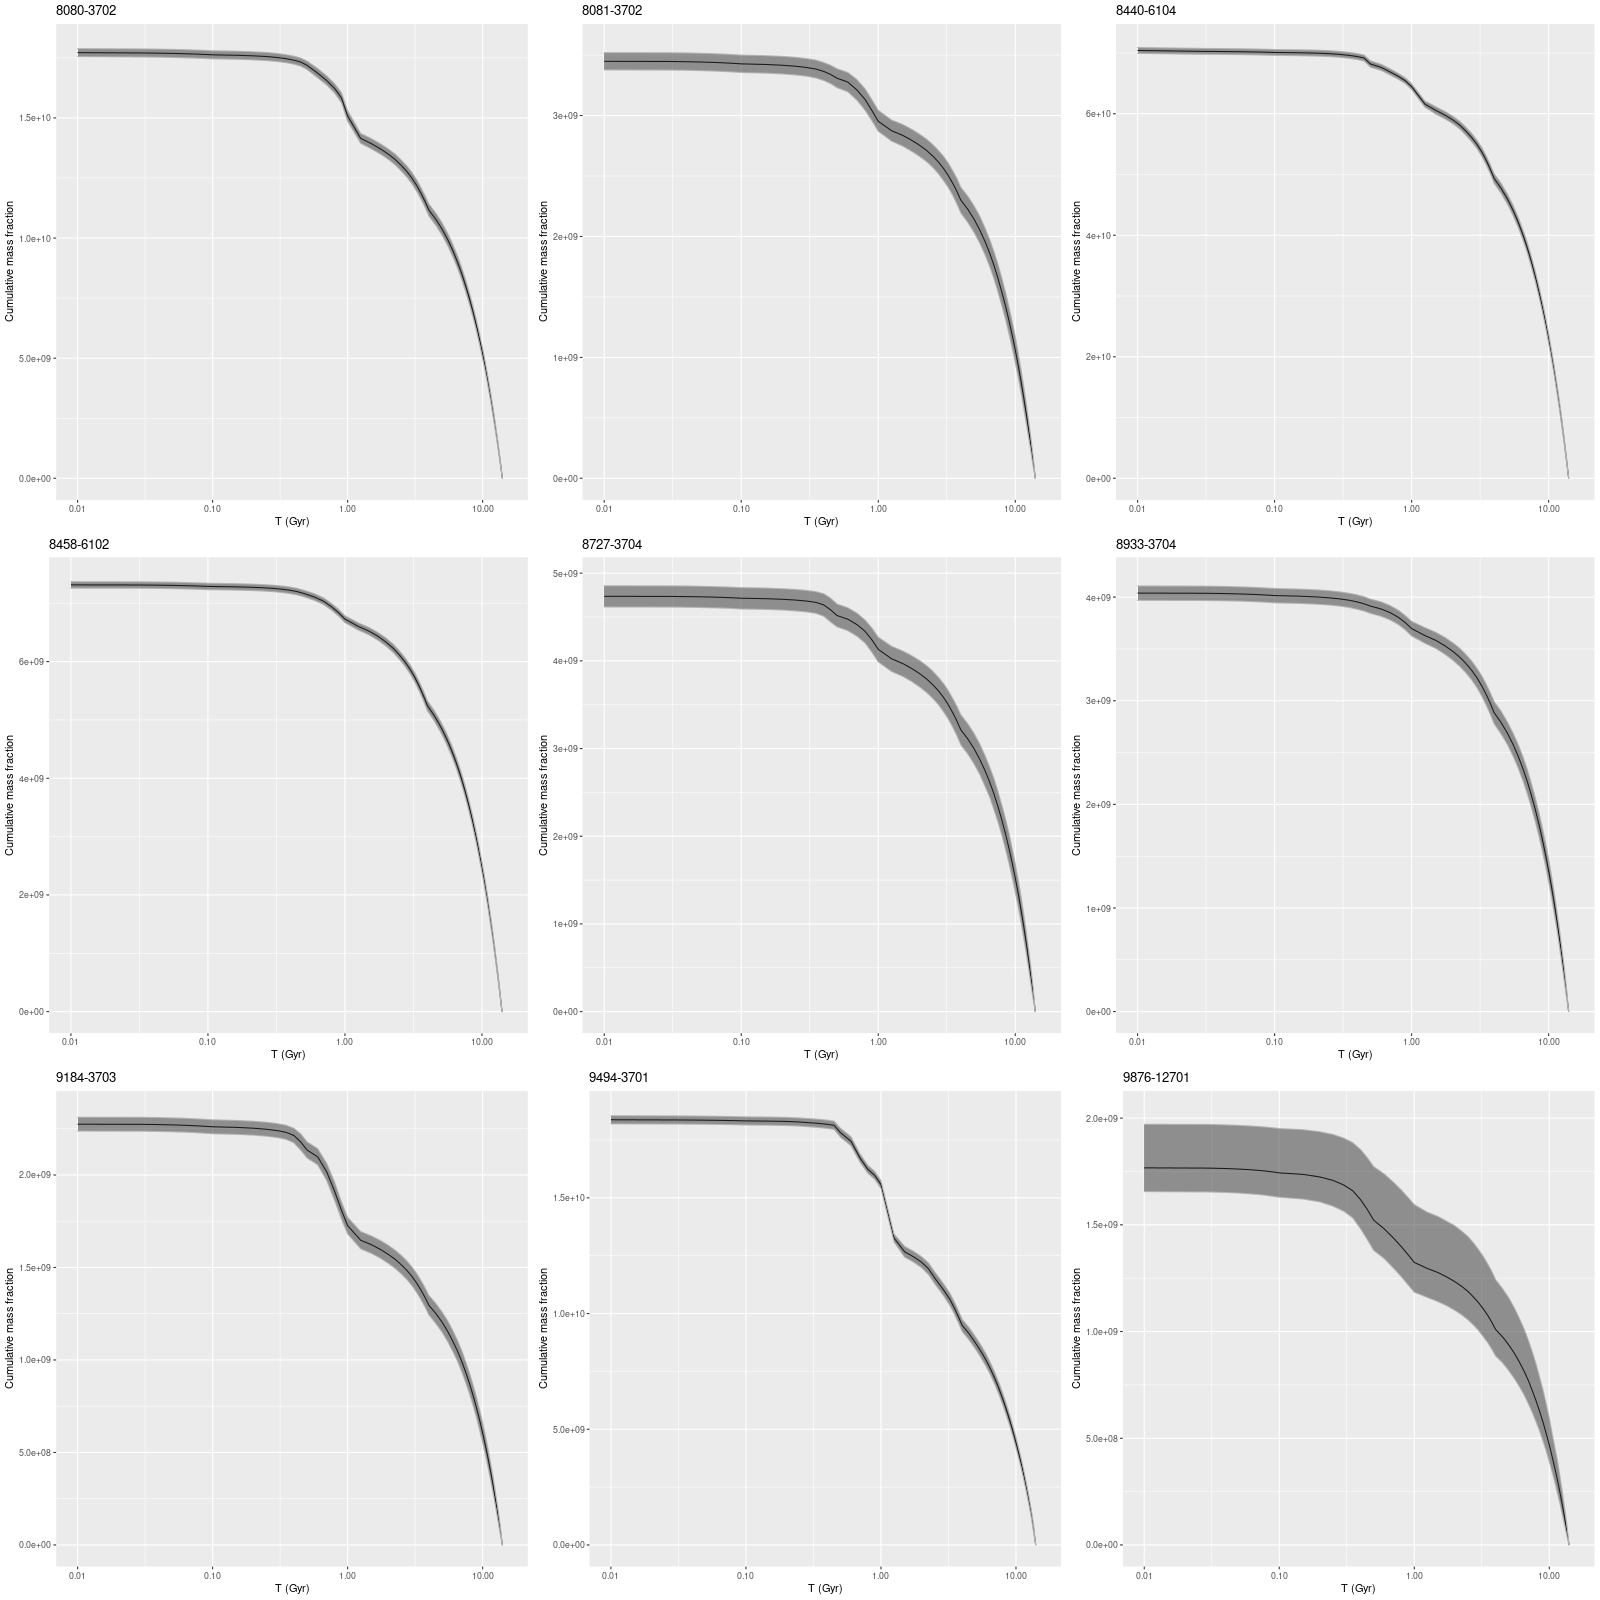
In more detail here are summed mass growth histories for the sample, that is all modeled star formation histories for a given observation are summed to produce a single global estimate. I’ve shown total masses here. Because of the pointing strategy MaNGA uses the fiber positions overlap to produce a 100% filling factor, so simply summing overestimates masses by about 0.2dex according to a calculation I performed some time ago. The present day masses in the plot below actually agree pretty well with the values listed in Table 1 of the paper, with an average difference of ~0.1 dex (this is probably because at least some of the light falls outside the IFU footprint in most of these galaxies, offsetting some of the overcounted mass).

total_mgh
Integrated mass growth histories for 9 MaNGA “post-starburst” galaxies from Wu (2021) – arxiv 2103.16070

Somewhat surprisingly several of these galaxies show little evidence of an actual burst of star formation in the recent past, at least at the global level. Some of these could simply have had star formation truncated recently, which can produce a poststarburst spectral signature for a time. Overall intermediate age stars contribute ~ 6-20% of the present day stellar mass, with the two largest contributions in the low mass galaxies in the bottom row of the plot.

There are some other oddities in this small sample. At least 3 galaxies are dwarf ellipticals or perhaps dwarf irregulars (in the case of plateifu 9876-12701), and two others have stellar masses under ~5 x 10⁹ M⊙. Two of the low mass galaxies are in or near the Coma cluster, which suggests environmental effects as the probable cause of quenching. Another possible issue with the low mass galaxies is the infamous “age-metallicity degeneracy,” which refers to the fact that old, low metallicity populations “look like” younger, more metal rich ones by many measures. The Balmer lines in particular fade more slowly with age in lower metallicity populations, and the 4000Ã… break also becomes metallicity sensitive (smaller at low metallicities) at older ages.

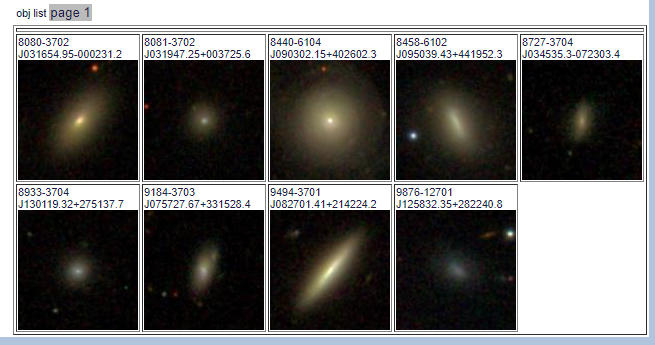
There is only one clear merger remnant in the sample (with plateifu 8440-6104, which I will get to in a moment). One other galaxy (plateifu 8458-6102) is located in a compact group that appears (in Legacy survey imaging) to be embedded in a cloud of extragalactic light. Finally, two galaxies in this sample have been cataloged as K+A based on SDSS spectra — 8080-3702 and 9494-3701, while two others in the catalog of Melnick and dePropris (2013) are not.

SDSS thumbnails of the sample

The one clear merger remnant in the sample is an old friend of mine, and in fact I wrote three lengthy posts about this one back in 2018. In perusing those posts I noticed that the current set of model runs have a slightly weaker and more recent burst than the earlier runs. Also a double peak in the earlier runs has gone away in these, which means my early speculation that it might be possible to time crucial events in a merger from the detailed SFH model was too optimistic. On the other hand the model burst strength in the earlier runs was uncomfortably large, indicating an exceptionally gas rich merger and efficient processing of gas into stars. The current runs have a more reasonable ~10% of mass in the burst. So, I will look into those earlier runs and try to figure out what changed. Fortunately I’m a data hoarder and R is self-archiving to some extent.

kug0839+406
KUG 0839+406, one of 9 “post-starburst” galaxies in Wu (2021)

The idea of looking at the integrated properties of IFU data to pick a post-starburst sample seems reasonable, but this sample appears to me to be both incomplete and possibly with some false positives. When DR17 is finally released I plan to try to develop my own criteria. As I’ve already shown using SDSS spectra alone to select a sample is doomed to produce lots of false positives.

I should finally mention one other paper pursuing a similar idea by Greene et al. (2021) showed up on arxiv recently. The authors lost me when they used the phrase “carefully curated” in their introduction, which was otherwise pretty well written up to that point. Maybe I’ll take another look anyway.

Update on Bayesian line of sight velocity modeling

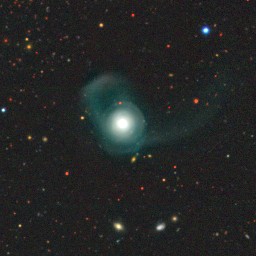
Well that was simple enough. I made a simple indexing error in the R data preprocessing code that resulted in a one pixel offset between the template and galaxy spectra, which effectively resulted in shifting the elements of the convolution kernel by one bin. I had wanted to look at a rotating galaxy to perform some diagnostic tests, but once I figured out my error this turned out to be a pretty good validation exercise. So I decided to make a new post. The galaxy I’m looking at is NGC 4949, another member of the sample of passively evolving Coma cluster galaxies of Smith et al. It appears to me to be an S0 and is a rapid rotator:

NGC 4949 – SDSS image
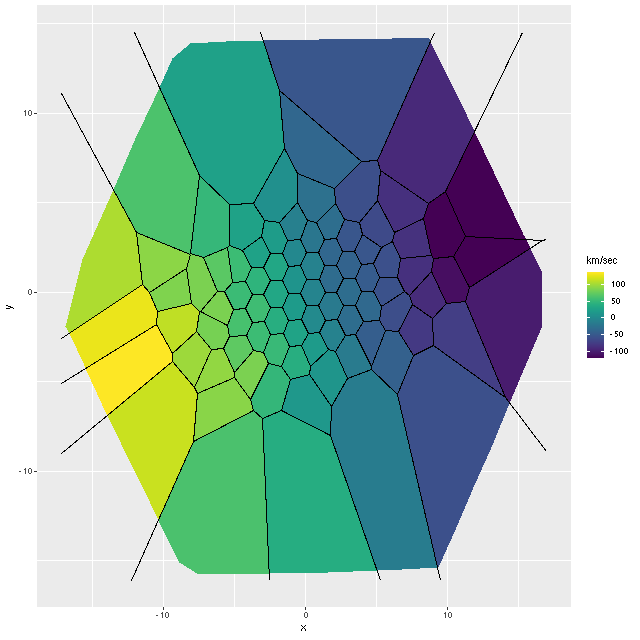
NGC 4949 – radial velocity map

These projected velocities are computed as part of my normal workflow. I may in a future post explain in more detail how they’re derived, but basically they are calculated by finding the best redshift offset from the system redshift (taken from the NSA catalog which is usually the SDSS spectroscopic redshift) to match the features of a linear combination of empirically derived eigenspectra to the given galaxy spectrum.

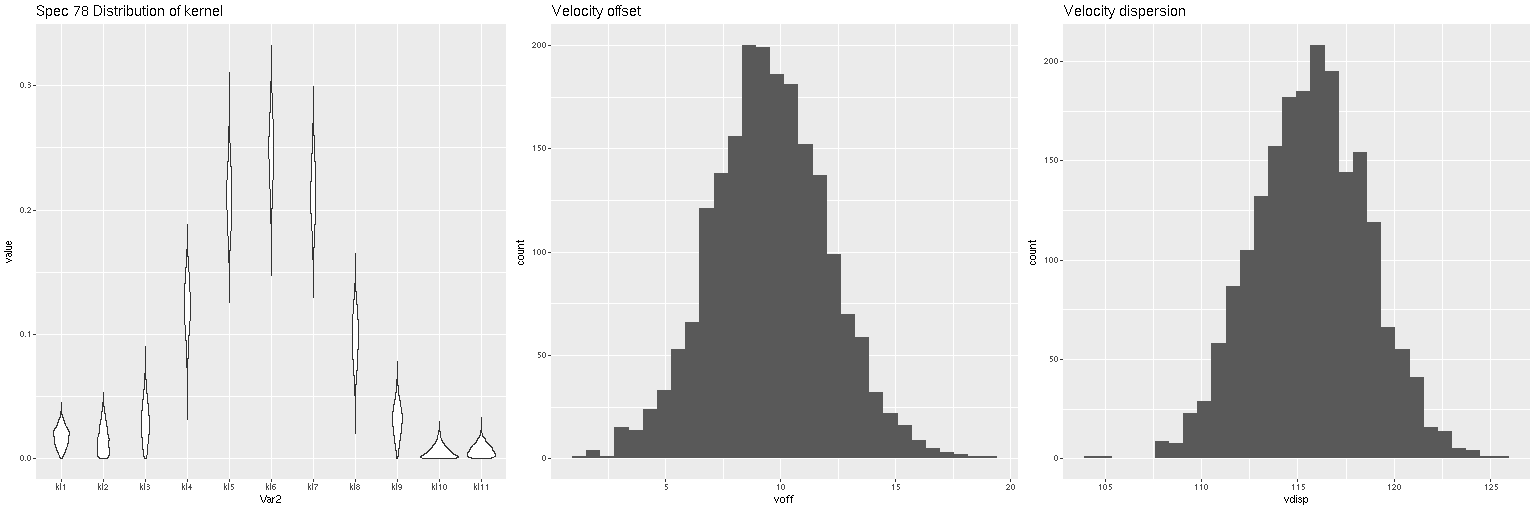
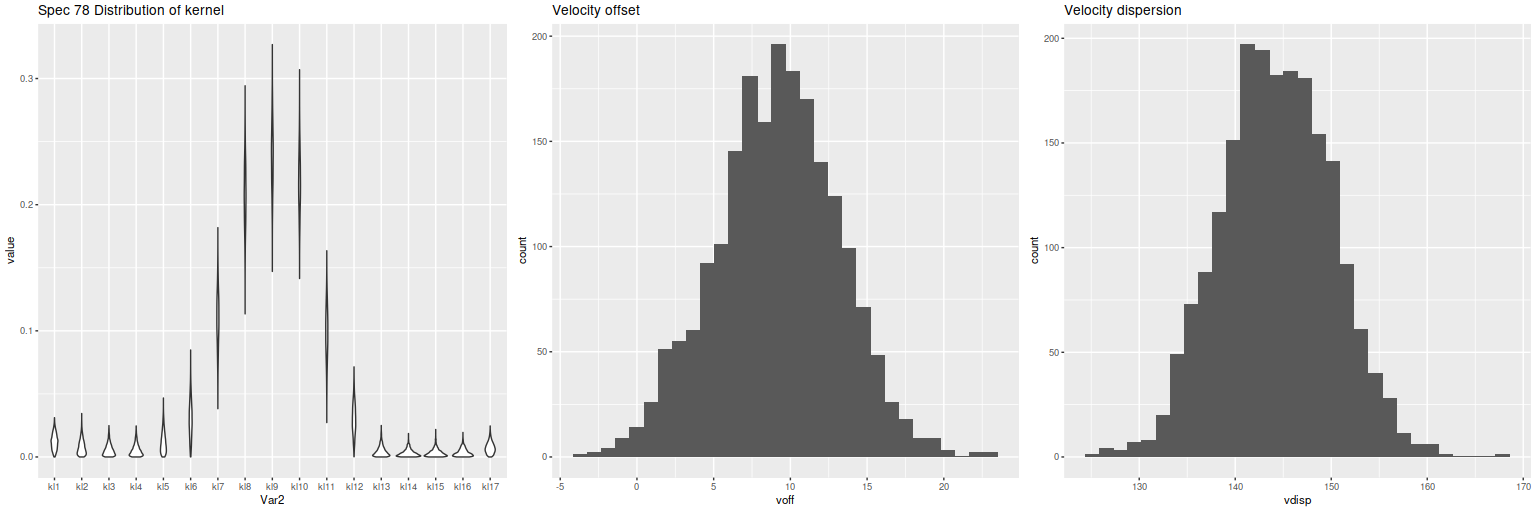
First exercise: find the line of sight velocity distribution after adjusting to the rest frame in each spectrum. This was the originally intended use of these models. This galaxy has fairly low velocity dispersion of ~100 km/sec. so I used a convolution kernel size of just 11 elements with 6 eigenspectra in each fit. Here is a summary of the LOSVD distribution for the central spectrum. This is much better. The kernel estimates are symmetrical and peak on average at the central element. The mean velocity offset is ≈ 9.5 km/sec, which is much closer to 0 than in the previous runs. I will look briefly at velocity dispersions at the end of the post: this one is actually quite close to the one I estimate with a single component gaussian fit (116 km/sec vs 110).

Estimated LOSVD of central spectrum of NGC 4949

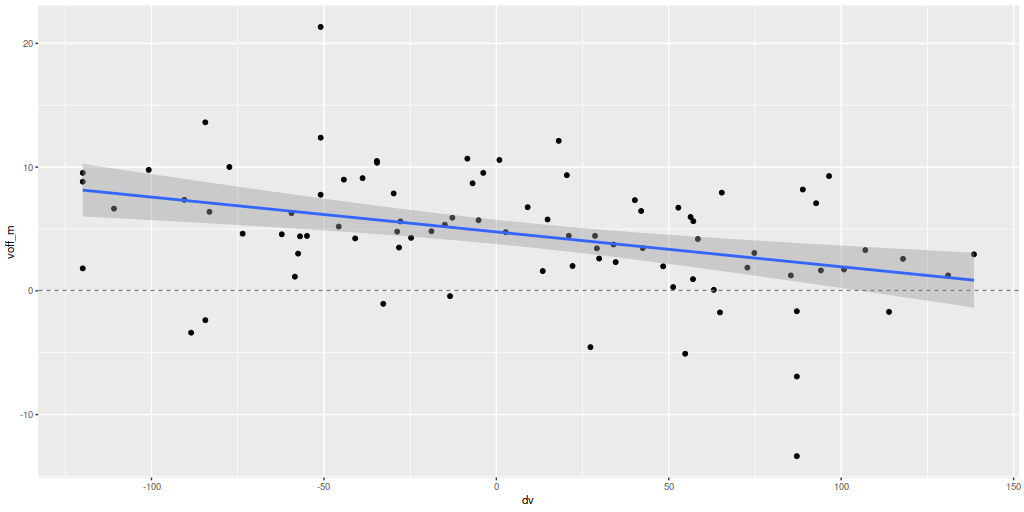
Next, here are the posterior mean velocity offsets for all 86 spectra in the Voronoi binned data, plotted against the peculiar velocity calculated as outlined above. The overall average of the mean velocity offsets is 4.6 km/sec. The reason for the apparent tilt in the relationship still needs investigation.

Mean velocity offset vs. peculiar velocity. All NGC 4949 spectra.

Exercise 2: calculate the LOSVD with wavelengths adjusted to the overall system redshift as taken from the NSA catalog, that is no adjustment is made for peculiar redshifts due to rotation. For this exercise I increased the kernel size to 17 elements. This is actually a little more than needed since the projected rotation velocities range over ≈ ± 100 km/sec. First, here is the radial velocity map:

Radial velocity map from Bayesian LOSVD model with no peculiar redshifts assigned.

Here’s a scatterplot of the velocity offsets against peculiar velocities from my normal workflow. Again there’s a slight tilt away from a slope of 1 evident. The residual standard error around the simple regression line is 6.4 km/sec and the intercept is 4 km/sec, which are consistent with the results from the first set of LOSVD models.

Velocity offsets from Bayesian LOSVD models vs. peculiar velocities

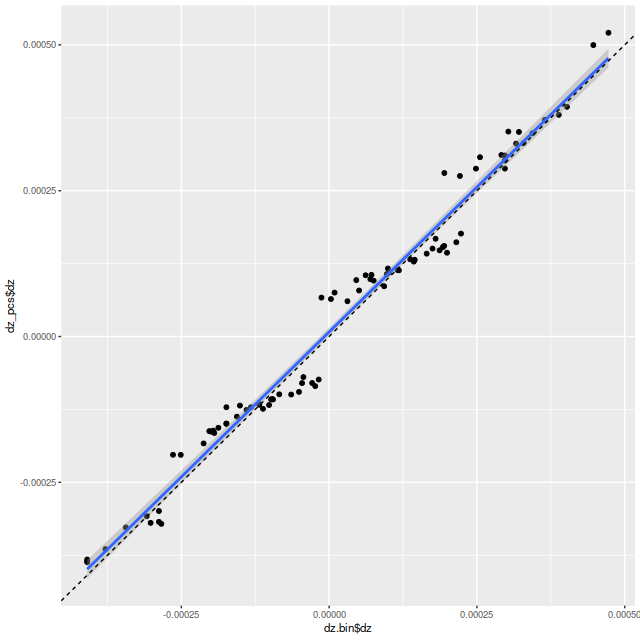
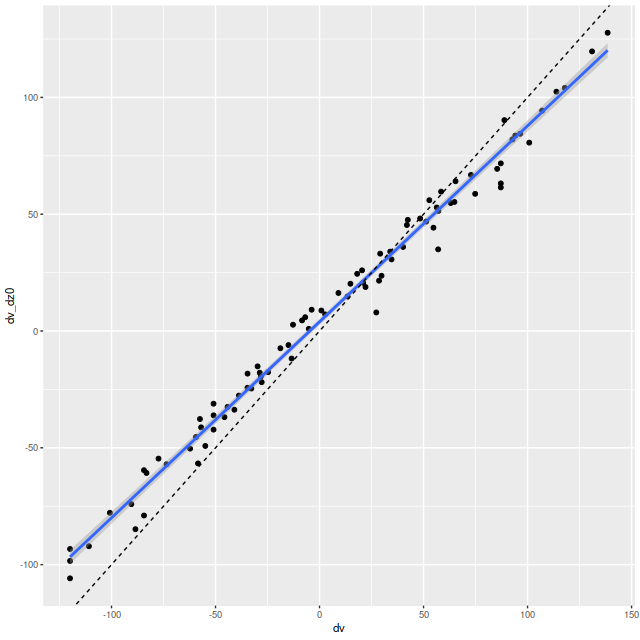
Exercise 3: calculate redshift offsets using a set of (for this exercise, 6) eigenspectra from the SSP templates. Here is a scatterplot of the results plotted against the redshift offsets from my usual empirically derived eigenspectra. Why the odd little jumps? I’m not completely sure, but my current code does an initial grid search to try to isolate the global maximum likelihood, which is then found with a general purpose nonlinear minimizer. The default grid size is 10-4, about the size of the gaps. Perhaps it’s time to revisit my search strategy.

Redshift offsets from a set of SSP derived eigenspectra vs. the same routine using my usual set of empirically derived eigenspectra.

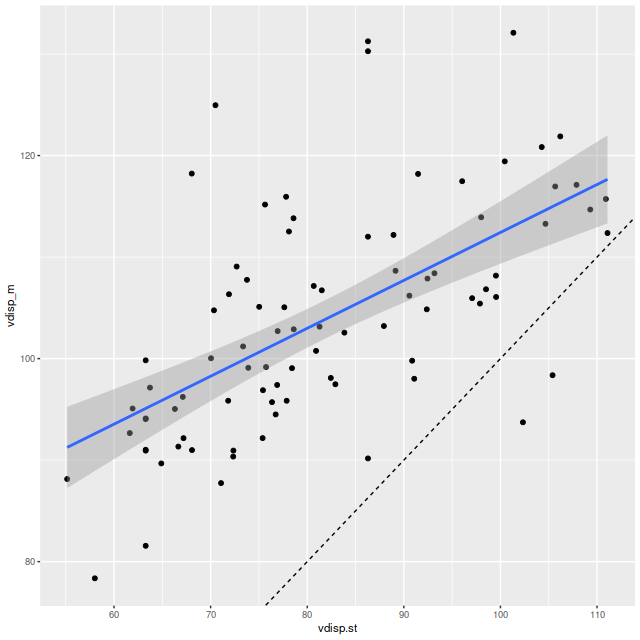
Final topic for now: I mentioned in the last post that posterior velocity dispersions (measured by the standard deviation of the LOSVD) were only weakly correlated with the stellar velocity dispersions that I calculate as part of my standard workflow. With the correction to my code the correlation while still weak has greatly improved, but the dispersions are generally higher:

Velocity dispersion form Bayesian LOSVD models vs. stellar velocity dispersion from maximum likelihood fits.

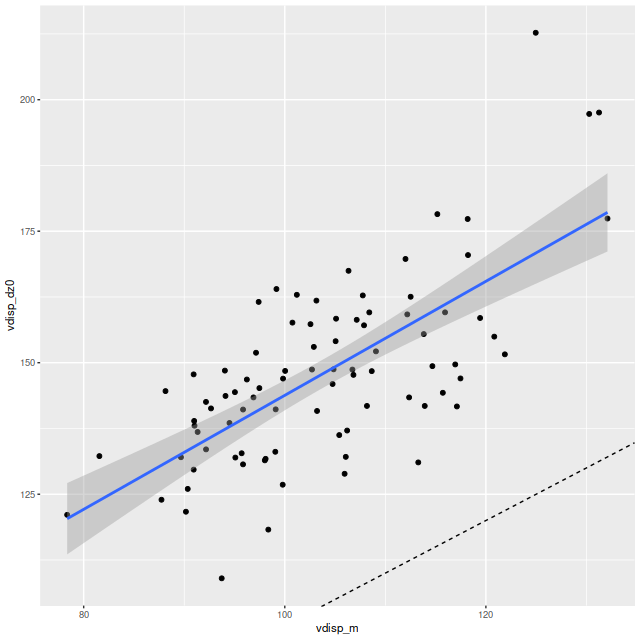
A similar trend is seen when I plot the velocity dispersions from the LOSVD models with correction only for the system redshift and a wider convolution kernel (exercise 2 above) with the fully corrected model runs (exercise 1):

These results hint that the diffuse prior on the convolution kernel is responsible for the different results. As part of the maximum likelihood fitting process I estimate the standard deviation of the stellar velocity distribution assuming it to be a single component gaussian. While the distribution of kernel values in the first graph look pretty symmetrical the tails are on average heavier than a gaussian. This can be seen too in the LOSVD models with the larger convolution kernel of exercise 2. The tails have non-negligible values all the way out to the ends:

Now, what I’m really interested in are model star formation histories. I’ve been using pre-convolved SSP model templates from the beginning along with phony emission line spectra with gaussian profiles with some apparent success. My plan right now is to continue that program with these non-parametric LOSVD’s. The convolutions could be carried out with posterior means of the kernel values or by drawing samples. Repeated runs could be used to estimate how much variation is affected by uncertainty in the kernel.

How to handle emission lines is another problem. For now stepping back to a simpler model (no emission, no dust) would be reasonable for this Coma sample.

Using Galaxy Zoo classifications to select MaNGA samples

A while back I came across a paper by Fraser-McKelvie et al. (2020, arxiv id 2009.07859) that used Galaxy Zoo classifications to select a sample of barred spiral galaxies with MaNGA observations. This was a followup to a paper by Peterken et al. (2020, arxiv id 2005.03012) that also used Galaxy Zoo classifications to select a parent sample of spiral galaxies (barred and otherwise). There’s nothing new about using GZ classifications for sample selection of course, although these papers are somewhat notable for going farther down the decision tree than usual. What was new to me though when I decided to get my own samples is the SDSS CasJobs database now has a table named mangaGalaxyZoo containing GZ classifications for (I guess) all MaNGA galaxies. The classifications come from the Galaxy Zoo 2 database supplemented with some followup campaigns to fill in the gaps in GZ2. Besides greater completeness than the zoo2* database tables that can also be queried in CasJobs this table contains the newer vote fraction debiasing procedure described in Hart et al. (2016). It’s also much faster to query because it’s indexed on mangaid. When I put together the sample of MaNGA disk galaxies that I’ve posted about several times I took a somewhat indirect approach of looking for SDSS spectroscopic objects close to IFU centers and joining those with classifications in the zoo2MainSpecz table. The query I wrote took about 3 1/2 hours to execute, whereas the ones shown below required no more than a second.

Pasted below are the complete SQL queries, and below the fold are lists of the positions and plateifu IDs of the samples suitable for copying and pasting into the SDSS image list tool. These queries run in the DR16 “context” produced 287 and 272 hits respectively, with 285 unique galaxies in the barred sample and 263 uniques in the non-barred. These numbers are a little different than in the two papers referenced at the top. Fraser-McKelvie ended up with 245 galaxies in their barred sample — most of the difference appears to be due to me selecting from both the primary and secondary MaNGA samples, while they only used the “Primary+” sample (which presumably include the primary and “color enhanced” subsamples). I also did not make any exclusions based on the drp3qual value although I did record it. The total sample size of 548 galaxies is considerably smaller than the parent sample from Peterken, which was either 795 or 798 depending on which paper you consult. The main reason for that is probably that Peterken’s parent sample includes all bar classifications while I excluded galaxies with debiased f_bar levels > 0.2 in my bar-less sample. My barred fraction of around 52% is closer to guesstimates in the literature.

Both samples contain at least a few false positives, as is usual, but there are only one or two gross misclassifications. One that was especially obvious in the barred sample was this early type galaxy, which clearly has neither a bar or spiral structure and at least qualitatively has a brightness profile more characteristic of an elliptical. Oddly, the zoo2MainSpecZ entry for this object has a completely different set of classifications — the debiased vote fraction for “smooth” was 84%, so most volunteers agreed with me. This suggests maybe a misidentification in the mangaGalaxyZoo data.

CGCG 238-030. Not a barred spiral.

Besides this really obvious case I found a few with apparent inner rings or lenses, and a few galaxies in both samples appear to me to be lenticulars with no clear spiral structure. The first of the two below again has a completely different set of classifications in zoo2MainSpecZ than in the MaNGA table.

Again, not a barred spiral.
Lenticular?

Although I didn’t venture to count them a fair number of galaxies in the non-barred sample do appear to have short and varyingly obvious bars. Of course the query didn’t exclude objects with some bar votes — presumably higher purity could be achieved by lowering the threshold for exclusion. And again, there are a few lenticulars in the spiral sample. As my sadly departed friend Jean Tate often commented the galaxy zoo decision tree doesn’t lend itself very well to identifying lenticulars.

IC 2227. Maybe a short bar?
UGC 10381. Classified as S0/a in RC3

Unfortunately I have nothing useful to say about Fraser-Mckelvie’s main research topic, which was to decide if, and perhaps why, barred spirals have lower star formation rates than otherwise similar non-barred ones. 500+ galaxies are far more than I can analyze with my computing resources. Perhaps a really high purity sample would be manageable. I may post an individual example or two anyway. The MaNGA view of grand design spirals in particular can be quite striking.

select into gzbars
  m.mangaid,
  m.plateifu,
  m.plate,
  m.objra,
  m.objdec,
  m.ifura,
  m.ifudec,
  m.mngtarg1,
  m.drp3qual,
  m.nsa_z,
  m.nsa_zdist,
  m.nsa_elpetro_mass,
  m.nsa_elpetro_phi,
  m.nsa_elpetro_ba,
  m.nsa_elpetro_th50_r,
  m.nsa_sersic_n,
  gz.survey,
  gz.t01_smooth_or_features_count as count_features,
  gz.t01_smooth_or_features_a02_features_or_disk_debiased as f_disk,
  gz.t03_bar_count as count_bar,
  gz.t03_bar_a06_bar_debiased as f_bar,
  gz.t04_spiral_count as count_spiral,
  gz.t04_spiral_a08_spiral_debiased as f_spiral,
  gz.t06_odd_count as count_odd,
  gz.t06_odd_a15_no_debiased as f_notodd
from mangaDrpAll m
join mangaGalaxyZoo gz on gz.mangaid = m.mangaid
where
  m.mngtarg2=0 and
  gz.t04_spiral_count >= 20 and
  gz.t03_bar_count >= 20 and
  gz.t01_smooth_or_features_a02_features_or_disk_debiased > 0.43 and
  gz.t03_bar_a06_bar_debiased >= 0.5 and
  gz.t04_spiral_a08_spiral_debiased > 0.8 and
  gz.t06_odd_a15_no_debiased > 0.5 and
  m.nsa_elpetro_ba >= 0.5 and
  m.mngtarg1 >= 1024 and
  m.mngtarg1 < 8192
order by m.plateifu

select into gzspirals
  m.mangaid,
  m.plateifu,
  m.plate,
  m.objra,
  m.objdec,
  m.ifura,
  m.ifudec,
  m.mngtarg1,
  m.drp3qual,
  m.nsa_z,
  m.nsa_zdist,
  m.nsa_elpetro_mass,
  m.nsa_elpetro_phi,
  m.nsa_elpetro_ba,
  m.nsa_elpetro_th50_r,
  m.nsa_sersic_n,
  gz.survey,
  gz.t01_smooth_or_features_count as count_features,
  gz.t01_smooth_or_features_a02_features_or_disk_debiased as f_disk,
  gz.t03_bar_count as count_bar,
  gz.t03_bar_a06_bar_debiased as f_bar,
  gz.t04_spiral_count as count_spiral,
  gz.t04_spiral_a08_spiral_debiased as f_spiral,
  gz.t06_odd_count as count_odd,
  gz.t06_odd_a15_no_debiased as f_notodd
from mangaDrpAll m
join mangaGalaxyZoo gz on gz.mangaid = m.mangaid
where
  m.mngtarg2=0 and
  gz.t04_spiral_count >= 20 and
  gz.t03_bar_count >= 20 and
  gz.t01_smooth_or_features_a02_features_or_disk_debiased > 0.43 and
  gz.t03_bar_a06_bar_debiased <= 0.2 and
  gz.t04_spiral_a08_spiral_debiased > 0.8 and
  gz.t06_odd_a15_no_debiased > 0.5 and
  m.nsa_elpetro_ba >= 0.5 and
  m.mngtarg1 >= 1024 and
  m.mngtarg1 < 8192
order by m.plateifu

Continue reading “Using Galaxy Zoo classifications to select MaNGA samples”