
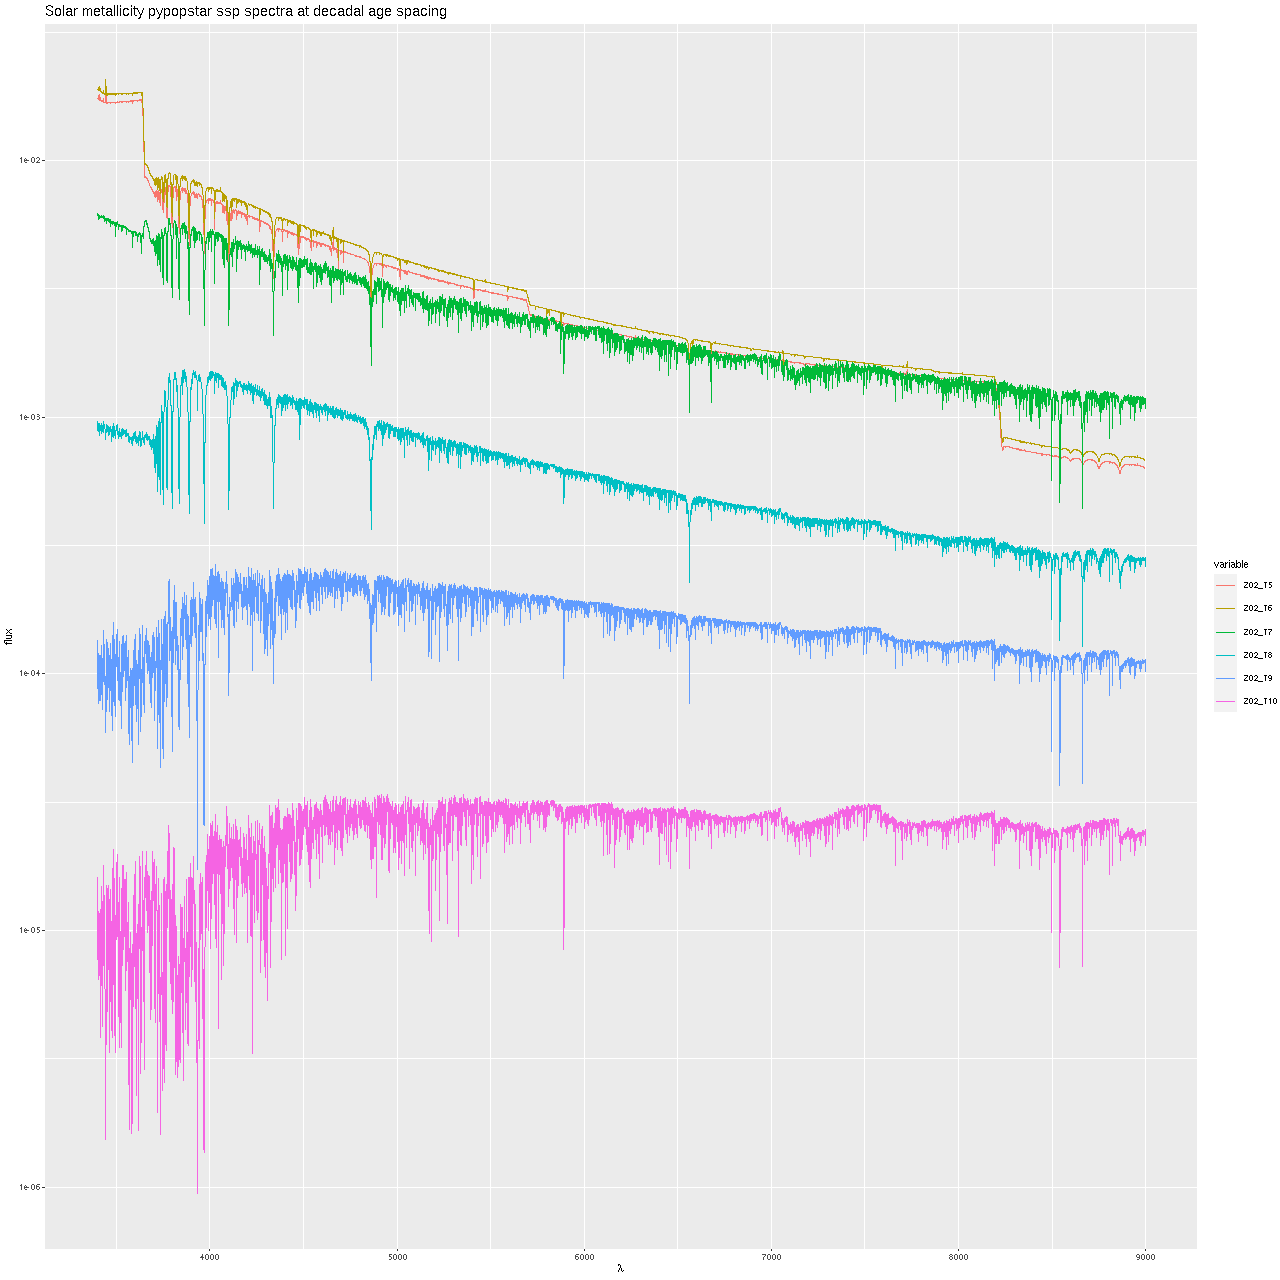
After a month off I returned to have another look at Millan-Irigoyen et al.’s high resolution “pypopstar” SSP model spectral libraries. First, I couldn’t find a more suitable subset of the full library than I used last time, so I decided just to try augmenting the existing Emiles based library with some younger spectra from pypopstar. Of course I had already done this with models from the 2013 update of BC03, so the plan was to replace those with a slightly finer grained selection at the young end. That raises the question of which ages to select. The youngest age model in the BaSTI isochrone based library is 30Myr (log T = 7.48), and we’re spoiled for choice of models at younger ages than that: there are 53 between log T = 5 and log T = 7.45, far more than necessary. Looking at the graph below, which just plots model spectra for the solar metallicity bin at decadal time invervals there’s very little spectral evolution between 105 and 106 years with the latter being slightly brighter at all relevant wavelengths. This is no surprise since even the most massive stars have main sequence lifetimes ∼106 years. The model spectra continue to get brighter up to around 106.6 years (4 Myr) and then turn around, becoming noticeably fainter and redder by 107 years.
I decided to take the log T = 6 models as youngest, discarding the sub Myr ones altogether. This is mostly due to the inability to distinguish them and also just for purposes of visualization. I usually use logarithmically scaled lookback time axes in SFH history plots, and selecting a minimum value of 5 results in too much real estate given to very recent times where usually nothing much is happening.
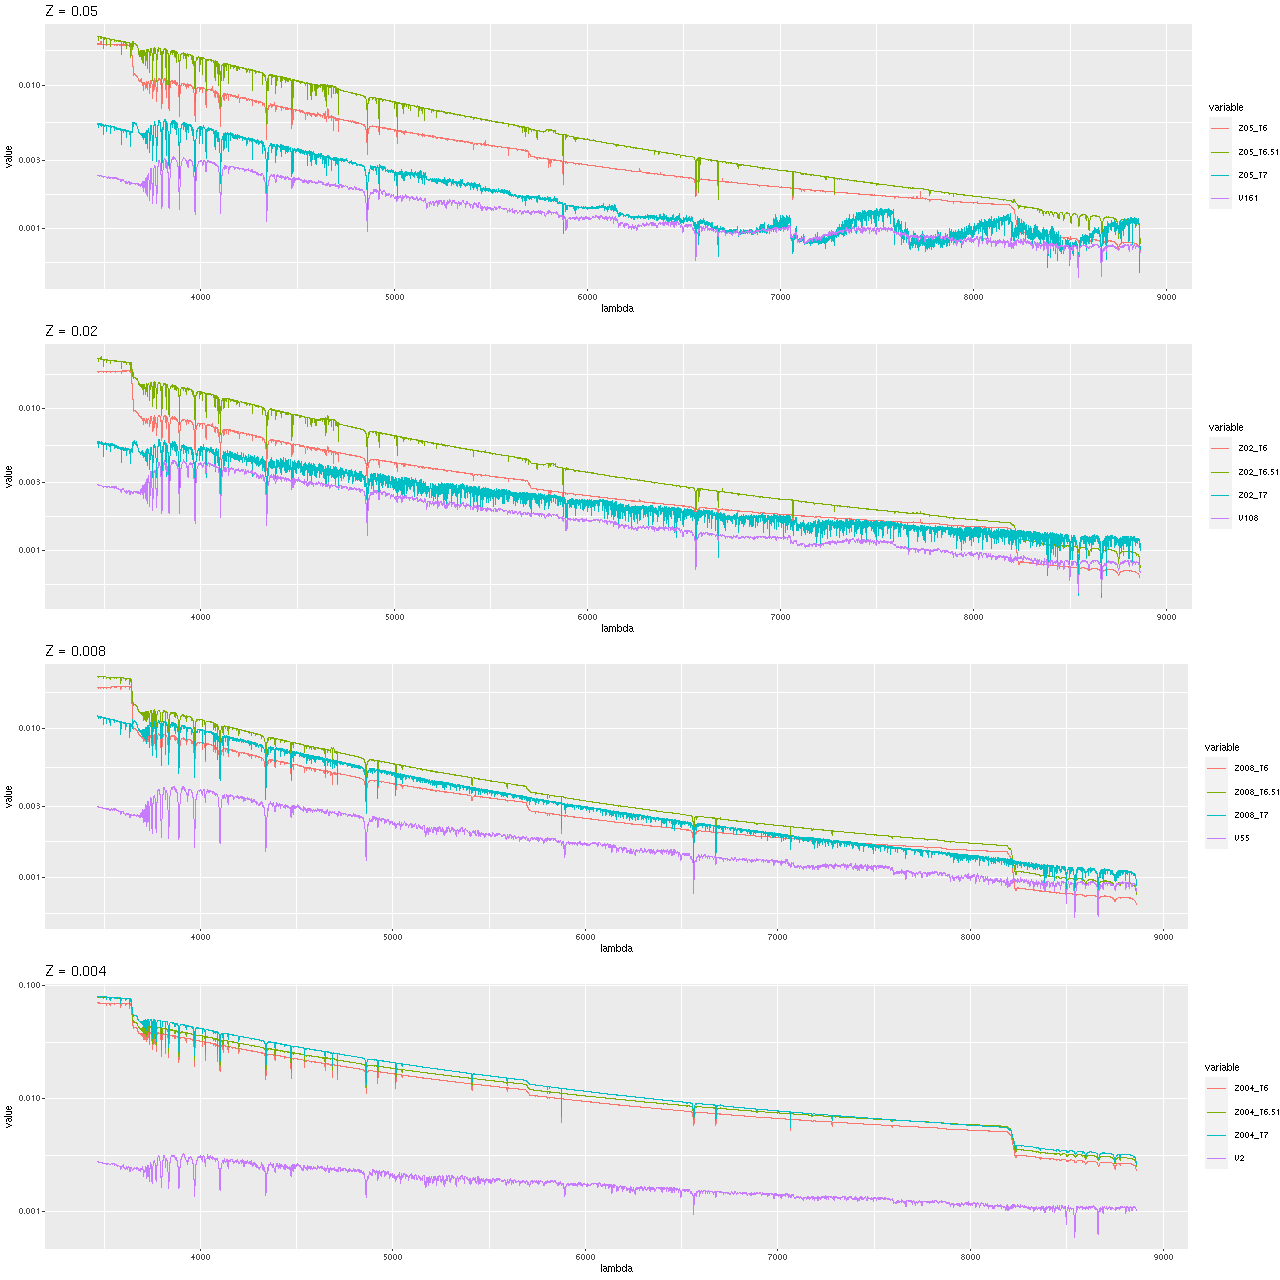
Without giving this a lot of thought I selected just 3 ages to add: log T = 6, 6.51, and 7. The youngest Emiles model is log T = 7.48, so this gives nearly constant increments around 0.5 dex. This choice gives a reasonably smooth transition from the theoretical spectra to empirical ones, except for maybe the lowest metallicity bin. I also chose the “total” spectra including both stellar and emission continuum light in hopes of better modeling the continuum in star forming galaxies. To merge the high resolution pypopstar models into the library I just used a spline fit to interpolate the model spectra onto the same wavelength grid as Miles. This should (I hope) preserve total flux nearly enough. A more refined treatment would also consider that these still have higher resolution than Miles spectra, which are around 2.5 Å. I didn’t take the time. The merged library therefore has 56 time bins times 4 metallicity bins for a total of 224 model spectra. I retained the same rest frame wavelength range (3464.9 – 8864 Å) as the Emiles subset I’ve been using for several years
The obvious next step is to use this library in some models and see how they compare to Emiles. Paging through my samples of spirals with MaNGA observations I picked, for no really good reason, this one:
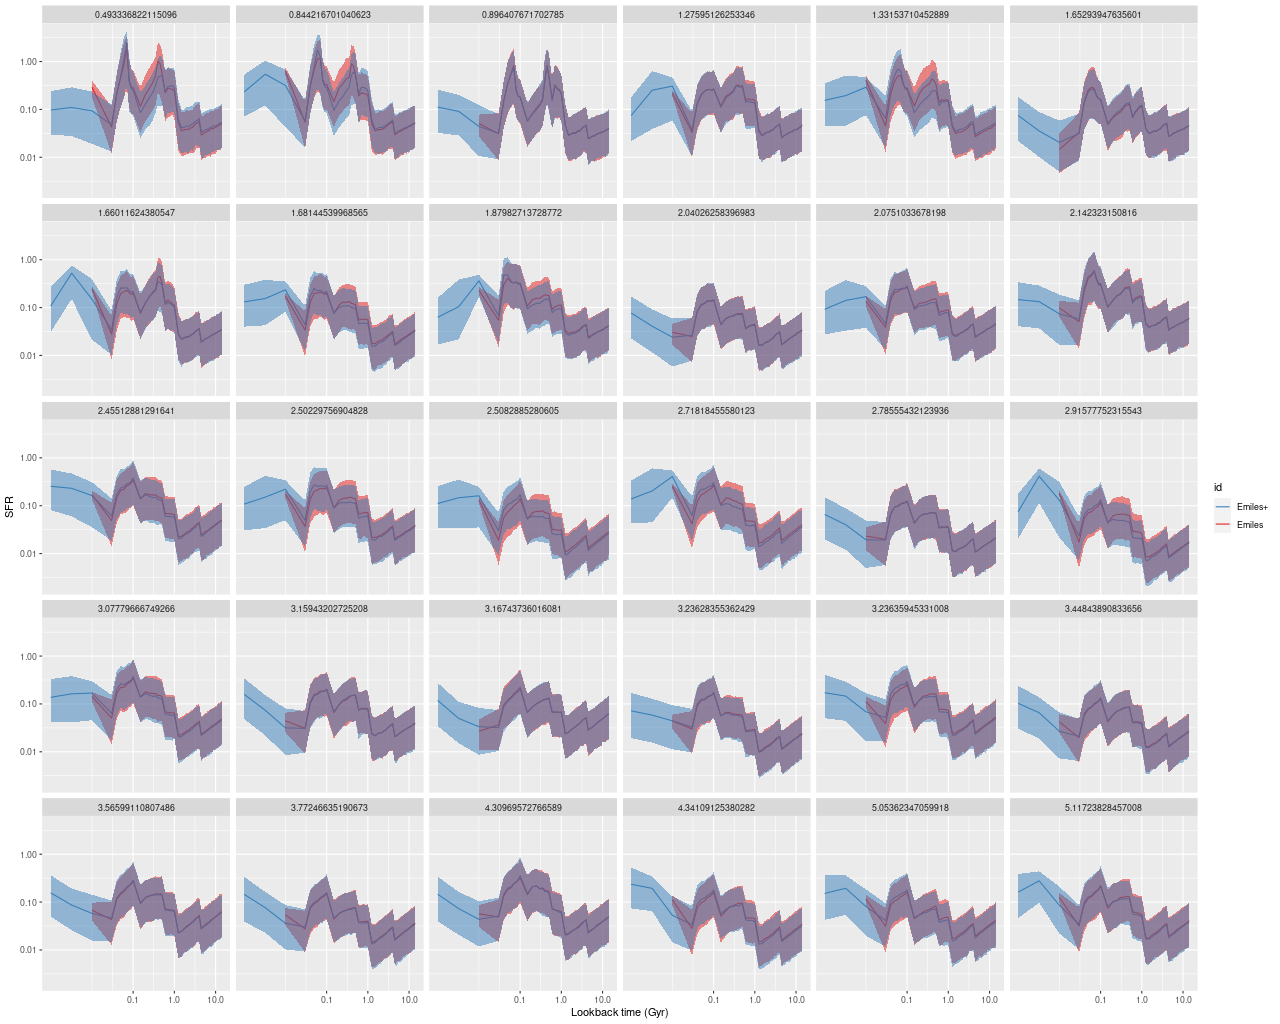
Clearly it has star forming regions in its arms as well as a prominent bar and rather red, possibly passively evolving nucleus. After binning to my usual threshold S/N of 5 there were 122 spectra, which were analyzed in the usual way using both Emiles and Emiles + popstar. And here’s the main result of interest, the model star formation histories for all 122 spectra, ordered by distance from the nucleus.
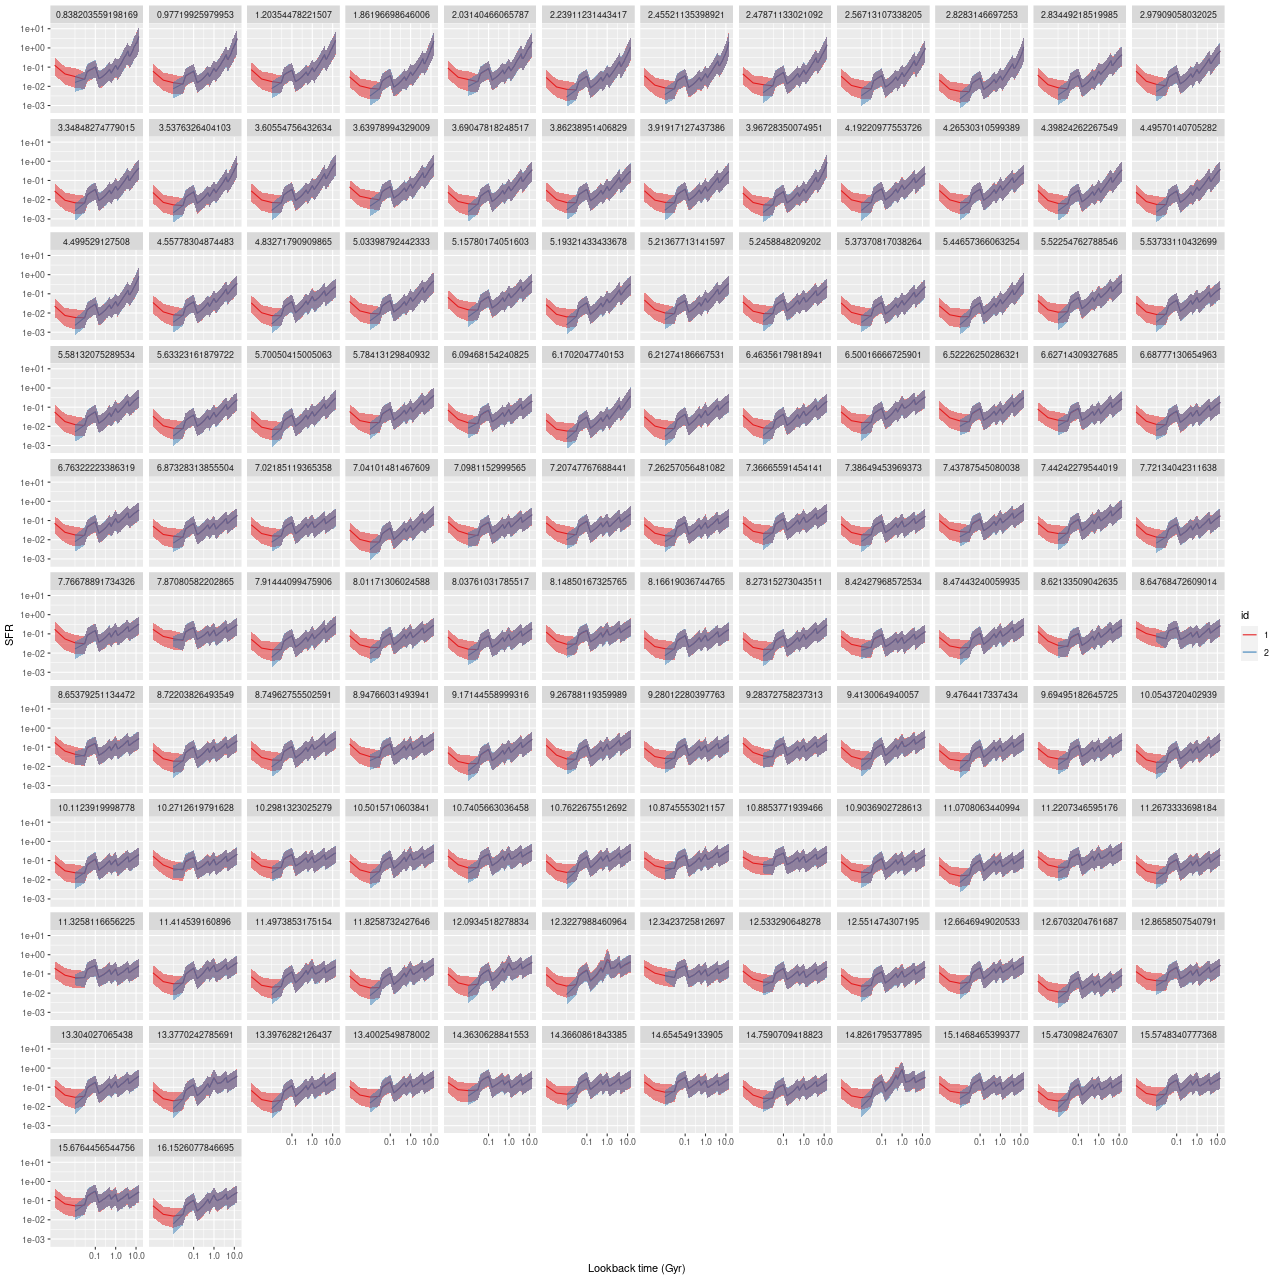
There’s little or no difference in the model star formation histories for the common components of the libraries. The pypopstar components indicate that the star formation rate continues at relatively constant rates up to recent times. The modest differences at the young end don’t necessarily mean anything. I more or less arbitrarily assigned an age of 10Myr to the BC03 model spectra, which were actually taken from 1Myr models. There’s no real way to tell what the actual effective age of those contributors is — if it’s typically younger than 10Myr the SFR in the youngest bin would be correspondingly higher and a little lower in the next age bin.
Given the similarities in the detailed star formation histories it shouldn’t be much of a surprise that summary quantities are quite similar too. To illustrate a few, here are mean values of the stellar mass surface density:

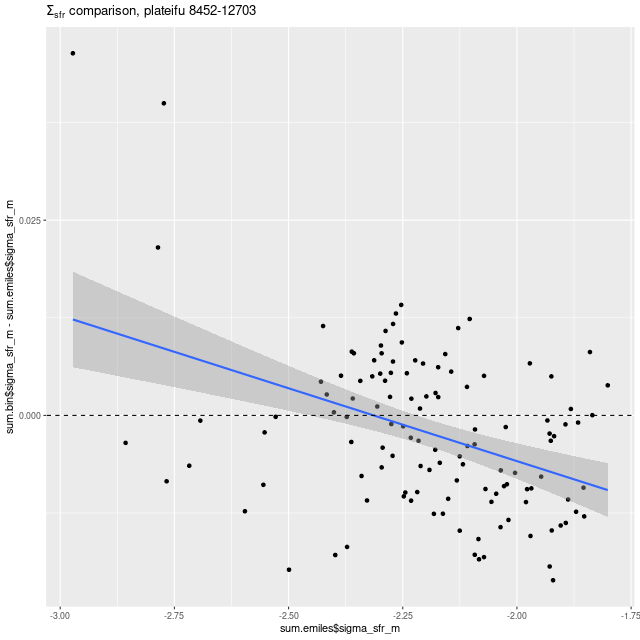
the star formation rate surface density (100 Myr average):
The specific SFR:
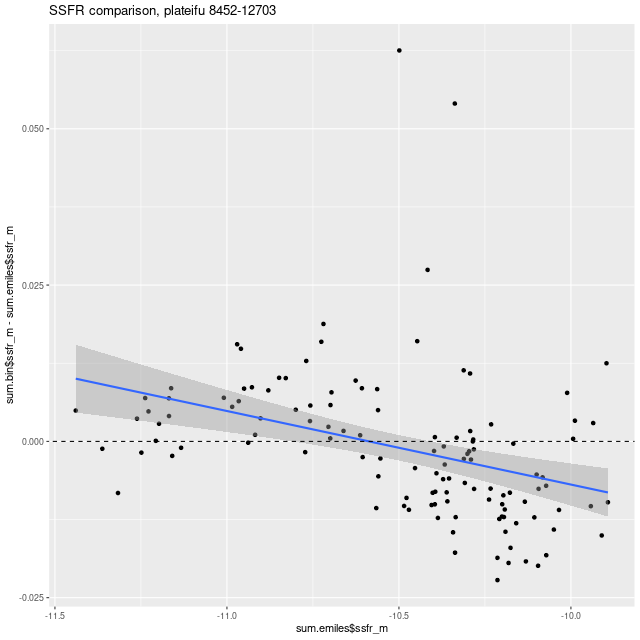
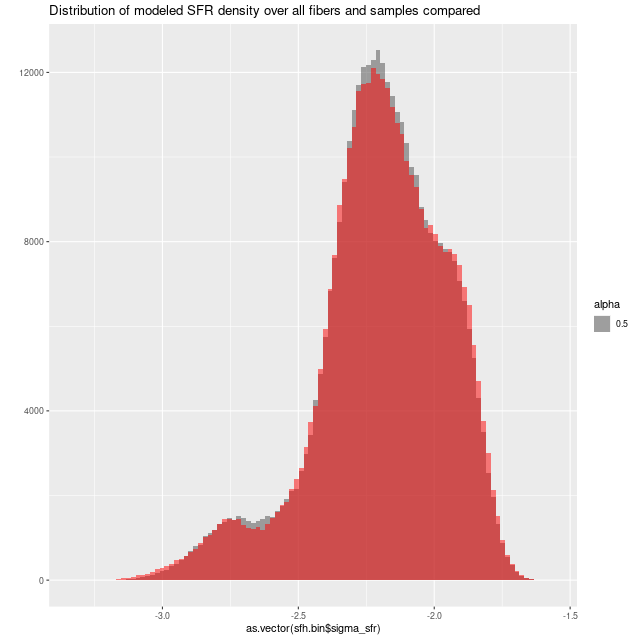
The lines with confidence intervals in these plots are from OLS fits taking no account of nominal uncertainties in either sets of variables, and shouldn’t be used to infer any trends. In any case all differences are very small. Finally, here are histograms of all sample values of SFR density for all spectra. Again, these are nearly identical:
After running multiple sets of models it became apparent that this wasn’t a very stringent test of the usefulness of the proposed library additions because this galaxy has very anemic star formation. In fact it’s one of Masters et al.‘s “passive” red spirals, which I should have recognized. It was also one of the first several dozen galaxies with AGN found in MaNGA, which doesn’t necessarily (but might, along with perhaps the prominent bar) account for the weak star formation. My model runs show “LINER” like emission line ratios in the center, which does point to the presence of a weak AGN.
Briefly now, I picked two more disk galaxies with obvious regions of vigorous star formation and repeated this exercise. To make this short I’m just going to post the star formation histories for all binned spectra.
MaNGA plateifu 8449-3703 (RA 169.299, DEC 23.586)

MaNGA plateifu 8318-9101 (RA 196.086 DEC 45.057)

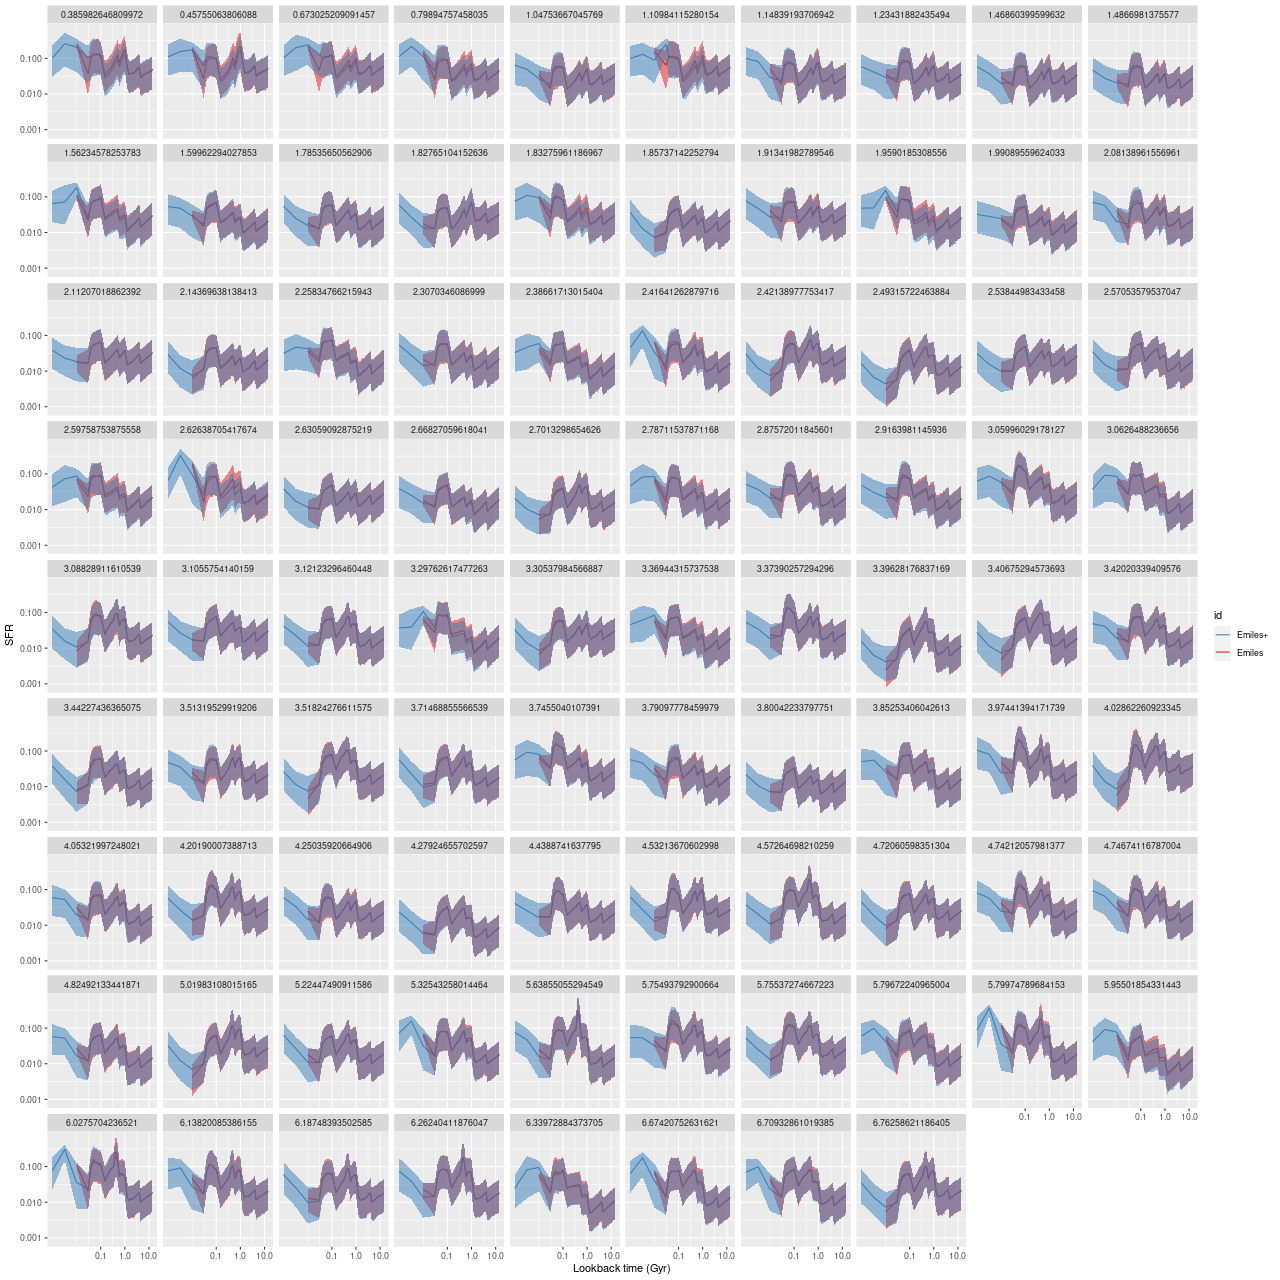
Spectra in nearby age and metallicity bins are highly corrrelated, which among other things means that adding or subtracting some from the set of “predictors” potentially changes the values inferred for others as well. In these two sets of model runs we do see some differences in the common Emiles portion of the libraries, but they’re quite small and change no qualitative inferences. So my conclusion for now is that adding these theoretical spectra is a reasonable strategy, but one that doesn’t have much apparent impact on model results.
Well that’s probably all for a while. The final MaNGA data release is now promised for December 2021, which should approximately double the number of galaxies and I hope offer some data reduction improvements. There will also be a very large release of stellar spectra that should form the basis for new SSP libraries in the (hopefully) near future.