
For a few years now I’ve been using a library of SSP1Simple Stellar Population model spectra based on the EMILES models of Vazdekis et al. supplemented with some young stellar populations taken from the “HR-pypopstar” models described in Irigoyen et al. (2021) and retrieved from fractal-es.com/PopStar. As I’ve mentioned several times there are a few issues with the models. First, the abrupt changes in time intervals of the BaSTI isochrone based models produce sharp jumps in model star formation rate estimates at several lookback times. This is because my star formation history models “want” to produce smoothly varying contribution estimates, which lead to abrupt jumps in rates when the time interval decreases.
Another possible issue is there are multiple sources of data used for the SSP model spectra. Besides the pypostar models for young populations the older population spectra use MILES stellar spectra for wavelengths up to 7410Å, with spectra from another source grafted on for longer wavelengths within the relevant range for SDSS. This wavelength happens to fall on a wide absorption feature (I believe mostly due to TiO) that’s prominent in older populations, and this region is often fit rather poorly by the models. Although there are other possible reasons for this I’ve long suspected that it might be due to different flux calibrations of the two data sources. Ideally I’d like to have single, homogeneous data source covering the full wavelength range of SDSS spectra.
That ideal data source may exist in the SDSS MaStar stellar spectrum library, which is a large collection of stellar spectra observed as part of the MaNGA project. Since the observations used the same BOSS spectroscopes they have the same wavelength coverage, spectral resolution, and flux calibration as the MaNGA galaxy spectra. So far I’ve found 2 MaStar based SSP model libraries. First is one described originally in Maraston et al. (2020) with data available at https://www.icg.port.ac.uk/mastar/. This was based on the preliminary (DR15) data release and has a minimum age of 300Myr, which is unsuitable for my purposes. An updated version with sufficiently young models is described in Nanni et al. (2022, 2023, 2024). That version has not yet been published as of the date of this post.
A more immediately usable set of models were described in Sanchez et al. (2022) and retrieved from http://ifs.astroscu.unam.mx/pyPipe3D/templates/. These are based on the 2019 update of the venerable Bruzual and Charlot (2003; BC03) models, with MaStar spectra substituting for MILES+IndoUS in the relevant wavelength range. The spectra were taken from the initial (DR15) data release and an update is promised to be forthcoming.
The linked directory contains a large number of FITS files containing subsets of the full data set(s) — both the CB19 and MaStar based models are included. Since I wanted to select my own subset I downloaded the presumed full data sets in files named “MaStar_CB19.all_1_5.fits.gz” and “MaStar_CB19.all_1_5.fits.gz.” These contain model spectra and some other data for 210 irregularly spaced ages (not 220 as stated in the paper) and 16 metallicities. Very young ages are over-represented — there are 23 under 1 Myr and another 55 between 1 and 10 Myr. Beyond 3 Gyr the interval between models is fixed at 0.25 Gyr. For a preliminary evaluation I chose 47 ages from 1 Myr to 14 Gyr and 5 metallicities ranging from somewhat subsolar (Z = 0.004) to the highest available (Z = 0.06). I used the model spectra as given with wavelengths from 3625-9998.5Å at 1.5Å spacing. I built libraries for both the CB19 and MaStar based spectra, but will only discuss the latter for now.
I also decided to reevaluate the most recent release of the “BPASS” evolution models of Stanway and Eldridge (2018) with data retrieved from links at https://bpass.auckland.ac.nz/9.html. These are purely theoretical models including predictions for spectra, and are unique in attempting to account for binary star evolution. I had looked at a much earlier version and decided that the model continua were much too blue to be useful for full spectrum fitting. This appears to be no longer much of an issue.
Again, there are a large number of files in the data directory with different choices of IMF and upper mass limits. For a first look I chose the file bpass_v2.2.1_imf135_300.tar.gz, which corresponds to a Kroupa IMF with upper mass limit of 300 M☉ 2which may have been a mistake since the upper mass limit in all the other libraries I’ve tried is 100M☉. Models are available for 11 metallicities, and again I chose 5 with values ranging from Z=0.004 to Z=0.04 (the highest available). The available ages are in equal logarithmic intervals from 106 all the way up to 1011 years with a spacing of 0.1 dex. I just chose all available ages for log(T) = 6 to 10.1, for a total of 42. According to the documentation ages are meant to represent the middle of each time interval. So far I’ve adopted the convention that ages represent the beginning of each time interval of width equal to the time to the next younger age, so for consistency I add 0.05 dex to each model age. I extracted the model spectra in the wavelength range 3500-9499Å, which are tabulated at 1Å intervals.
For a preliminary evaluation I calculated models for just two MaNGA galaxies. Plateifu 10220-3703 (mangaid 1-201936; NED name WISEA J080218.38+323207.8) is a post-starburst taken from the compilation of Melnick and dePropris — one of 8 in the final MaNGA release. The other is a late type spiral, plateifu 11018-12704 (mangaid 1-233951; UGC 8162). This was a more or less random choice drawn from a sample that was intended to be a high purity selection of MaNGA face on spirals based on Galaxy Zoo classifications and NSA axis ratios. These two span the range of galaxy types that I’m likely to want to examine in the near future.


I’m just going to look at a few results of model runs. Execution times, convergence diagnostics, and fits to the data as measured by summed log-likelihoods were all similar so there’s no strong reason to favor one library based on those criteria.
Turning first to the post-starburst galaxy 2MASX J08021836+3232078, here are model star formation rate histories for all binned spectra and all three tested SSP libraries. The ribbons denoting the marginal 95% credible intervals of SFR mostly overlap3note these are log-log plots that span 4 orders of magnitude in star formation rate, which is encouraging, but the model mass growth histories are rather different as seen below4as something of an aside several panels show a strange zigzag pattern. This is a rendering issue with the graphics software rather than a sampling problem. Note in particular that the mass growth histories by construction are monotonic.
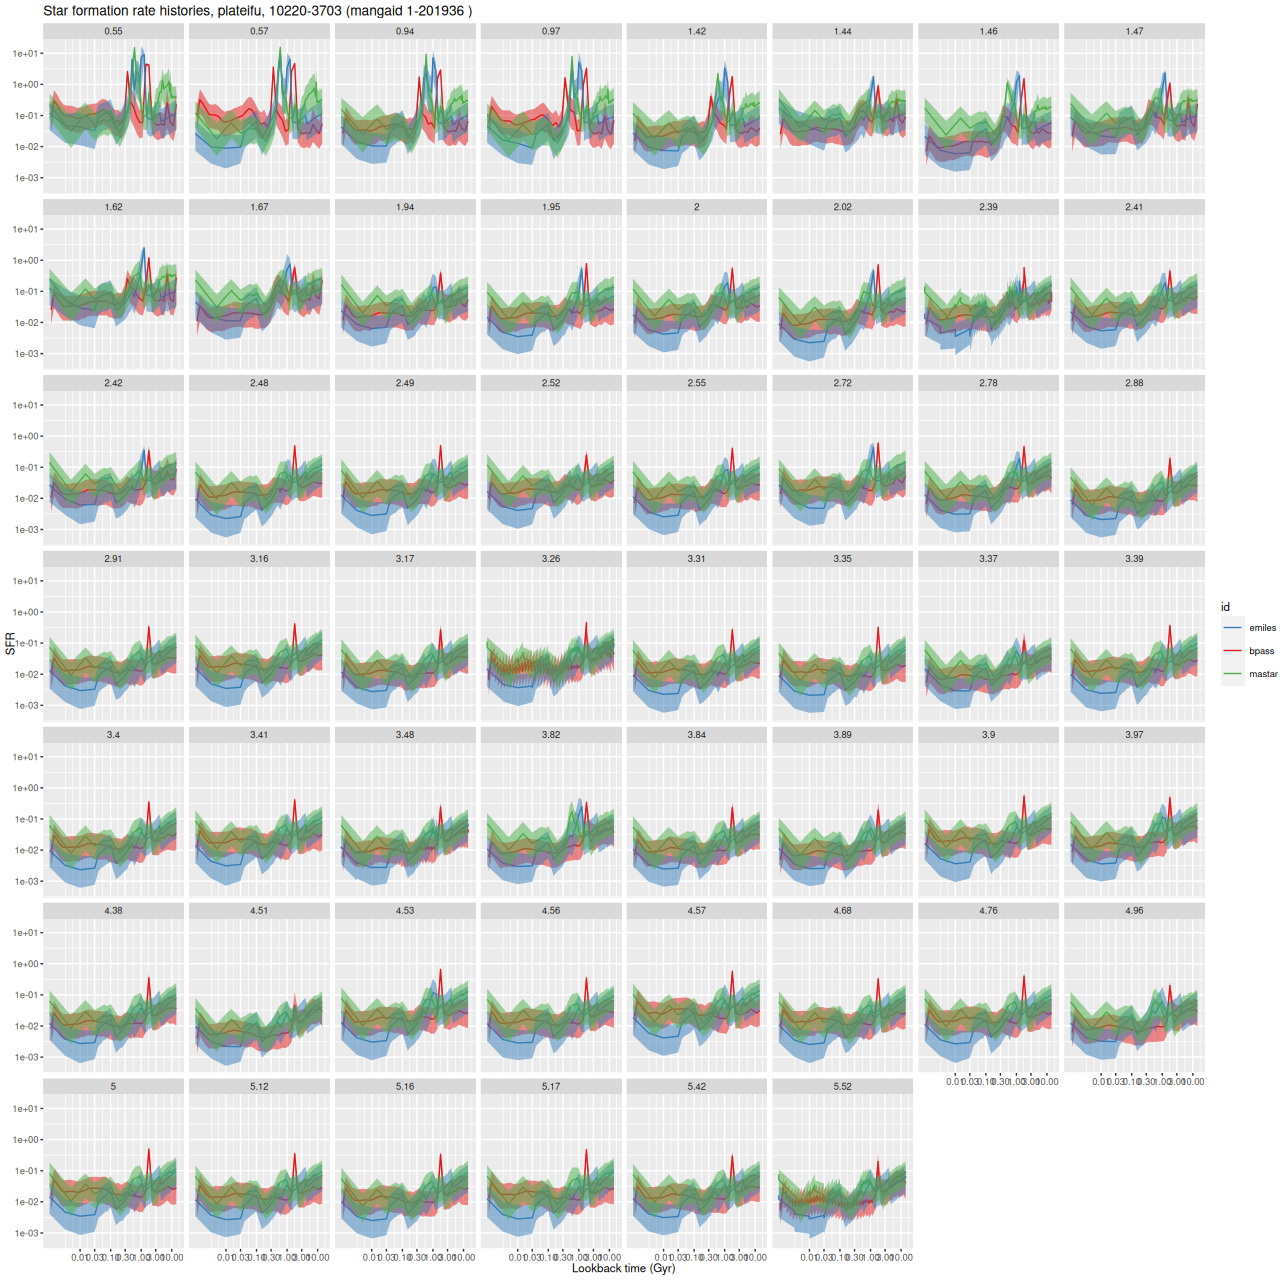
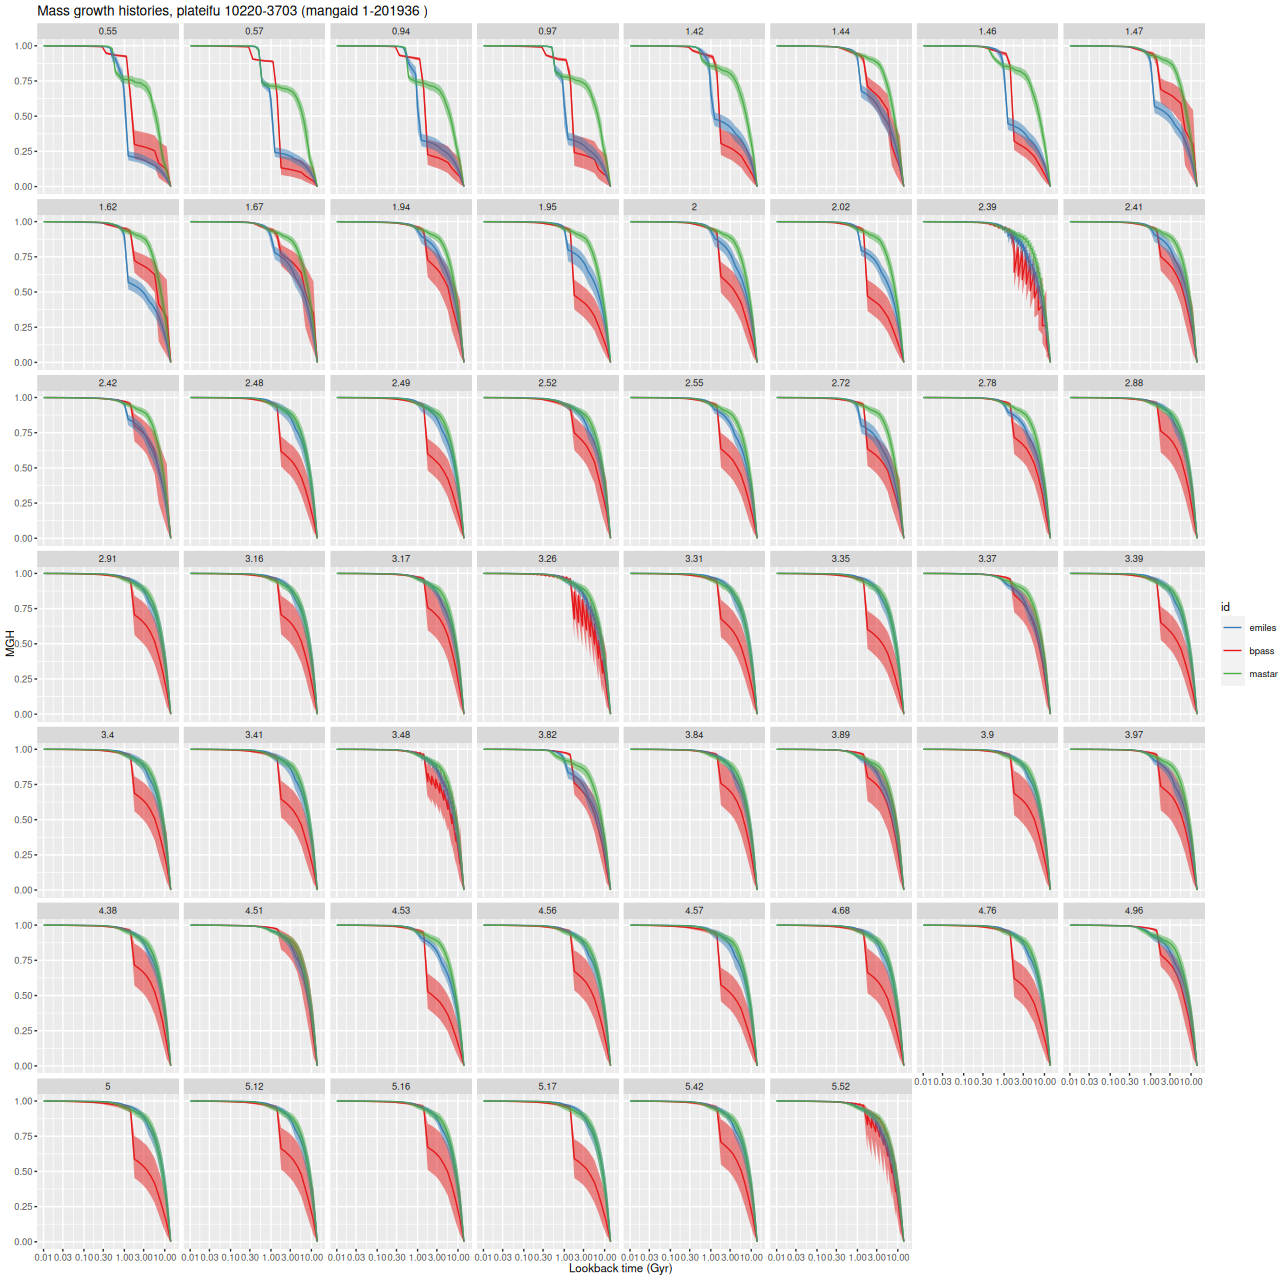
Both the EMILES and BPASS models have a strong, centrally concentrated quenched starburst with two peaks, but with slightly different timing. The MaStar based models on the other hand show a long period of quiet evolution with a later and weaker starburst in the central region. A very peculiar feature of the BPASS models is a spike in SFR in almost every model run at logT = 9.2 (1.6 Gyr). A little more on this below.
There are some fairly large differences in summary quantities I track. The average stellar mass density is 0.14 ± 0.05 dex larger in the MaStar based models than EMILES, while it’s 0.12 ± 0.05 dex
Turning to the spiral, here are the same two sets of plots for UGC 8162. Again the model SFR histories overlap and all three indicate roughly constant star formation over cosmic history with perhaps even slightly increasing in the outskirts. Close examination of the mass growth histories show the MaStar based models favor slightly faster early time growth than the other two.
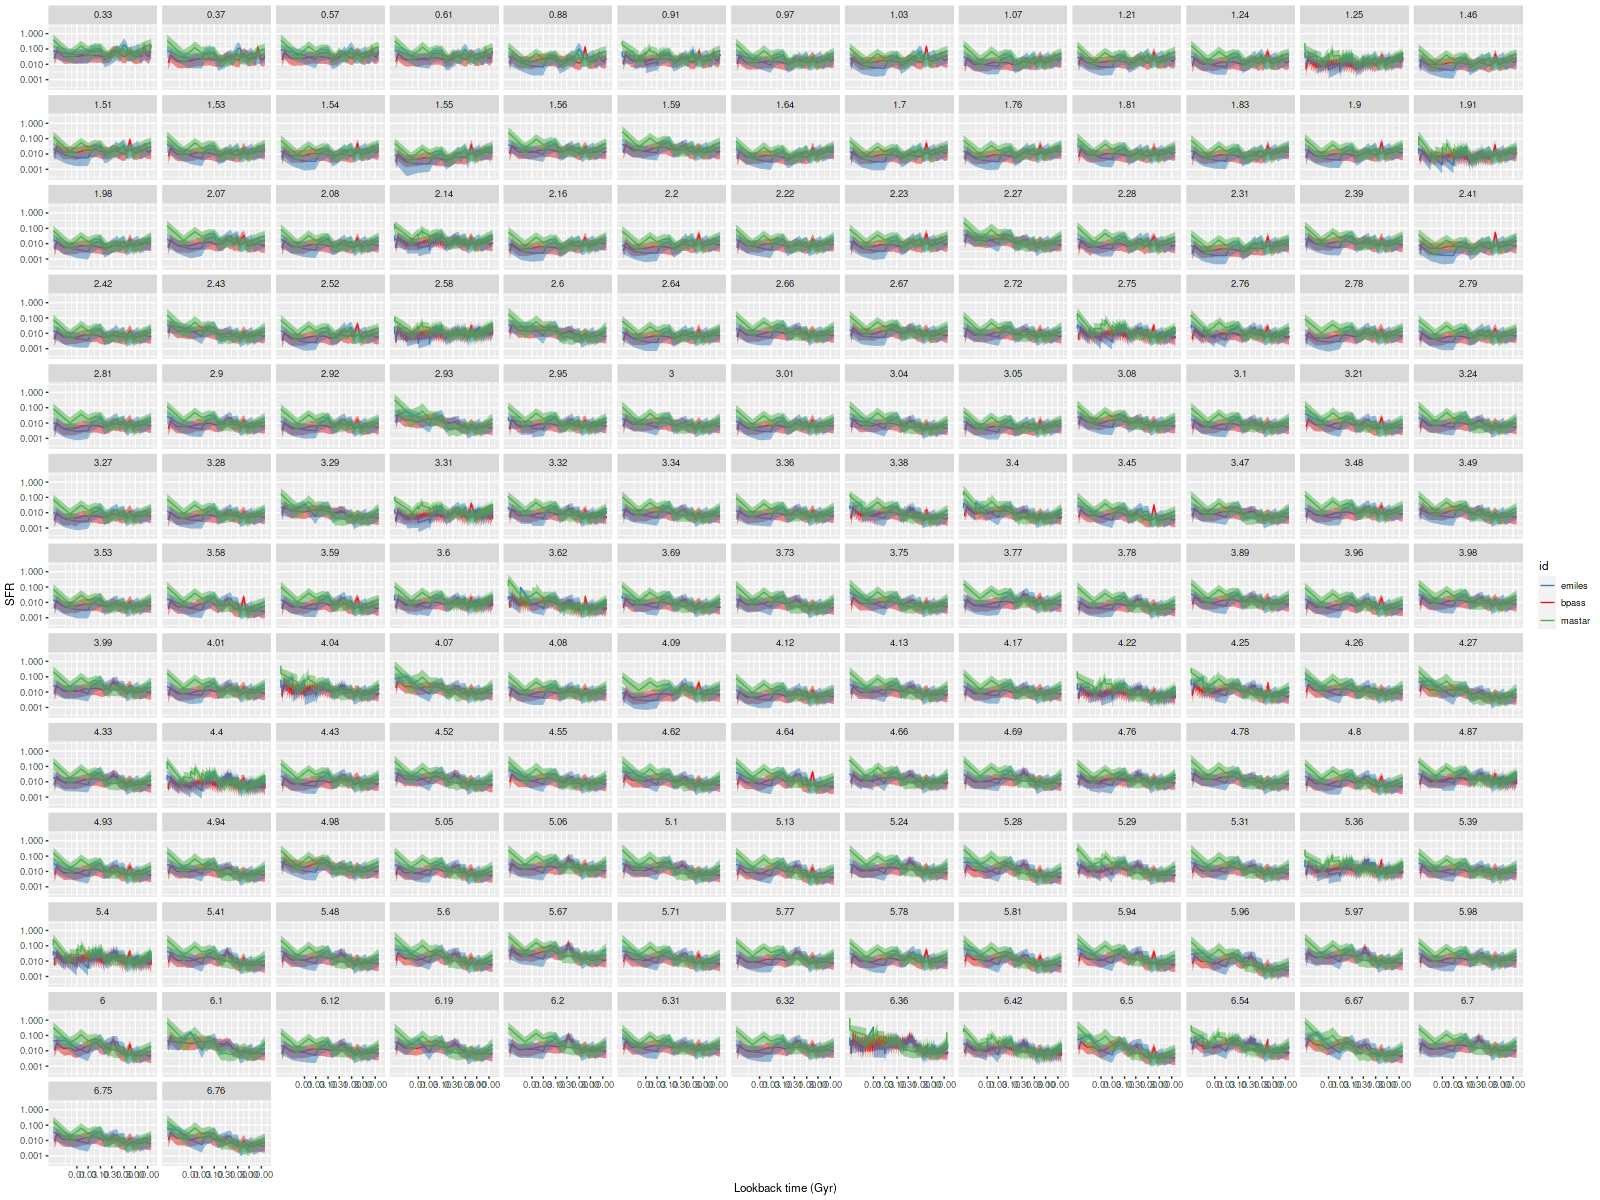
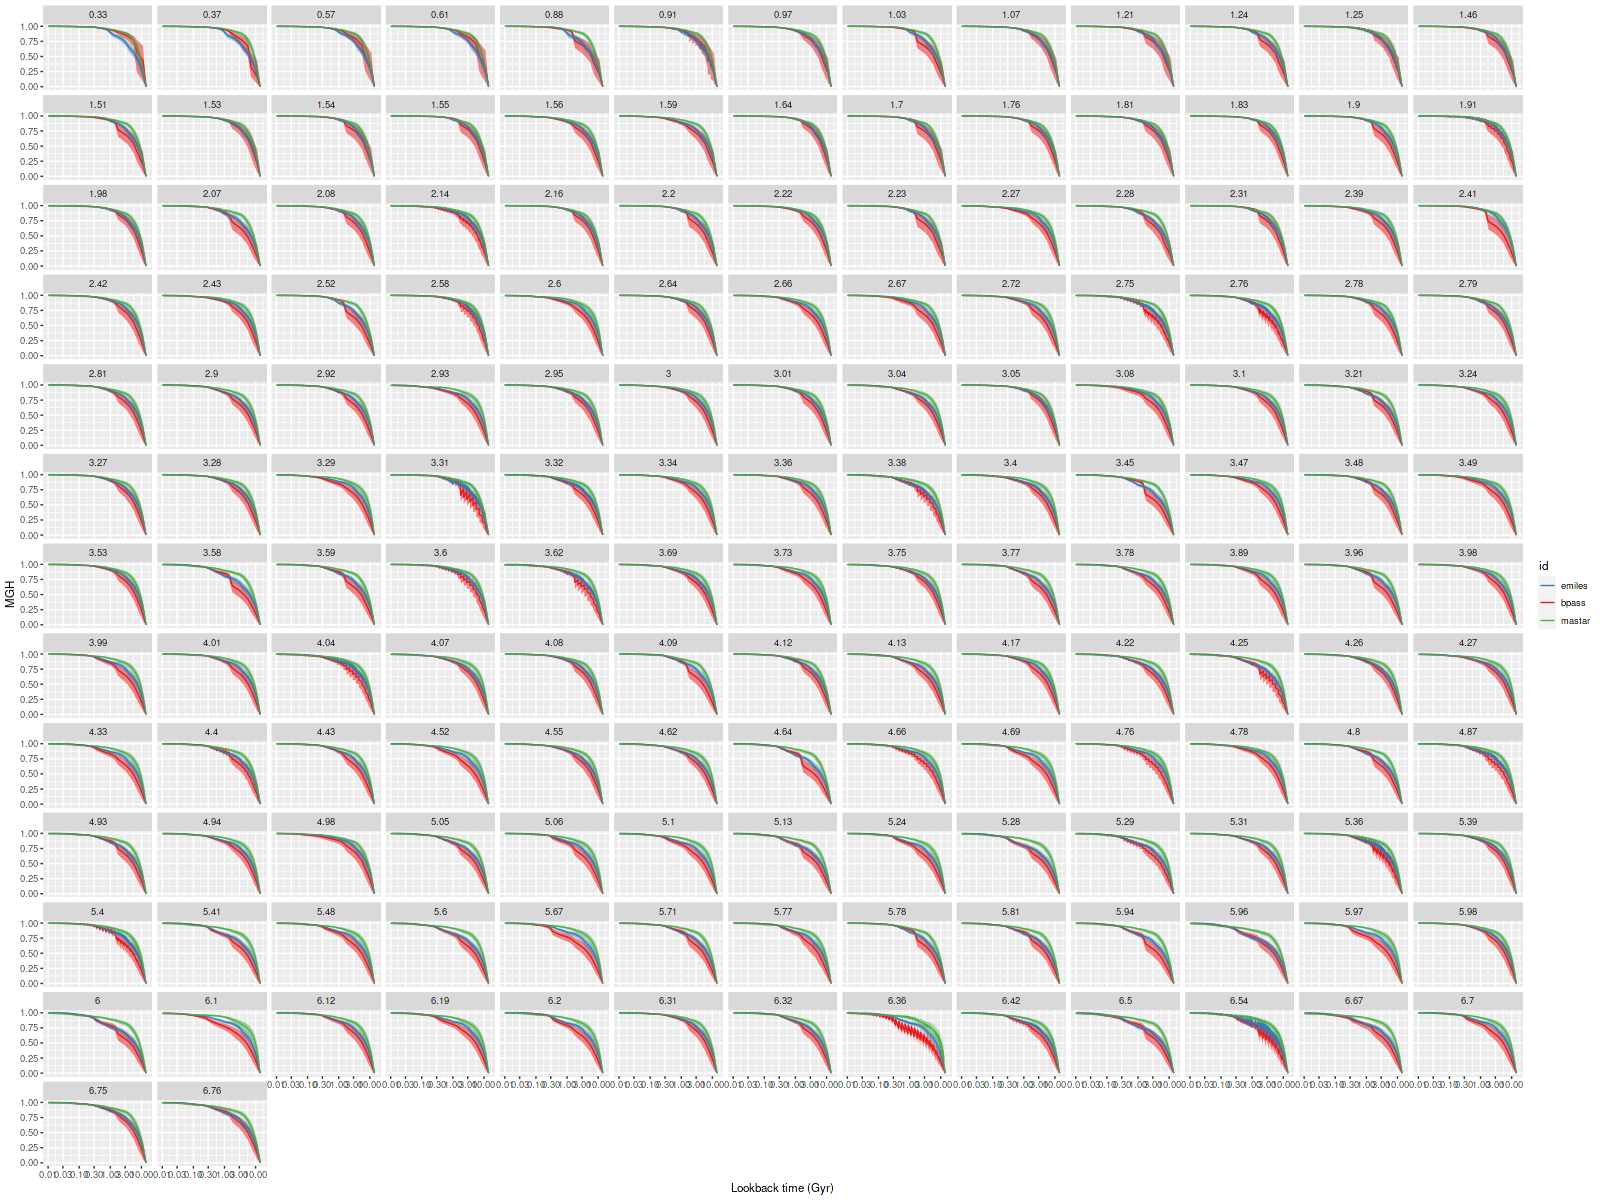
Although less obvious many of the BPASS model runs have a distinct spike in SFR at the same 1.6 Gyr as in the post-starburst models. In some of the spectra it’s strong enough to contribute significantly to the present day stellar mass. A few other peculiarities are harder to see. The MaStar models invariably have an upturn in SFR at the youngest age (1 Myr), while the BPASS models invariably have a sharp downturn at the youngest age.
There are similar offsets in stellar mass densities to the post-starburst, by 0.12 and -0.14 ± 0.03 in MaStar and BPASS respectively. The mean star formation rate densities are 0.25 ± 0.05 larger in MaSTar but 0.18 ± 0.07 dex lower in BPASS models.
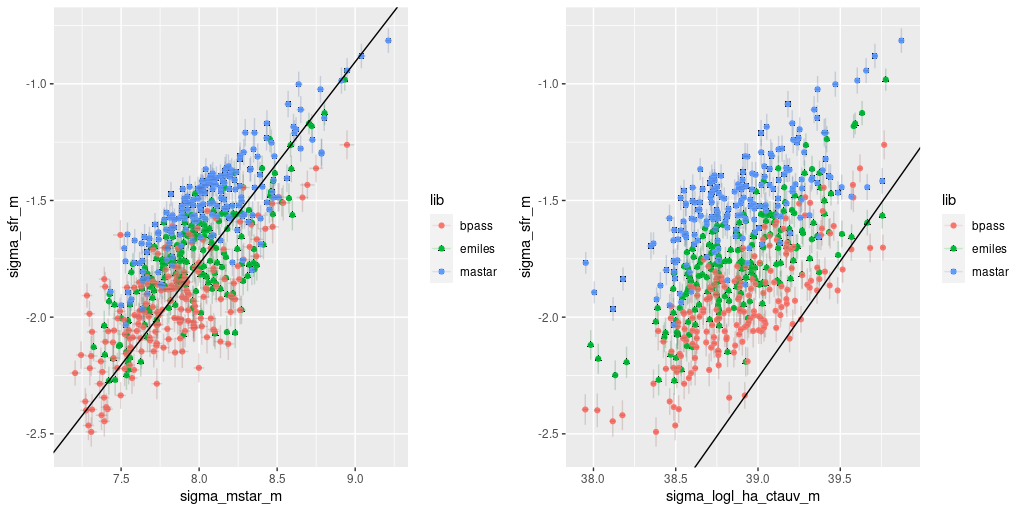
For a quick look at how these model differences affect some key relationships, below are plots of the mean (and standard deviations) of SFR density against stellar mass density (L) and SFR density vs. Hα luminosity density (corrected for estimated stellar attenuation only) (R) for UGC 8162. The straight lines are my estimate of the “star forming main sequence”, and on the right the Calzetti calibration. As expected the models straddle the “spatially resolved star forming main sequence” that I estimated previously5data for this galaxy was recently downloaded and the model results did not contribute to my estimate.. Note that since the BPASS model estimates of both SFR and stellar mass are offset by similar amounts from the EMILES based models the points are just shifted downward along essentially the same relationship. The MaStar based models appear slightly offset to higher SFR values at a given stellar mass density. On the right, there’s a fairly clear stratification. The Hα luminosity estimates are nearly identical for all 3 sets of model runs, so we see the differences in SFR density estimates.
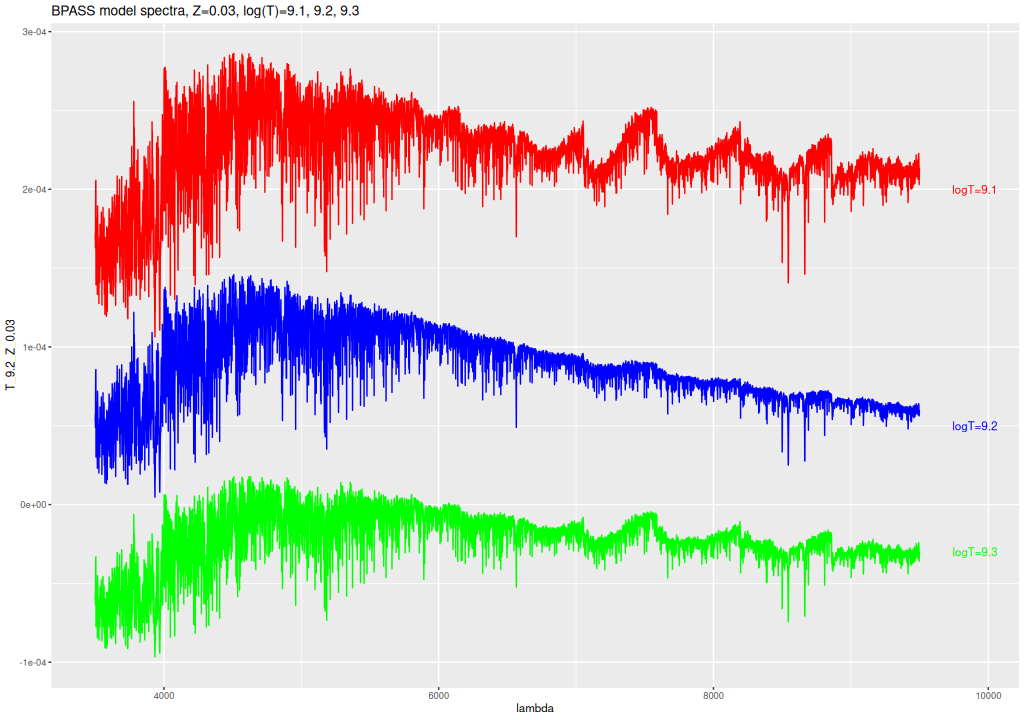
I don’t really have an explanation for the 1.6 Gyr spike in the BPASS models. It’s happening in the two super-solar metallicity bins, which track with the others for both younger and older ages. One possible clue is in their spectra. The broad absorption features in the red are considerably deeper at both younger and older ages6spectra are offset vertically for clarity.. Whether there’s a physical reason for this and why it would affect the models as seen is unknown to me.
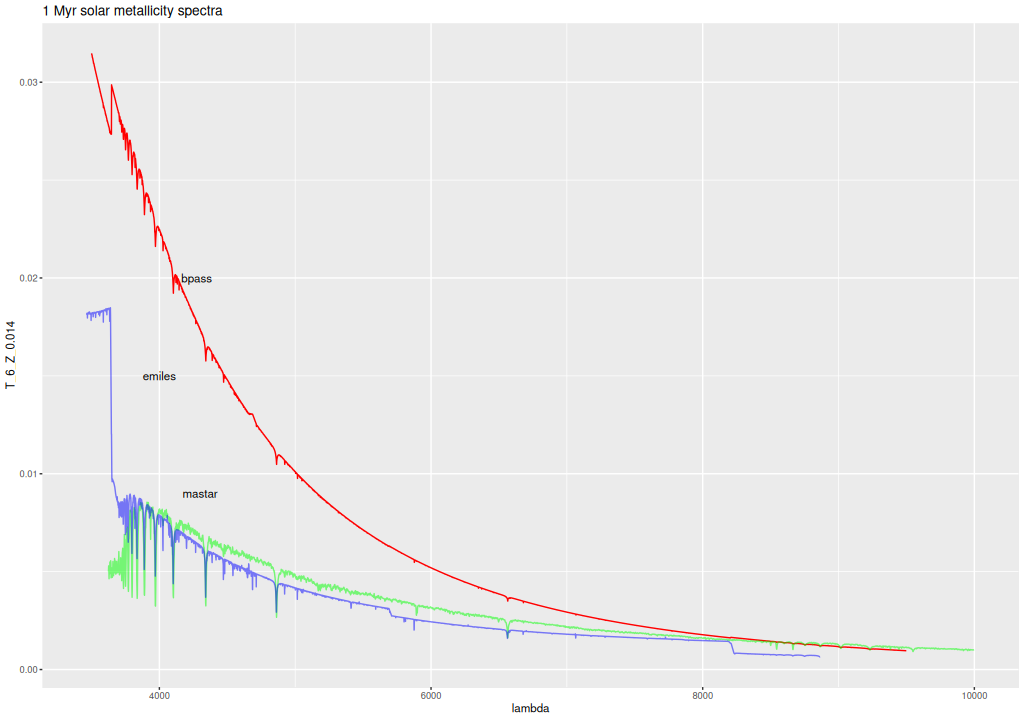
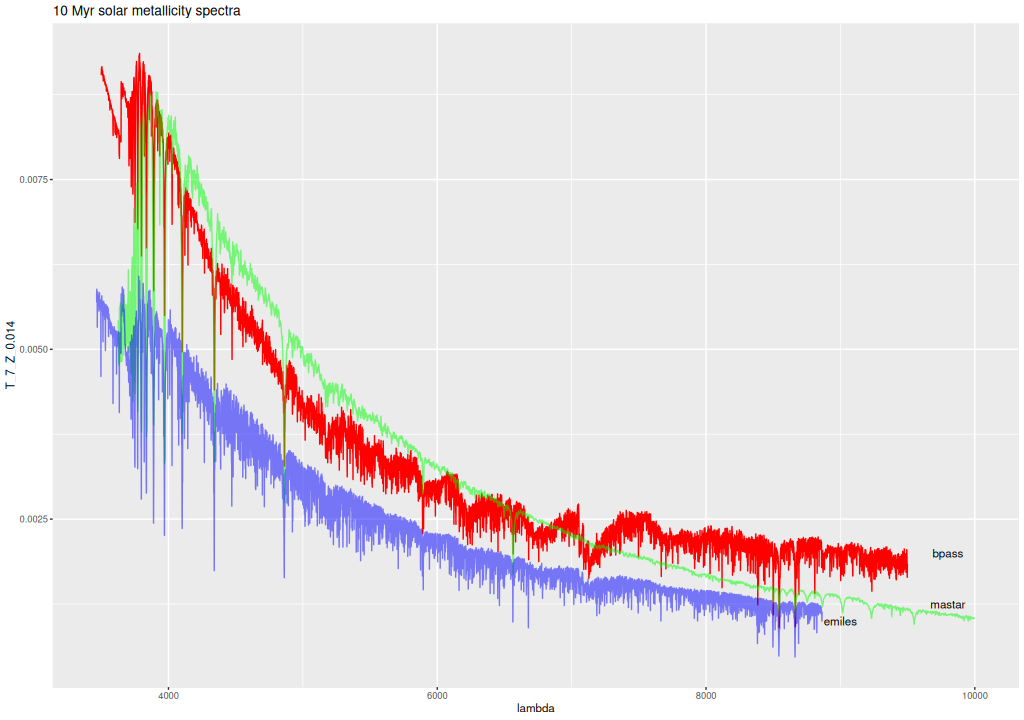
There are some notable differences among the libraries at young ages at well. Below are plotted the 1 and 10 Myr spectra at solar metallicity for the 3 libraries. The “EMILES” spectra recall are from the theoretical PyPopstar models with continuum emission included. The BPASS model is considerably more luminous and bluer at 1Myr than the other two and evolves more rapidly at young ages. Is this because I chose the models with 300 M☉ upper mass limit? I should find out.
To conclude for now I haven’t quite decided what to replace my existing EMILES models with, if anything. I’m still optimistic that an MaStar based library is the way to go, but the version published by Sanchez et al. isn’t quite ready for production use. I may consider developing my own library although it’s outside the scope of my interests.