Confronting SFH models with observables – some results for normal disk galaxies

I’ve posted versions of some of these graphs before for both individual galaxies and a few larger samples, but I think they’ve all been unusual ones. I recently managed to complete model runs on 40 of the spirals from the normal barred and non-barred sample I discussed back in this post. The 20 barred and 20 non-barred galaxies in the sample aren’t really enough to address the results in the paper by Fraser-McKelvie that was the starting point for my investigation and more importantly the initial sample was chosen entirely at my whim. Unfortunately I don’t have the computer resources to analyze more than a small fraction of MaNGA galaxies. The sampling part of the modeling process takes about 15 minutes per spectrum on my 16 core PC (which is a huge improvement) and there are typically ~120 binned spectra per galaxy, so it takes ~30 hours per galaxy with one PC running at full capacity. I should probably take up cryptocurrency mining instead.

This sample comprises 5086 model runs with 2967 spectra of non-barred and 2119 of barred spirals. For some of the plots I’ll add results for 3348 spectra of 33 passively evolving Coma cluster galaxies.

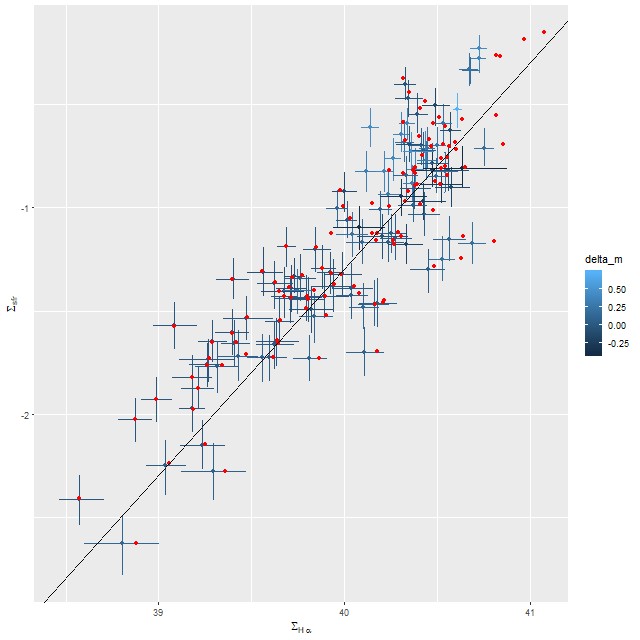
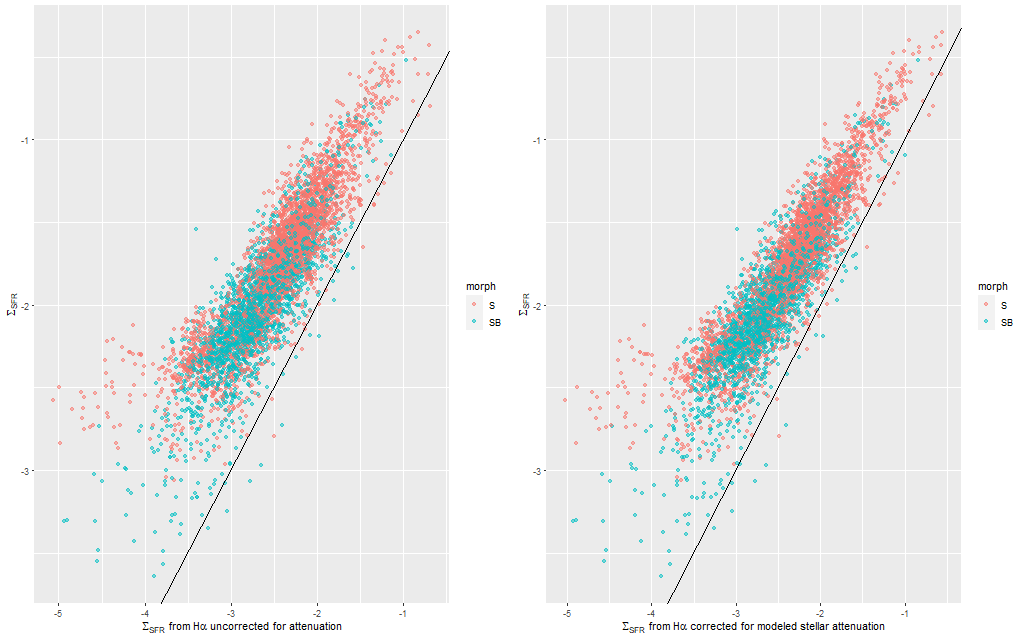
Anyway, first: the modeled star formation rate density versus the rate predicted from the Hα luminosity density, which is easily the most widely used star formation rate calibrator at optical wavelengths. The first plot below shows all spectra with estimates for both values. Red dots are (non-barred) spirals, blue are barred. Both sets of quantities have uncertainties calculated, but I’ve left off error bars for clarity. Units on both axes are log10(M/yr/kpc2). I adopted the relation log(SFR) = log(L) – 41.26 from a review by Calzetti (2012), which is the straight line in these graphs. That calibration is traceable back to Kennicutt (1983), which as far as I know has never been revisited except for small adjustments to account for changing fashions in assumed stellar initial mass functions. In the left panel of the plot below Hα is uncorrected for attenuation. In the right it’s corrected using the modeled stellar attenuation, which as I noted some time ago will systematically underestimate the attenuation in H II regions. Not too surprisingly almost all points lie above the calibration line — the SFH models include a treatment of attenuation that might be too simple but still does make a correction for starlight lost to dust. The more important observation though is there’s a pretty tight relationship between modeled SFR density and estimated Hα luminosity density that holds over a nearly 3 order of magnitude range in both. The scatter around a simple regression line in the graphs below is about 0.2 dex. It’s not really evident on visual inspection but the points do shift slightly to the right in the right hand plot and there’s also a very slight reduction in scatter. These galaxies are actually not especially dusty, with an average model optical depth of around 0.25 (which corresponds to E(B-V) ≈ 0.07).
sfr_ha_40spirals
SFR density vs. prediction from Hα luminosity for 40 normal spirals. (L) Hα luminosity uncorrected for attenuation. (R) Hα corrected using estimated attenuation of stellar component.

To take a more refined look at this I limited the sample to regions with star forming emission line ratios using the standard BPT diagnostic based on [O III]/Hβ vs. [N II]/Hα. I require at least a 3σ detection in each line to make a classification, so besides limiting the analysis to regions that are in fact (I hope) forming stars it allows correcting Hα attenuation for the observed Balmer decrement since Hβ is by construction at least nominally detected. Now we get the results shown in the plot below. Units and symbols are as before. Hα luminosity is corrected using the Balmer decrement assuming an intrinsic ratio of 2.86 and the same attenuation curve shape as returned by the model. The SFR-Hα calibration line is the thick red one. The blue lines with grey ribbons are from “robust” simple regressions using the function lmrob in the R package robustbase1Correcting for attenuation produced a few significant outliers that bias an ordinary least squares fit and although it’s not specifically intended for measurements with errors this function seems to do a little better than either ordinary or weighted least squares.
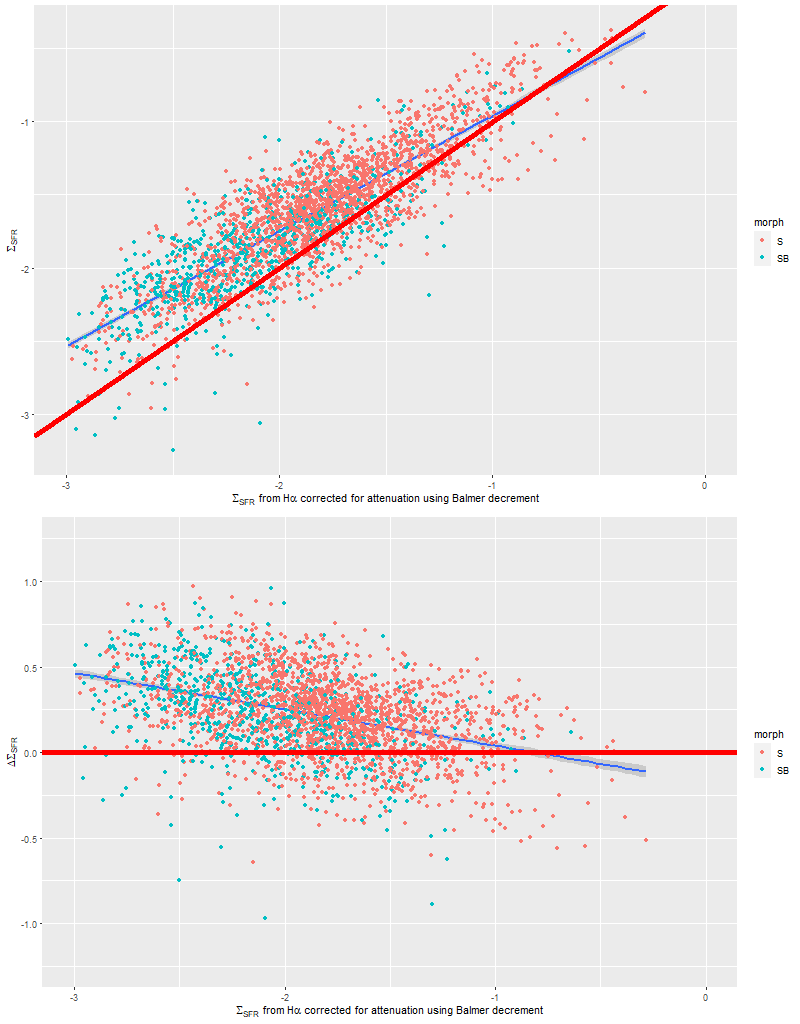
Model estimates of star formation rate density vs. SFR predicted from Hα luminosity density.

So the model SFR density straddles the calibration line, but with a distinct tilt — regions with relatively low Hα luminosity have higher than expected star formation. To quantify this here is the output from the function lmrob:

Call:
lmrob(formula = sigma_sfr_m ~ sigma_sfr_ha, data = df.sfr)
 \--> method = "MM"
Residuals:
      Min        1Q    Median        3Q       Max 
-3.862996 -0.142375  0.004122  0.137030  1.305471 

Coefficients:
              Estimate Std. Error t value Pr(>|t|)    
(Intercept)  -0.174336   0.019224  -9.069   <2e-16 ***
sigma_sfr_ha  0.785954   0.009948  79.008   <2e-16 ***
---
Signif. codes:  0 ‘***’ 0.001 ‘**’ 0.01 ‘*’ 0.05 ‘.’ 0.1 ‘ ’ 1

Robust residual standard error: 0.2097 
Multiple R-squared:  0.7402,	Adjusted R-squared:  0.7401 
Convergence in 10 IRWLS iterations

Robustness weights: 
 6 observations c(781,802,933,941,2121,2330) are outliers with |weight| = 0 ( < 3.8e-05); 
 223 weights are ~= 1. The remaining 2424 ones are summarized as
   Min. 1st Qu.  Median    Mean 3rd Qu.    Max. 
 0.0107  0.8692  0.9525  0.9020  0.9854  0.9990 

I also ran my Bayesian measurement error model on this data set and got the following estimates for the intercept, slope, and residual standard deviation:


         mean      se_mean          sd       2.5%        25%        50%        75%      97.5%    n_eff      Rhat
b0 -0.1942387 1.943297e-04 0.018346806 -0.2312241 -0.2063781 -0.1943811 -0.1819499 -0.1589849 8913.379 0.9997482
b1  0.7767853 9.828814e-05 0.009436693  0.7579702  0.7706115  0.7768086  0.7830051  0.7949343 9218.014 0.9995628
s   0.2044701 3.837428e-05 0.003319280  0.1981119  0.2021872  0.2043949  0.2067169  0.2110549 7481.821 0.9997152

Almost the same! So, how to interpret that slight “tilt”? The obvious comment is that the model results probe a very different time scale — by construction 100 Myr — than Hα (5-10 Myr). As a really toy model consider an isolated, instantaneous burst of star formation. As the population ages its star formation rate will be calculated to be constant from its birth up until 100 Myr when it drops to 0, while its emission line luminosity declines steadily. So its trajectory in the plot above will be horizontally from right to left until it disappears. In fact in spiral galaxies in the local universe star formation is generally localized, usually along the leading edges of arms in grand design spirals. Slightly older populations will be more dispersed.

This can be seen pretty clearly in the SFR maps for two galaxies from this sample below. In both cases regions with high star formation rate track the spiral arms closely, but are more diffuse than regions with high Hα luminosity.

Second topic: the spectral region around the 4000Å “break” has long been known to be sensitive to stellar age. Its use as a quantitative specific star formation rate indicator apparently dates to Brinchmann et al. (2004)2They don’t cite any antecedents and I can’t find any either.. More recently Bluck et al. (2020) used a similar technique at the sub-galactic level on MaNGA galaxies. Both studies use D4000 as a secondary star formation rate indicator, preferring Hα luminosity as the primary SFR calibrator with D4000 reserved for galaxies (or regions) with non-starforming emission line ratios or lacking emission. Oddly, I have been unable to find an actual calibration formula in a slightly better than cursory search of the literature — both of the cited papers present schematic graphs with overlaid curves giving the adopted relationships and approximate uncertainties. The Brinchmann version from the published paper is copied and pasted below.

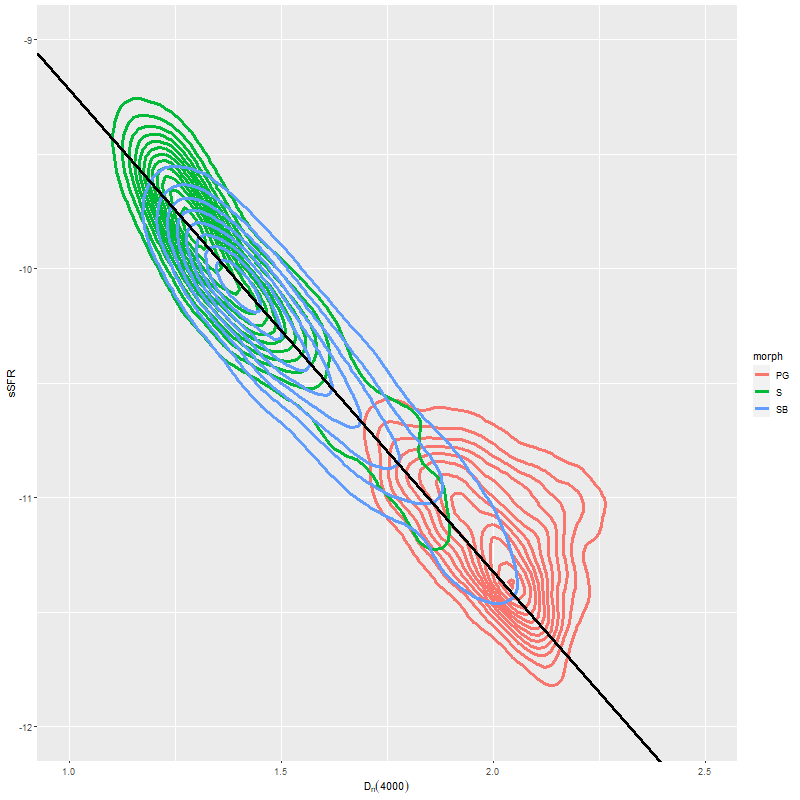
In the two graphs below I’ve added data from the passively evolving Coma cluster sample comprising 3348 binned spectra in 33 galaxies. There are two versions of the same graphs. Individual points are displayed in the first, as before with error bars suppressed to aid (slightly) clarity. The second displays the density of points at arbitrarily spaced contour intervals. The straight line is the “robust” regression line calculated for the spiral sample only, which for the sake of completeness is

\( \log10(sSFR) = -7.11 (\pm 0.02) – 2.11 (\pm 0.015) D_n(4000)\)
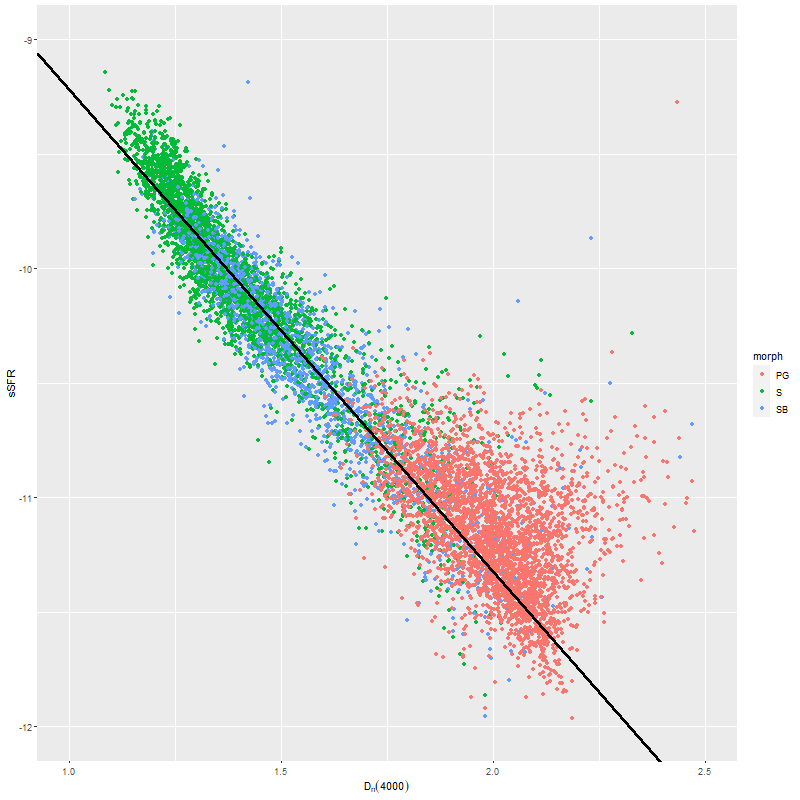
d4000_ssfr_40spirals_asscatter
Model sSFR vs. measured value of D4000. 40 barred and non-barred spirals + 33 passively evolving Coma cluster galaxies.
Model sSFR vs. measured value of D4000 (2D density version). 40 barred and non-barred spirals + 33 passively evolving Coma cluster galaxies.

Call:
lmrob(formula = ssfr_m ~ d4000_n, data = df.ssfr)
 \--> method = "MM"
Residuals:
       Min         1Q     Median         3Q        Max 
-0.9802409 -0.0916555 -0.0005187  0.0962981  7.1748499 

Coefficients:
            Estimate Std. Error t value Pr(>|t|)    
(Intercept) -7.10757    0.02009  -353.8   <2e-16 ***
d4000_n     -2.10894    0.01418  -148.7   <2e-16 ***
---
Signif. codes:  0 ‘***’ 0.001 ‘**’ 0.01 ‘*’ 0.05 ‘.’ 0.1 ‘ ’ 1

Robust residual standard error: 0.1384 
Multiple R-squared:  0.9043,	Adjusted R-squared:  0.9043 
Convergence in 13 IRWLS iterations

Robustness weights: 
 39 observations c(45,958,1003,1165,1200,1230,1249,1279,1280,1281,1282,1283,1294,1298,1299,1992,2040,2047,2713,2722,2723,2729,2735,2736,2974,3212,3226,3250,3667,3668,3671,3677,3685,3687,3688,3691,4056,4058,4083)
	 are outliers with |weight| <= 1.1e-05 ( < 2.1e-05); 
 418 weights are ~= 1. The remaining 4310 ones are summarized as
     Min.   1st Qu.    Median      Mean   3rd Qu.      Max. 
0.0001994 0.8684000 0.9514000 0.8911000 0.9850000 0.9990000 
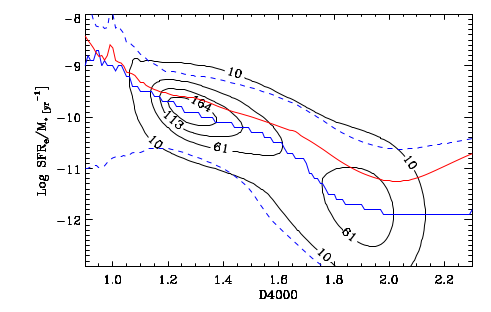
The relation between D4000 and sSFR as estimated by Brinchmann et al. 2004

All three groups follow the same relation but with some obvious differences in distribution. The non-barred spiral sample extends to higher star formation rates (either density or sSFR) than barred spirals, which in turn extend into the passively evolving range. The Coma cluster sample has a long tail of high D4000 values (or high specific star formation rates at given D4000) — this is likely because D4000 becomes sensitive to metallicity in older populations and this sample contains some of the most massive (and highest metallicity) galaxies in the local universe. Also, as I’ve noted before these models “want” to produce a smoothly varying mass growth history, which means that even the reddest and deadest elliptical will have some contribution from young populations. This seems to put a floor on modeled specific SFR of ∼10-11.5 yr-1.

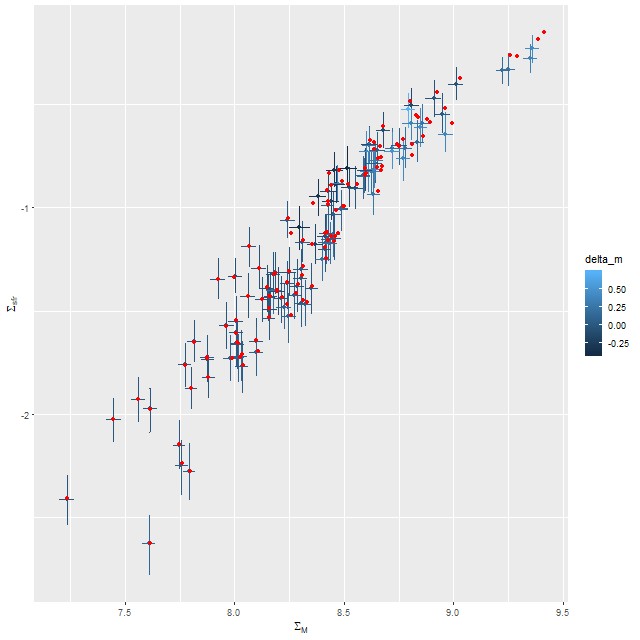
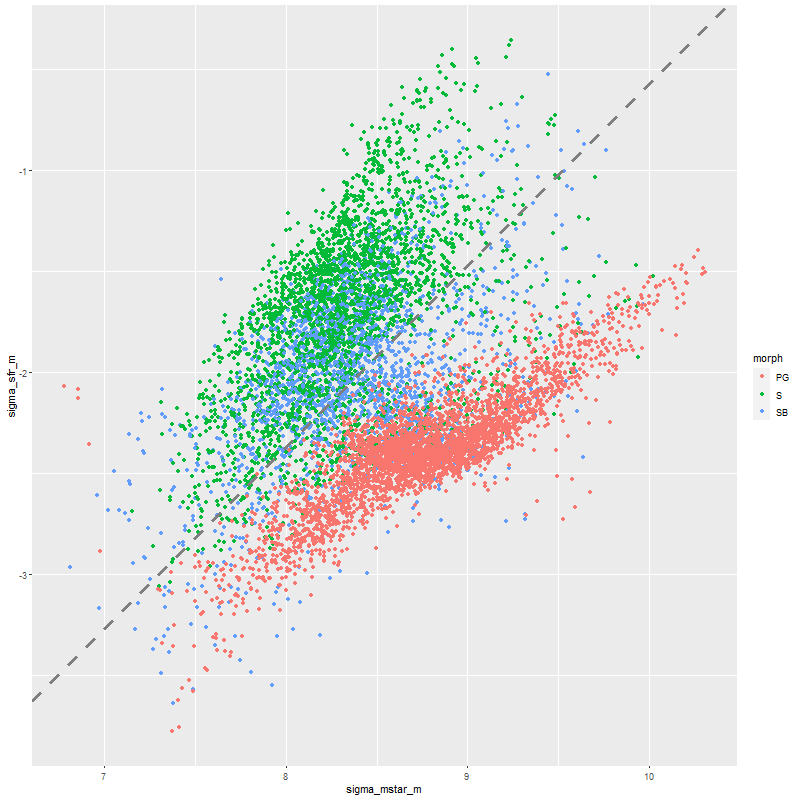
Just to touch briefly on the paper by Fraser-McKelvie et al. barred spirals in this sample do have lower overall star formation than non-barred, with large areas in the green valley or even passively evolving. This sample is too incomplete to say much more. For the sake of having a visualization here is the spatially resolved ΣSFR vs. ΣM* relation. The dashed line is Bluck’s estimate of the star forming “main sequence,” which looks displaced downward compared to my estimates.
mstar_sfr_40spirals+33etg
Model SFR density vs. stellar mass density. 40 barred and non-barred spirals + 33 passively evolving Coma cluster galaxies.

Finally, here are a couple of grand design spirals, one barred and one (maybe) not to illustrate how model results track morphological features. In the barred galaxy note that the arms are clearly visible in the SFR maps but they aren’t visible at all in the stellar mass map, which does show the presence of the very prominent bar.

NGC 6001 – thumbnail with MaNGA IFU footprint
NGC 6001 (MaNGA plateifu 9041-12701) (L) Model SFR surface density (M) Hα luminosity density (R) sSFR
NGC 5888- thumbnail with MaNGA IFU footprint
NGC 5888 (MaNGA plateifu 9871-12702) (L) Model SFR surface density (M) Hα luminosity density (R) sSFR
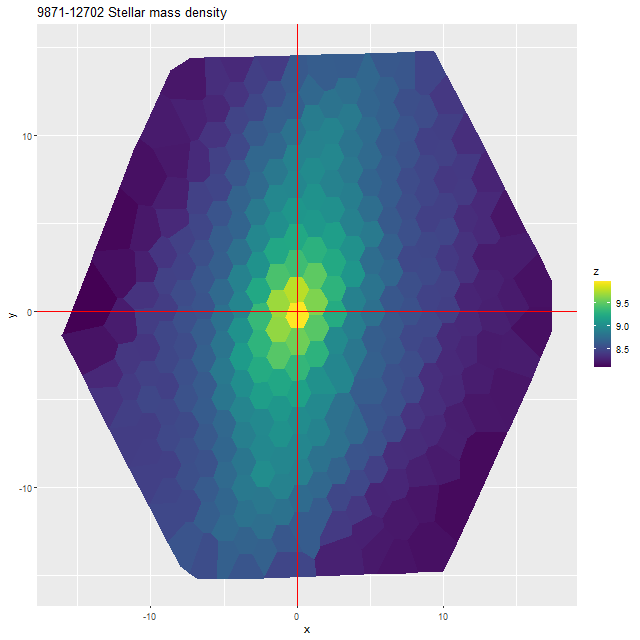
9871-12702_stellar_mass_density
NGC 5888 (MaNGA plateifu 9871-12702) – Log model stellar mass density (Msun/kpc2

I’m not sure how much more I’m going to do with normal spirals. As I’ve said repeatedly the full sample is much too large for my computing resources.

Next time (probably) I’m going to return to a very small sample of post-starburst galaxies, which I may also return to when the final SDSS public data is released.

NGC 4949 – first attempt at modeling star formation histories with non-parametric losvd’s

I only have time to analyze one MaNGA galaxy for now and since it was the first to get the correctly coded LOSVD estimates I chose the Coma Cluster S0 galaxy NGC 4949 that I discussed in the last post for SFH modeling. As I mentioned a few posts ago trying to model the LOSVD and star formation history simultaneously is far too computationally intensive for my resources, so for now I just convolve the SSP model spectral templates with the elementwise means of the convolution kernels estimated as described previously and feed those to the SFH modeling code. My intuition is that the SFH estimates should be at least slightly more variable if the kinematics are treated as variable as well, but for now there’s no real alternative to just picking a fiducial value. Of course a limited test of that hypothesis could be made by pulling multiple draws from the posterior of the LOSVD distribution. I will certainly try that in the future.

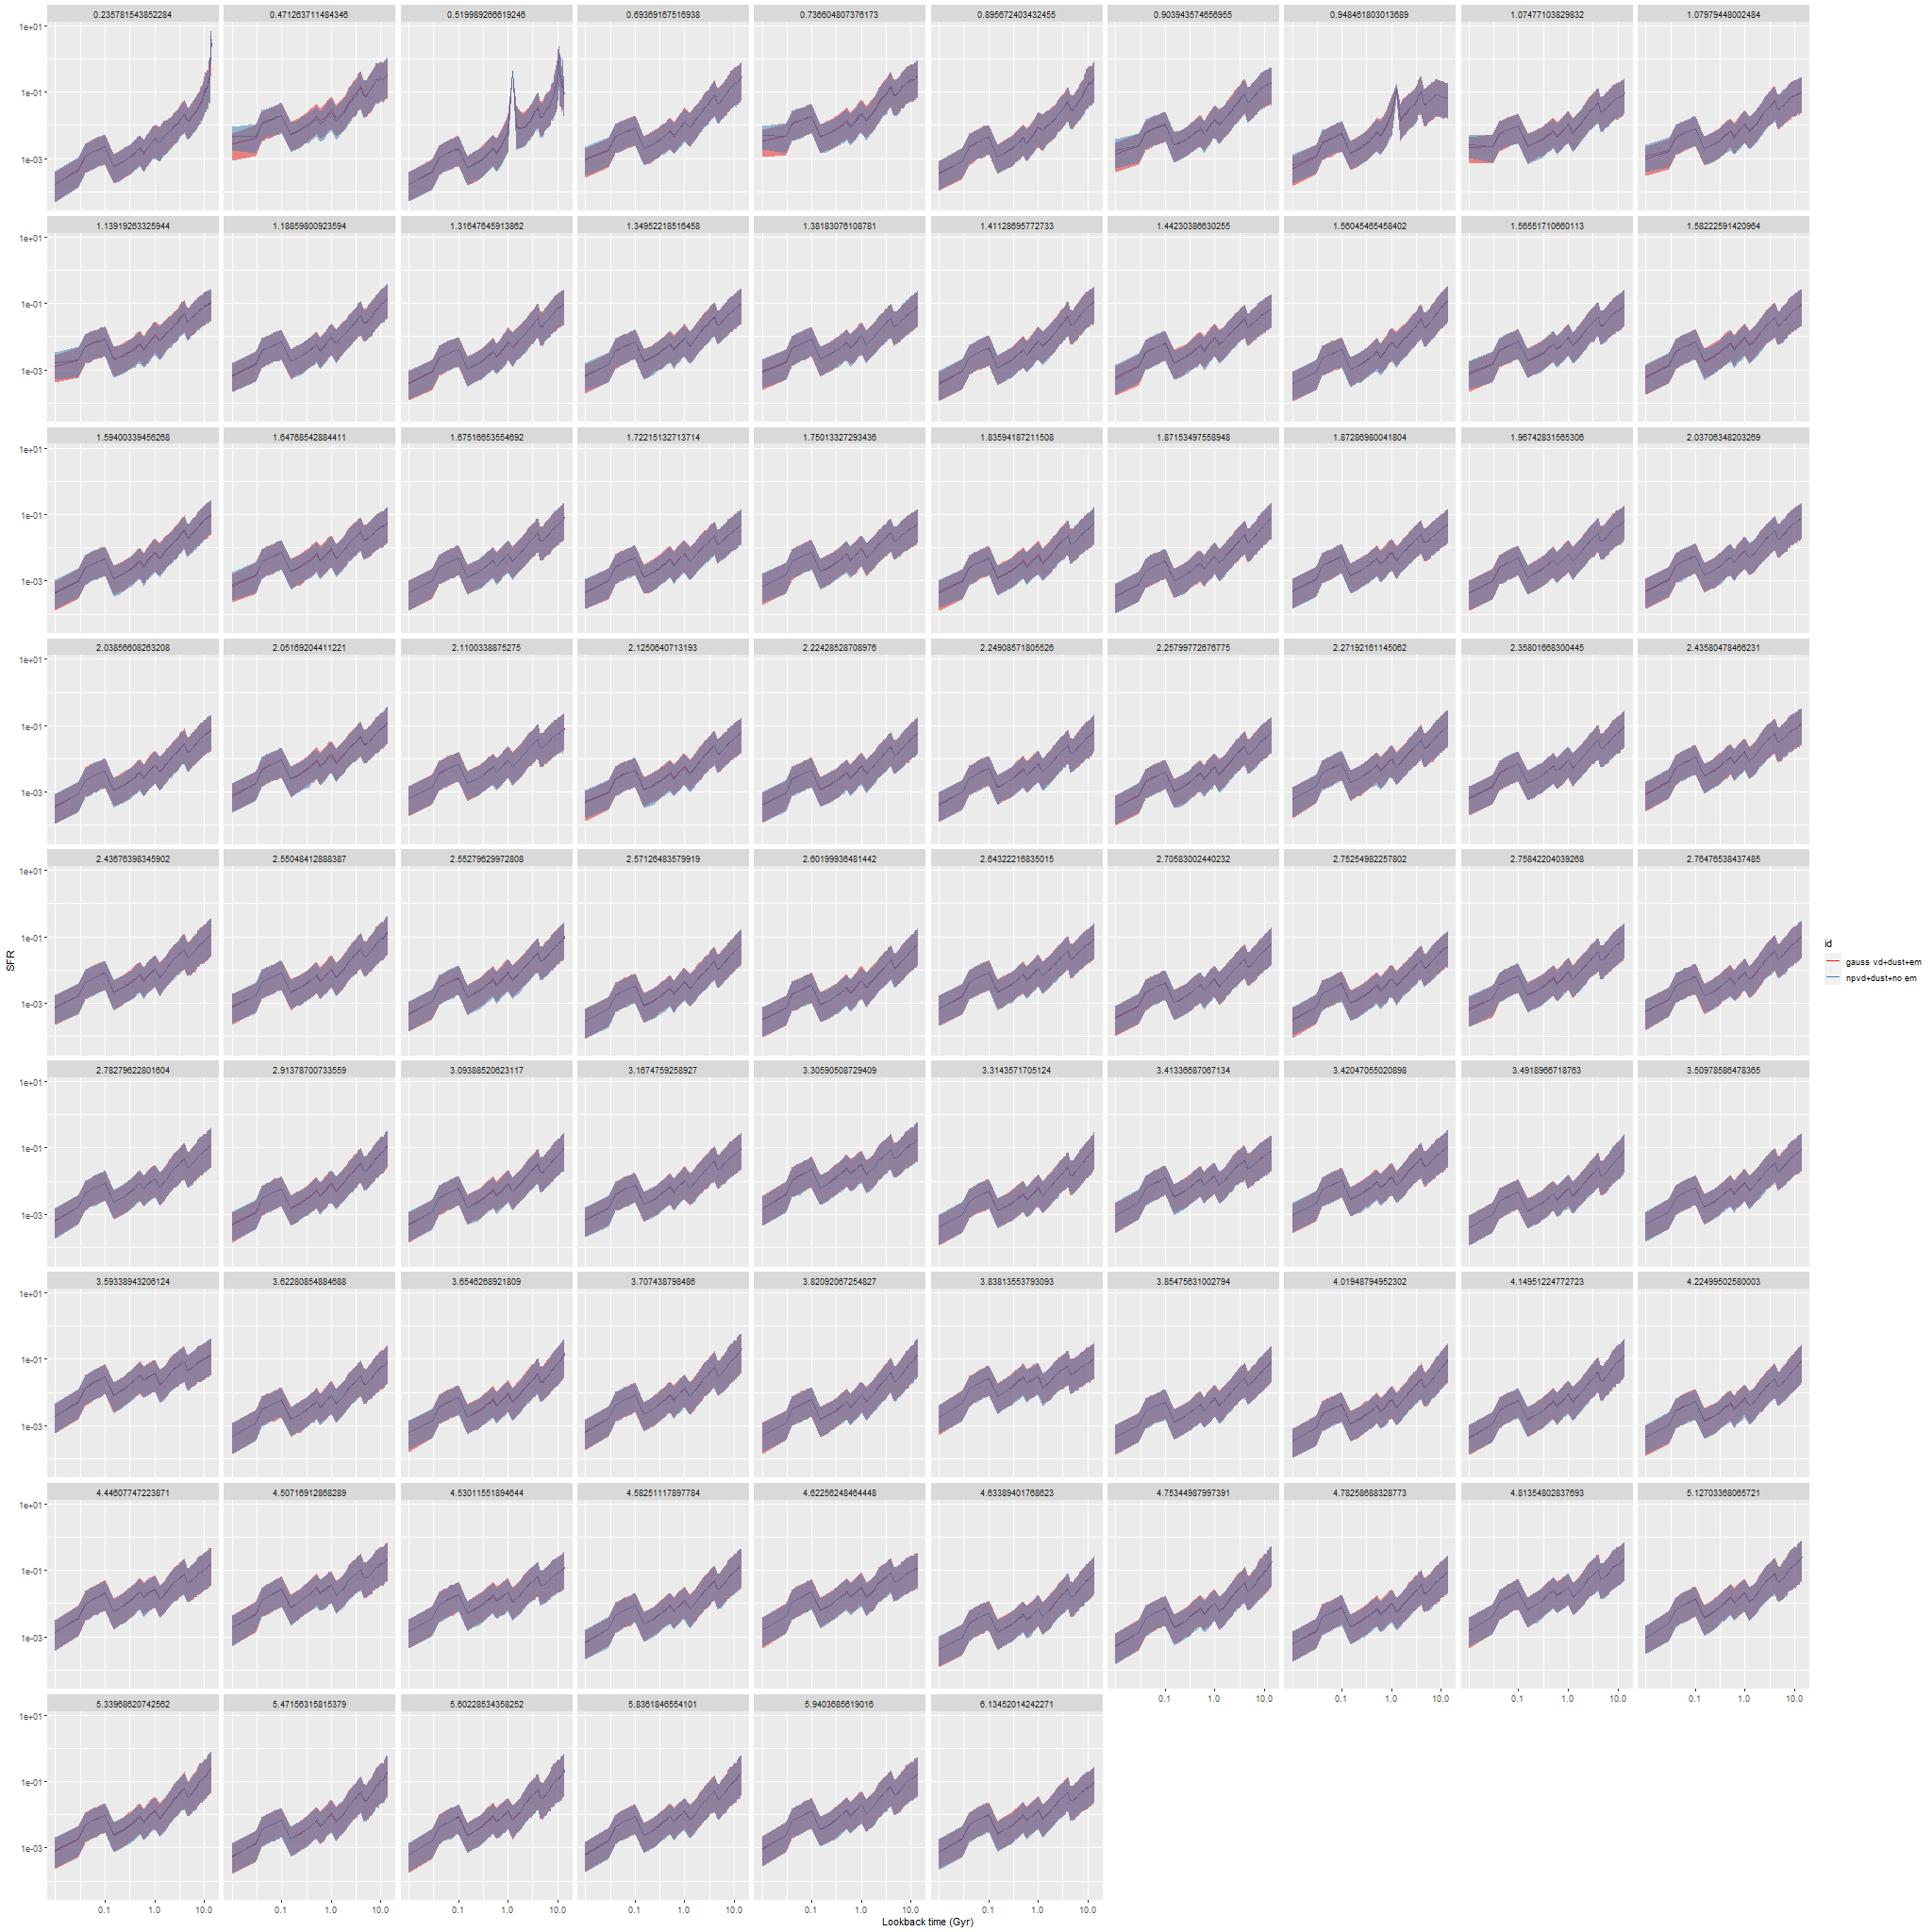
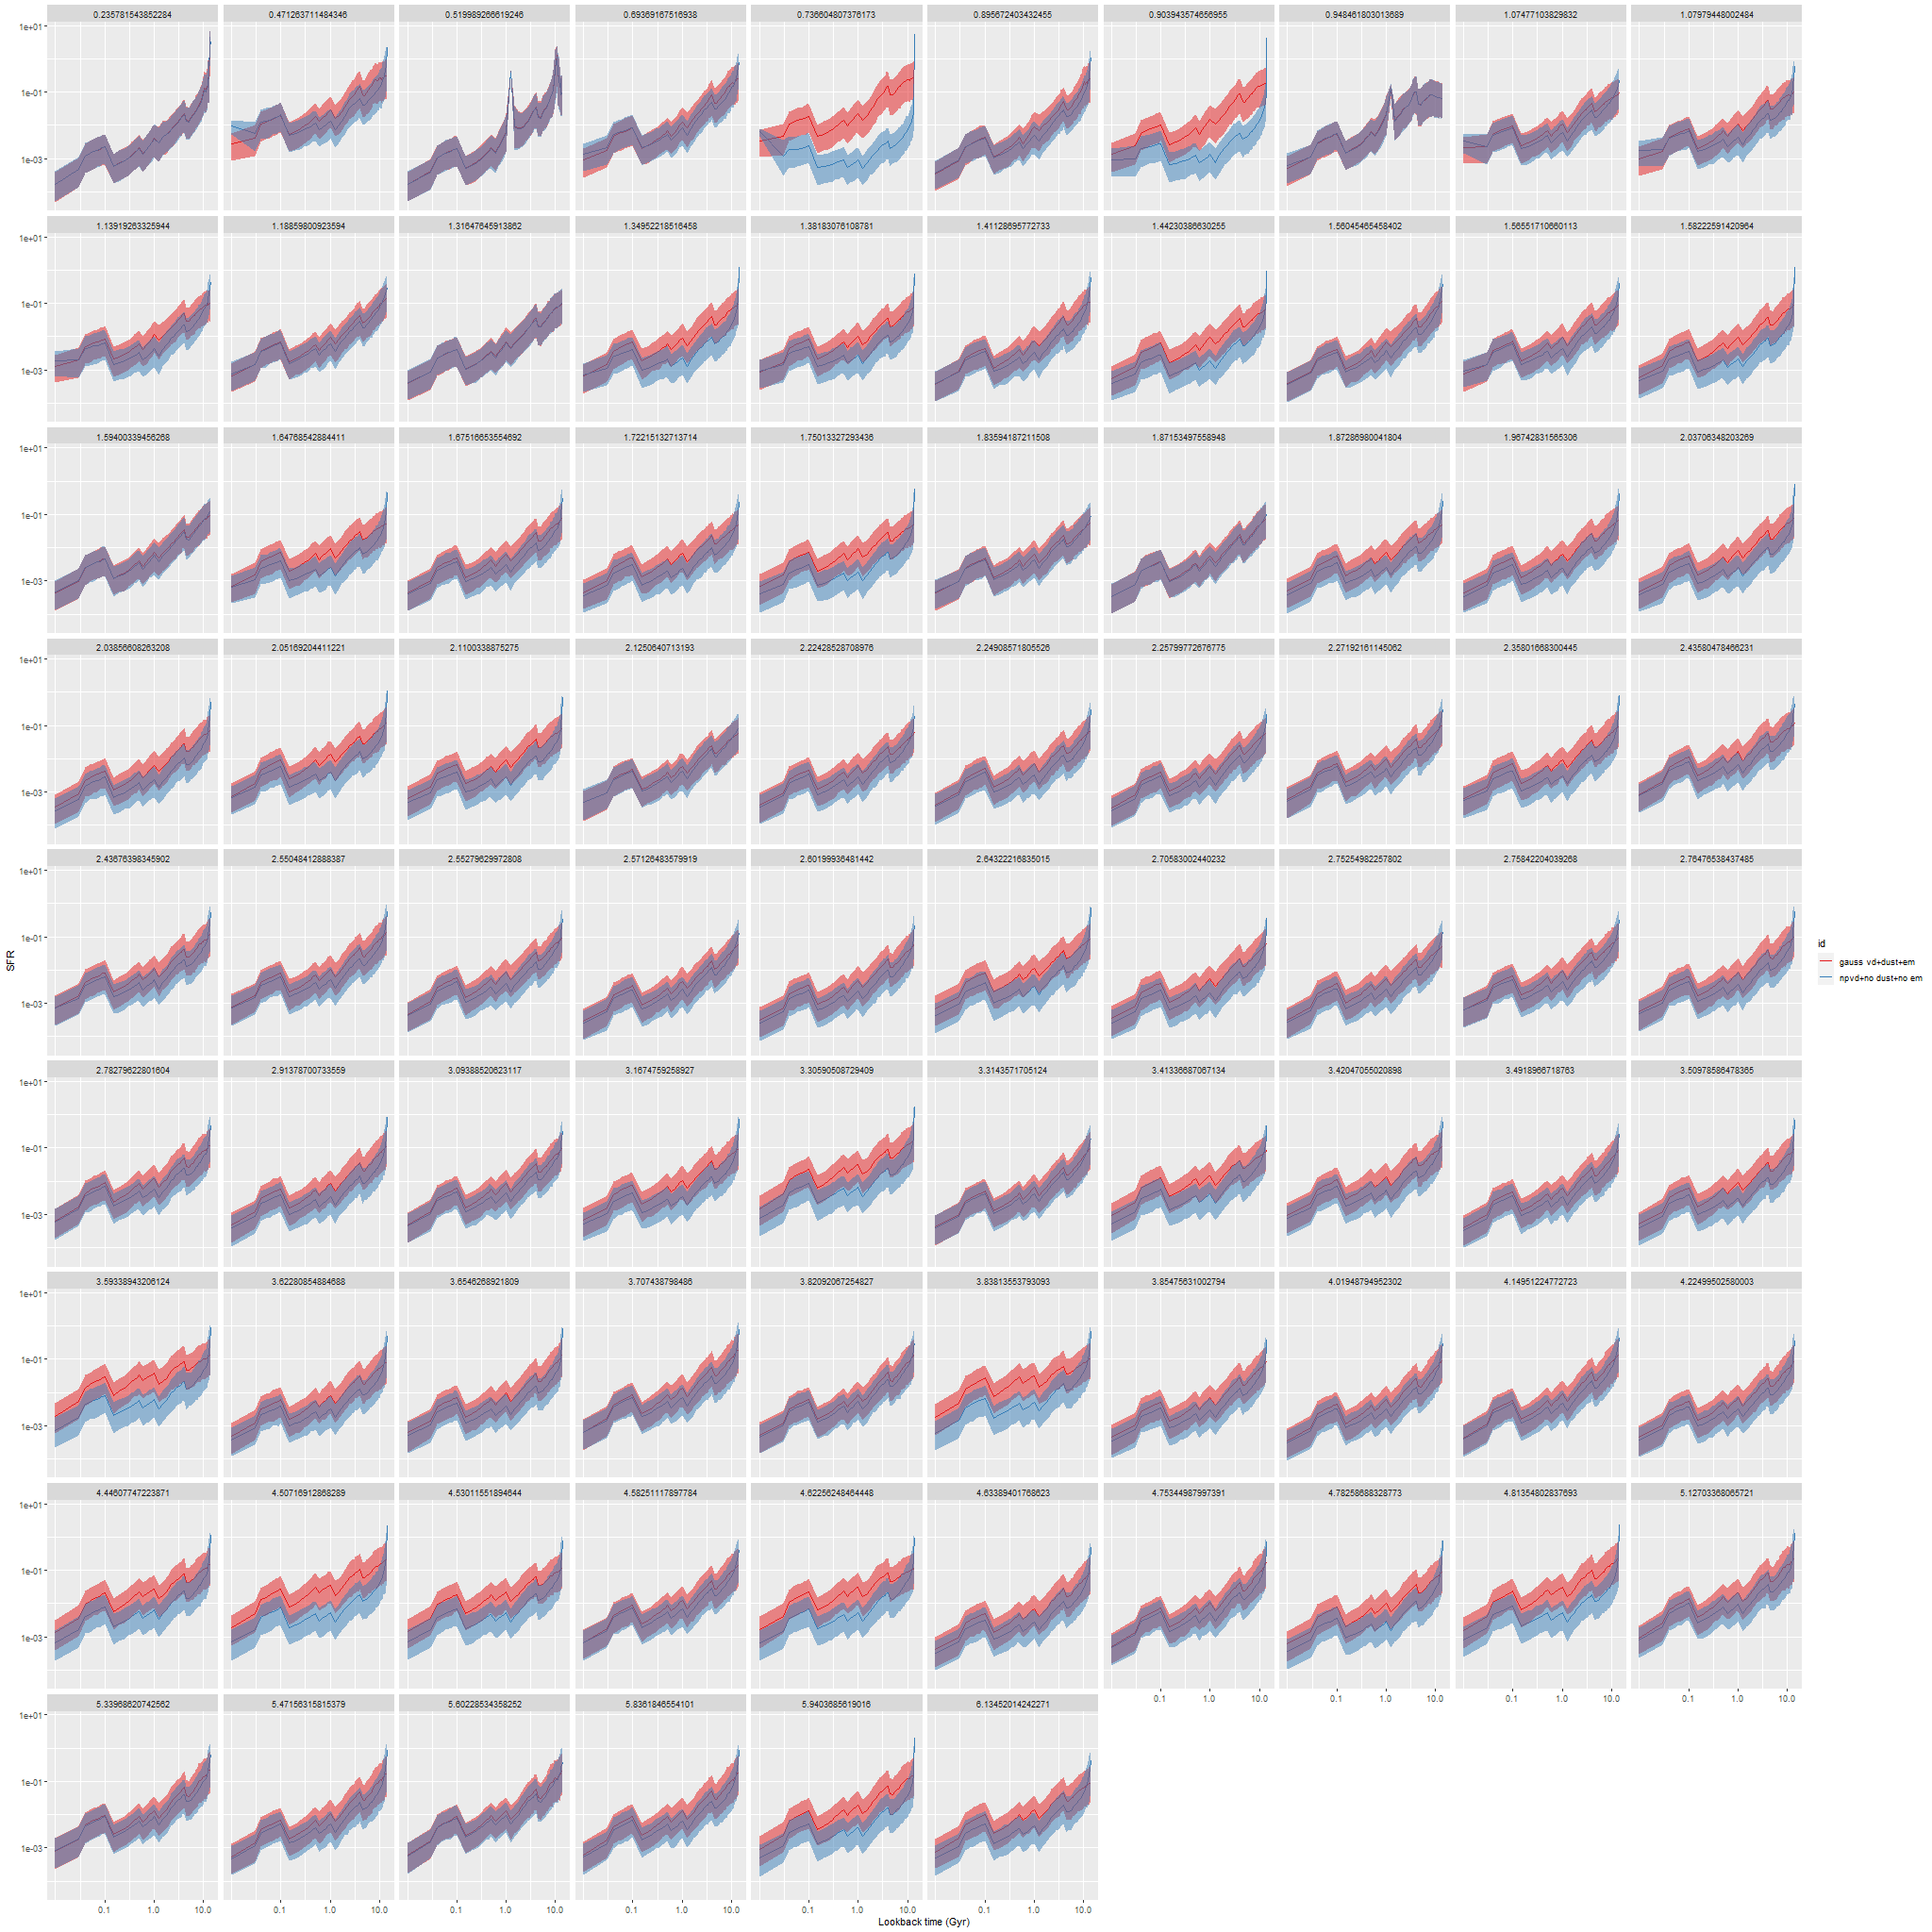
My first idea was to leave both dust and emission lines out of the SFH models. The first choice was to save CPU cycles and also based on the expectation that these passively evolving galaxies should have very little dust. The results were rather interesting: here are ribbon plots of model SFH’s for all 86 binned spectra. The pink ribbons are from the original model runs, which assumed single component gaussian velocity distributions, modified Calzetti attenuation, and included emission lines (which contribute negligible flux throughout). The blue ribbons are with non-parametric LOSVD and no attenuation model:

NGC 4949 – modeled star formation histories with single component gaussian and nonparametric estimates of line of sight velocity distributions with no dust model

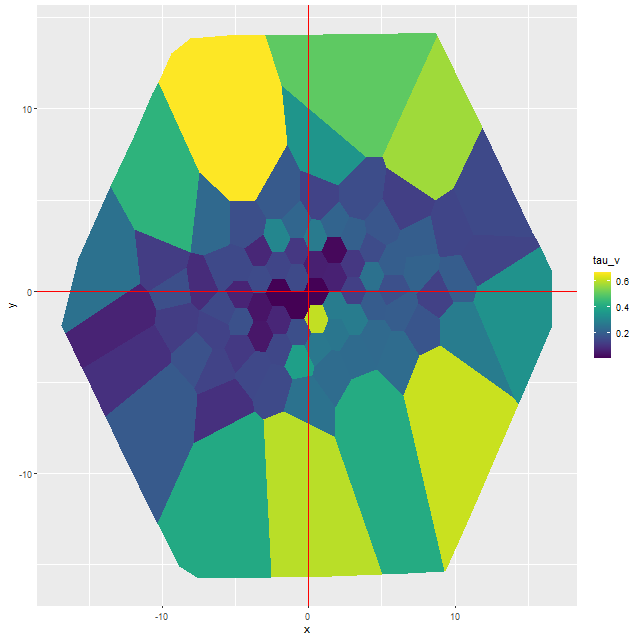
The differences in star formation histories turn out to be almost entirely due to neglecting dust in the second set of model runs. In this galaxy there are some areas with apparently non-negligible amounts of dust:

NGC 4949 – map of estimated optical depth of attenuation

Ignoring attenuation forces the model to use redder, hence older (and probably more metal rich although I haven’t yet checked) stellar populations and this has, in some cases, profound effects on the model SFH.

So, I tried a second set of model runs adding back in modified Calzetti attenuation but still leaving out emission:

ngc4949_sfh0_sfhnpvddust
NGC 4949 – modeled star formation histories with single component gaussian and nonparametric estimates of line of sight velocity distributions

And now the models are nearly identical, with minor differences mostly in the youngest age bin. All other quantities that I track are similarly nearly identical in both model runs.

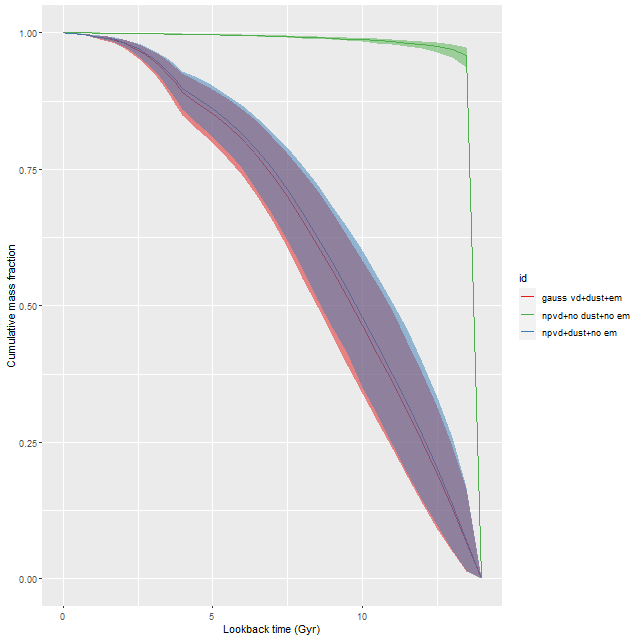
Here is the modeled mass growth history for a single spectrum of a region just south of the nucleus that had the largest difference in model SFH in the second set of runs, and the largest optical depth of attenuation in the first and 3rd. This is an extreme case of the shift towards older populations required by the neglect of reddening. Well over 90% of the present day stellar mass was, according to the model, formed in the first half Gyr after the big bang with almost immediate and complete quenching thereafter. While not an impossible star formation history it’s not one I often see result from these models, which strongly favor more gradual mass buildup.

ngc4949_mgh3models_spec14
NGC 4949 – modeled mass growth histories for models with and without an attenuation model

So, the conclusion for now is that having an attenuation model matters a lot, the detailed stellar kinematics not so much. Of course this is a relatively simple example because it’s a rapid rotator and the model convolution kernels are fairly symmetrical throughout the galaxy. The massive ellipticals and especially cD galaxies with more complex kinematics might provide some surprises.

Update on Bayesian line of sight velocity modeling

Well that was simple enough. I made a simple indexing error in the R data preprocessing code that resulted in a one pixel offset between the template and galaxy spectra, which effectively resulted in shifting the elements of the convolution kernel by one bin. I had wanted to look at a rotating galaxy to perform some diagnostic tests, but once I figured out my error this turned out to be a pretty good validation exercise. So I decided to make a new post. The galaxy I’m looking at is NGC 4949, another member of the sample of passively evolving Coma cluster galaxies of Smith et al. It appears to me to be an S0 and is a rapid rotator:

NGC 4949 – SDSS image
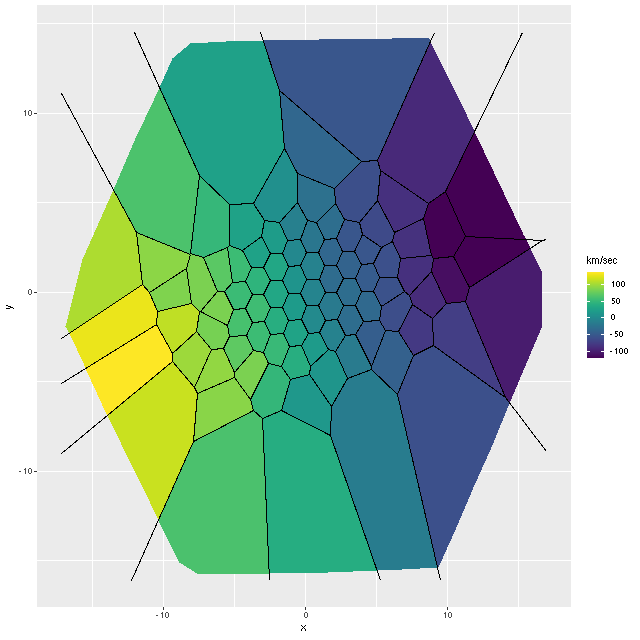
NGC 4949 – radial velocity map

These projected velocities are computed as part of my normal workflow. I may in a future post explain in more detail how they’re derived, but basically they are calculated by finding the best redshift offset from the system redshift (taken from the NSA catalog which is usually the SDSS spectroscopic redshift) to match the features of a linear combination of empirically derived eigenspectra to the given galaxy spectrum.

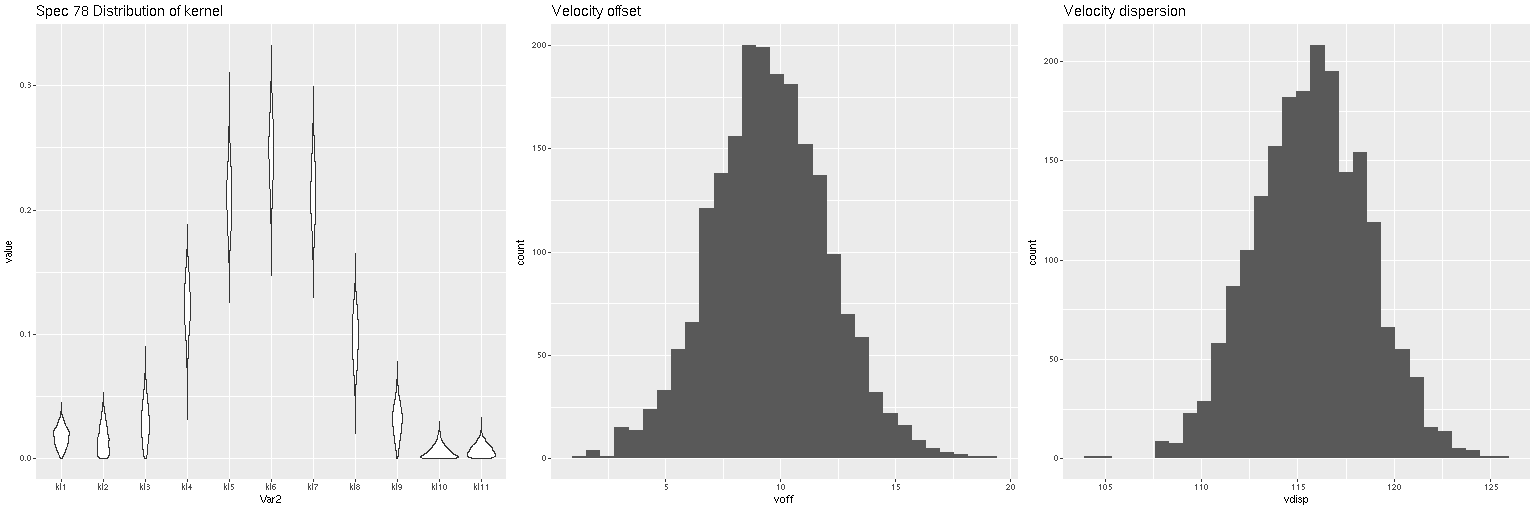
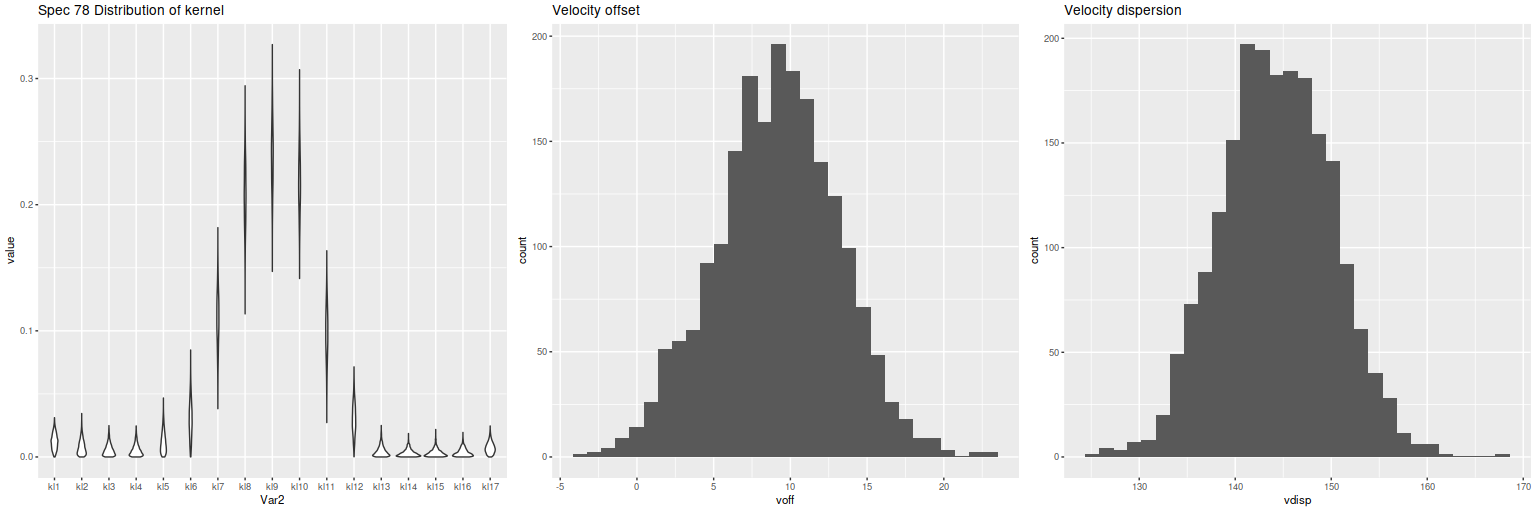
First exercise: find the line of sight velocity distribution after adjusting to the rest frame in each spectrum. This was the originally intended use of these models. This galaxy has fairly low velocity dispersion of ~100 km/sec. so I used a convolution kernel size of just 11 elements with 6 eigenspectra in each fit. Here is a summary of the LOSVD distribution for the central spectrum. This is much better. The kernel estimates are symmetrical and peak on average at the central element. The mean velocity offset is ≈ 9.5 km/sec, which is much closer to 0 than in the previous runs. I will look briefly at velocity dispersions at the end of the post: this one is actually quite close to the one I estimate with a single component gaussian fit (116 km/sec vs 110).

Estimated LOSVD of central spectrum of NGC 4949

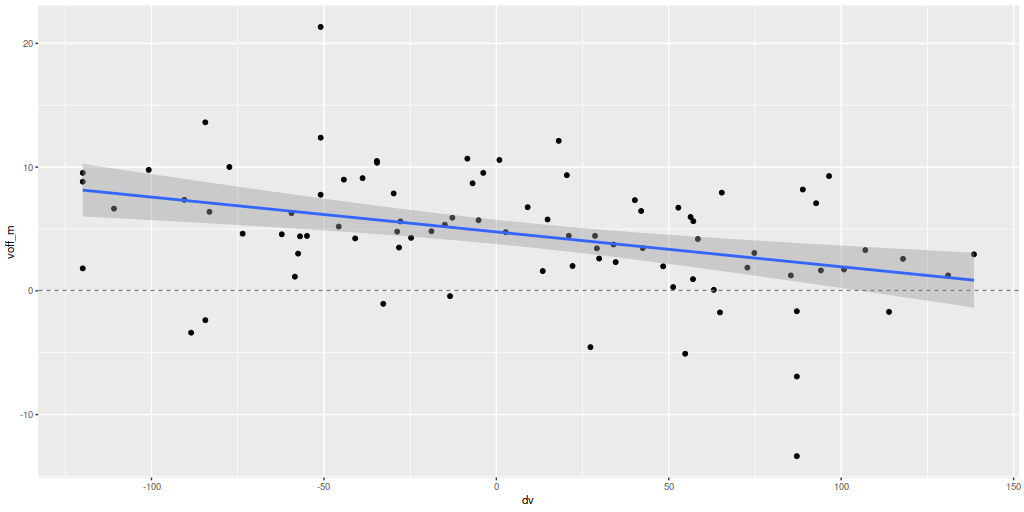
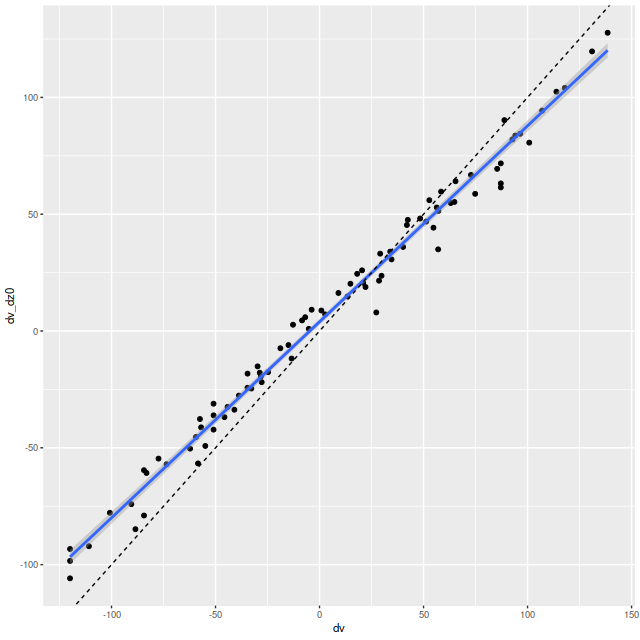
Next, here are the posterior mean velocity offsets for all 86 spectra in the Voronoi binned data, plotted against the peculiar velocity calculated as outlined above. The overall average of the mean velocity offsets is 4.6 km/sec. The reason for the apparent tilt in the relationship still needs investigation.

Mean velocity offset vs. peculiar velocity. All NGC 4949 spectra.

Exercise 2: calculate the LOSVD with wavelengths adjusted to the overall system redshift as taken from the NSA catalog, that is no adjustment is made for peculiar redshifts due to rotation. For this exercise I increased the kernel size to 17 elements. This is actually a little more than needed since the projected rotation velocities range over ≈ ± 100 km/sec. First, here is the radial velocity map:

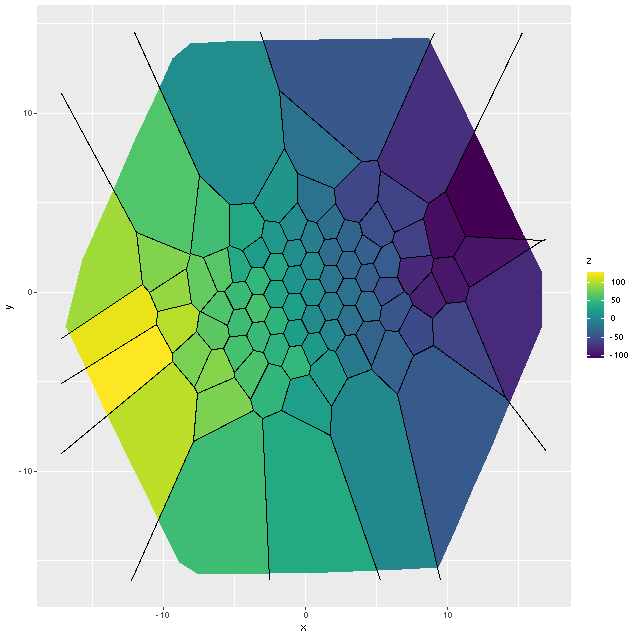
Radial velocity map from Bayesian LOSVD model with no peculiar redshifts assigned.
Here’s a scatterplot of the velocity offsets against peculiar velocities from my normal workflow. Again there’s a slight tilt away from a slope of 1 evident. The residual standard error around the simple regression line is 6.4 km/sec and the intercept is 4 km/sec, which are consistent with the results from the first set of LOSVD models.

Velocity offsets from Bayesian LOSVD models vs. peculiar velocities

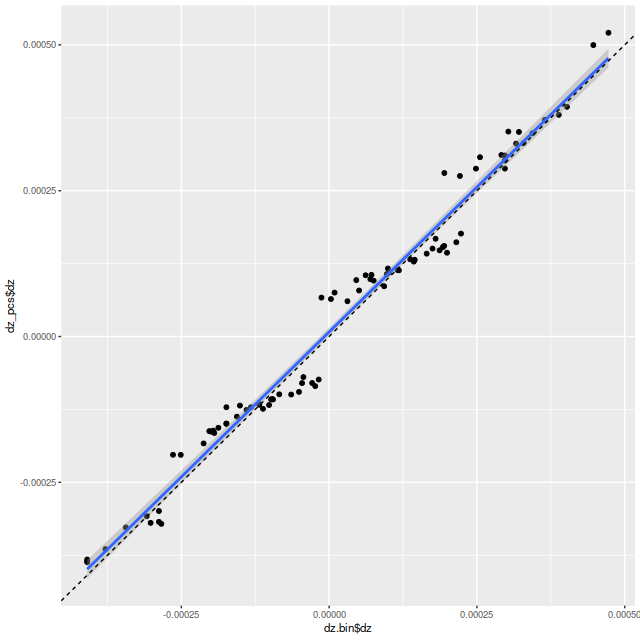
Exercise 3: calculate redshift offsets using a set of (for this exercise, 6) eigenspectra from the SSP templates. Here is a scatterplot of the results plotted against the redshift offsets from my usual empirically derived eigenspectra. Why the odd little jumps? I’m not completely sure, but my current code does an initial grid search to try to isolate the global maximum likelihood, which is then found with a general purpose nonlinear minimizer. The default grid size is 10-4, about the size of the gaps. Perhaps it’s time to revisit my search strategy.

Redshift offsets from a set of SSP derived eigenspectra vs. the same routine using my usual set of empirically derived eigenspectra.

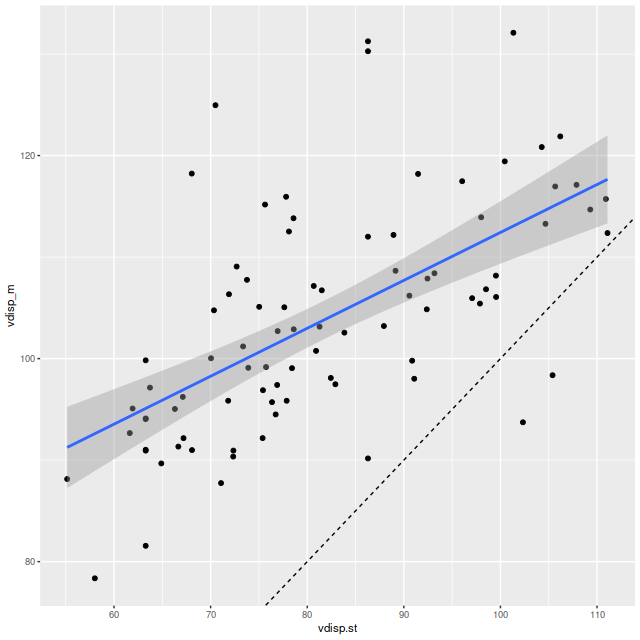
Final topic for now: I mentioned in the last post that posterior velocity dispersions (measured by the standard deviation of the LOSVD) were only weakly correlated with the stellar velocity dispersions that I calculate as part of my standard workflow. With the correction to my code the correlation while still weak has greatly improved, but the dispersions are generally higher:

Velocity dispersion form Bayesian LOSVD models vs. stellar velocity dispersion from maximum likelihood fits.

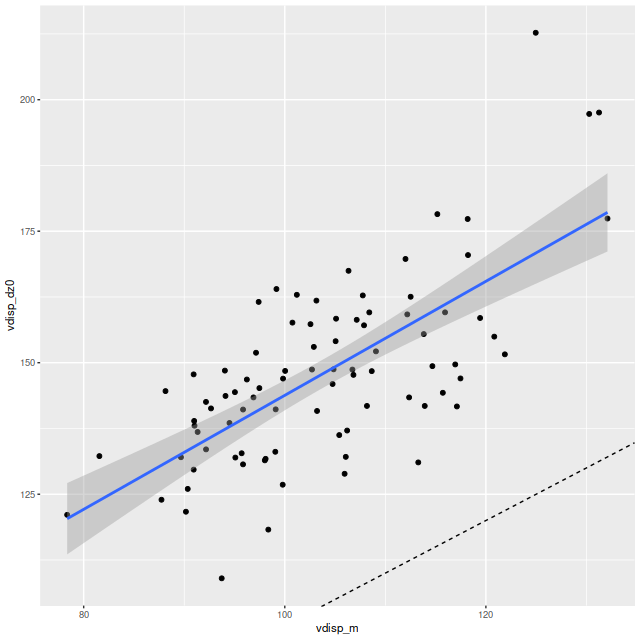
A similar trend is seen when I plot the velocity dispersions from the LOSVD models with correction only for the system redshift and a wider convolution kernel (exercise 2 above) with the fully corrected model runs (exercise 1):

These results hint that the diffuse prior on the convolution kernel is responsible for the different results. As part of the maximum likelihood fitting process I estimate the standard deviation of the stellar velocity distribution assuming it to be a single component gaussian. While the distribution of kernel values in the first graph look pretty symmetrical the tails are on average heavier than a gaussian. This can be seen too in the LOSVD models with the larger convolution kernel of exercise 2. The tails have non-negligible values all the way out to the ends:

Now, what I’m really interested in are model star formation histories. I’ve been using pre-convolved SSP model templates from the beginning along with phony emission line spectra with gaussian profiles with some apparent success. My plan right now is to continue that program with these non-parametric LOSVD’s. The convolutions could be carried out with posterior means of the kernel values or by drawing samples. Repeated runs could be used to estimate how much variation is affected by uncertainty in the kernel.

How to handle emission lines is another problem. For now stepping back to a simpler model (no emission, no dust) would be reasonable for this Coma sample.

Using Galaxy Zoo classifications to select MaNGA samples

A while back I came across a paper by Fraser-McKelvie et al. (2020, arxiv id 2009.07859) that used Galaxy Zoo classifications to select a sample of barred spiral galaxies with MaNGA observations. This was a followup to a paper by Peterken et al. (2020, arxiv id 2005.03012) that also used Galaxy Zoo classifications to select a parent sample of spiral galaxies (barred and otherwise). There’s nothing new about using GZ classifications for sample selection of course, although these papers are somewhat notable for going farther down the decision tree than usual. What was new to me though when I decided to get my own samples is the SDSS CasJobs database now has a table named mangaGalaxyZoo containing GZ classifications for (I guess) all MaNGA galaxies. The classifications come from the Galaxy Zoo 2 database supplemented with some followup campaigns to fill in the gaps in GZ2. Besides greater completeness than the zoo2* database tables that can also be queried in CasJobs this table contains the newer vote fraction debiasing procedure described in Hart et al. (2016). It’s also much faster to query because it’s indexed on mangaid. When I put together the sample of MaNGA disk galaxies that I’ve posted about several times I took a somewhat indirect approach of looking for SDSS spectroscopic objects close to IFU centers and joining those with classifications in the zoo2MainSpecz table. The query I wrote took about 3 1/2 hours to execute, whereas the ones shown below required no more than a second.
Pasted below are the complete SQL queries, and below the fold are lists of the positions and plateifu IDs of the samples suitable for copying and pasting into the SDSS image list tool. These queries run in the DR16 “context” produced 287 and 272 hits respectively, with 285 unique galaxies in the barred sample and 263 uniques in the non-barred. These numbers are a little different than in the two papers referenced at the top. Fraser-McKelvie ended up with 245 galaxies in their barred sample — most of the difference appears to be due to me selecting from both the primary and secondary MaNGA samples, while they only used the “Primary+” sample (which presumably include the primary and “color enhanced” subsamples). I also did not make any exclusions based on the drp3qual value although I did record it. The total sample size of 548 galaxies is considerably smaller than the parent sample from Peterken, which was either 795 or 798 depending on which paper you consult. The main reason for that is probably that Peterken’s parent sample includes all bar classifications while I excluded galaxies with debiased f_bar levels > 0.2 in my bar-less sample. My barred fraction of around 52% is closer to guesstimates in the literature.

Both samples contain at least a few false positives, as is usual, but there are only one or two gross misclassifications. One that was especially obvious in the barred sample was this early type galaxy, which clearly has neither a bar or spiral structure and at least qualitatively has a brightness profile more characteristic of an elliptical. Oddly, the zoo2MainSpecZ entry for this object has a completely different set of classifications — the debiased vote fraction for “smooth” was 84%, so most volunteers agreed with me. This suggests maybe a misidentification in the mangaGalaxyZoo data.

CGCG 238-030. Not a barred spiral.

Besides this really obvious case I found a few with apparent inner rings or lenses, and a few galaxies in both samples appear to me to be lenticulars with no clear spiral structure. The first of the two below again has a completely different set of classifications in zoo2MainSpecZ than in the MaNGA table.

Again, not a barred spiral.
Lenticular?

Although I didn’t venture to count them a fair number of galaxies in the non-barred sample do appear to have short and varyingly obvious bars. Of course the query didn’t exclude objects with some bar votes — presumably higher purity could be achieved by lowering the threshold for exclusion. And again, there are a few lenticulars in the spiral sample. As my sadly departed friend Jean Tate often commented the galaxy zoo decision tree doesn’t lend itself very well to identifying lenticulars.

IC 2227. Maybe a short bar?
UGC 10381. Classified as S0/a in RC3

Unfortunately I have nothing useful to say about Fraser-Mckelvie’s main research topic, which was to decide if, and perhaps why, barred spirals have lower star formation rates than otherwise similar non-barred ones. 500+ galaxies are far more than I can analyze with my computing resources. Perhaps a really high purity sample would be manageable. I may post an individual example or two anyway. The MaNGA view of grand design spirals in particular can be quite striking.

select into gzbars
  m.mangaid,
  m.plateifu,
  m.plate,
  m.objra,
  m.objdec,
  m.ifura,
  m.ifudec,
  m.mngtarg1,
  m.drp3qual,
  m.nsa_z,
  m.nsa_zdist,
  m.nsa_elpetro_mass,
  m.nsa_elpetro_phi,
  m.nsa_elpetro_ba,
  m.nsa_elpetro_th50_r,
  m.nsa_sersic_n,
  gz.survey,
  gz.t01_smooth_or_features_count as count_features,
  gz.t01_smooth_or_features_a02_features_or_disk_debiased as f_disk,
  gz.t03_bar_count as count_bar,
  gz.t03_bar_a06_bar_debiased as f_bar,
  gz.t04_spiral_count as count_spiral,
  gz.t04_spiral_a08_spiral_debiased as f_spiral,
  gz.t06_odd_count as count_odd,
  gz.t06_odd_a15_no_debiased as f_notodd
from mangaDrpAll m
join mangaGalaxyZoo gz on gz.mangaid = m.mangaid
where
  m.mngtarg2=0 and
  gz.t04_spiral_count >= 20 and
  gz.t03_bar_count >= 20 and
  gz.t01_smooth_or_features_a02_features_or_disk_debiased > 0.43 and
  gz.t03_bar_a06_bar_debiased >= 0.5 and
  gz.t04_spiral_a08_spiral_debiased > 0.8 and
  gz.t06_odd_a15_no_debiased > 0.5 and
  m.nsa_elpetro_ba >= 0.5 and
  m.mngtarg1 >= 1024 and
  m.mngtarg1 < 8192
order by m.plateifu

select into gzspirals
  m.mangaid,
  m.plateifu,
  m.plate,
  m.objra,
  m.objdec,
  m.ifura,
  m.ifudec,
  m.mngtarg1,
  m.drp3qual,
  m.nsa_z,
  m.nsa_zdist,
  m.nsa_elpetro_mass,
  m.nsa_elpetro_phi,
  m.nsa_elpetro_ba,
  m.nsa_elpetro_th50_r,
  m.nsa_sersic_n,
  gz.survey,
  gz.t01_smooth_or_features_count as count_features,
  gz.t01_smooth_or_features_a02_features_or_disk_debiased as f_disk,
  gz.t03_bar_count as count_bar,
  gz.t03_bar_a06_bar_debiased as f_bar,
  gz.t04_spiral_count as count_spiral,
  gz.t04_spiral_a08_spiral_debiased as f_spiral,
  gz.t06_odd_count as count_odd,
  gz.t06_odd_a15_no_debiased as f_notodd
from mangaDrpAll m
join mangaGalaxyZoo gz on gz.mangaid = m.mangaid
where
  m.mngtarg2=0 and
  gz.t04_spiral_count >= 20 and
  gz.t03_bar_count >= 20 and
  gz.t01_smooth_or_features_a02_features_or_disk_debiased > 0.43 and
  gz.t03_bar_a06_bar_debiased <= 0.2 and
  gz.t04_spiral_a08_spiral_debiased > 0.8 and
  gz.t06_odd_a15_no_debiased > 0.5 and
  m.nsa_elpetro_ba >= 0.5 and
  m.mngtarg1 >= 1024 and
  m.mngtarg1 < 8192
order by m.plateifu

Continue reading “Using Galaxy Zoo classifications to select MaNGA samples”

First complete model run with modified attenuation curve

Here’s an SDSS finder chart image of one of the two grand design spirals that found its way into my “transitional” galaxy sample:

Central galaxy: Mangaid 1-382712 (plateifu 9491-6101), aka CGCG 088-005

and here’s a zoomed in thumbnail with IFU footprint:

plateifu 9491-6101 IFU footprint

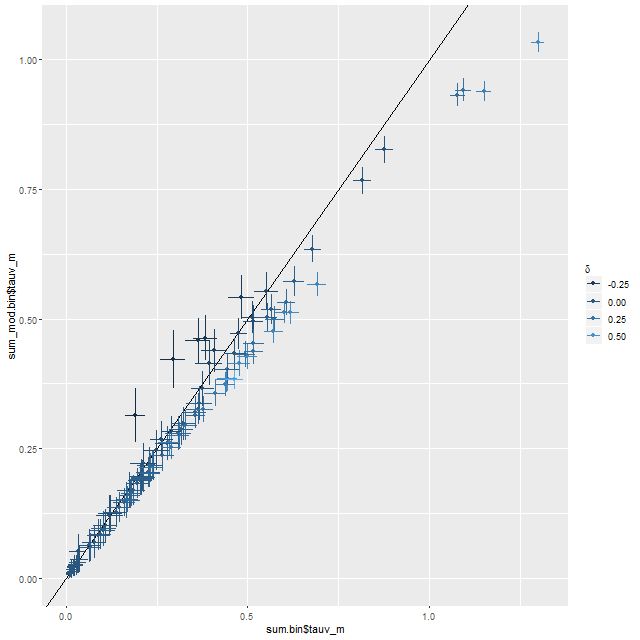
This galaxy is in a compact group and slightly tidally distorted by interaction with its neighbors, but is otherwise a fairly normal star forming system. I picked it because I had a recent set of model runs and because it binned to a manageable but not too small number of spectra (112). The fits to the data in the first set of model runs were good and the (likely) AGN doesn’t have broad lines. Here are a few selected results from the set of model runs using the modified Calzetti attenuation relation on the same binned spectra. First, using a tight prior on the slope parameter δ had the desired effect of returning the prior for δ when τ was near zero, while the marginal posterior for τ was essentially unchanged:

9491-6101_tauv_calzetti_mod
Estimated optical depth for modified Calzetti attenuation vs. unmodified. MaNGA plateifu 9491-6101

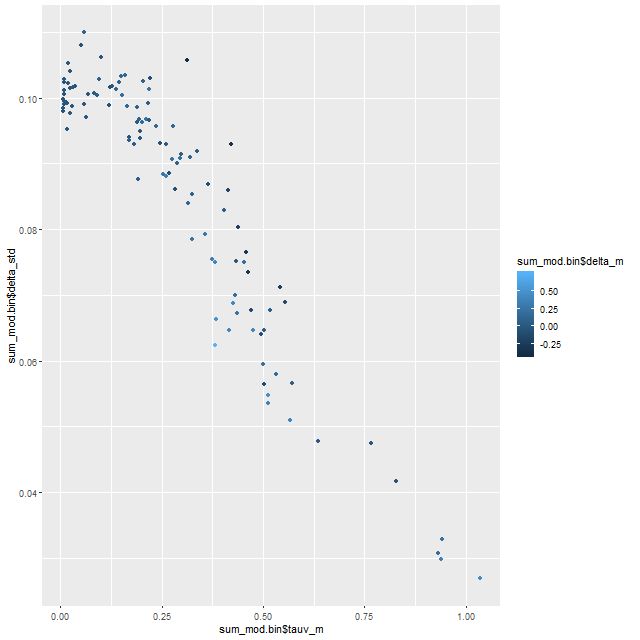
At larger optical depths the data do constrain both the shape of the attenuation curve and optical depth. At low optical depth the posterior uncertainty in δ is about the same as the prior, while it decreases more or less monotonically for higher values of τ. A range of (posterior mean) values of δ from slightly shallower than a Calzetti relation to somewhat steeper. The general trend is toward a steeper relation with lower optical depth in the dustier regions (per the models) of the galaxy.

9491-6101_tauv_delta_std
Posterior marginal standard deviation of parameter δ vs. posterior mean optical depth. MaNGA plateifu 9491-6101

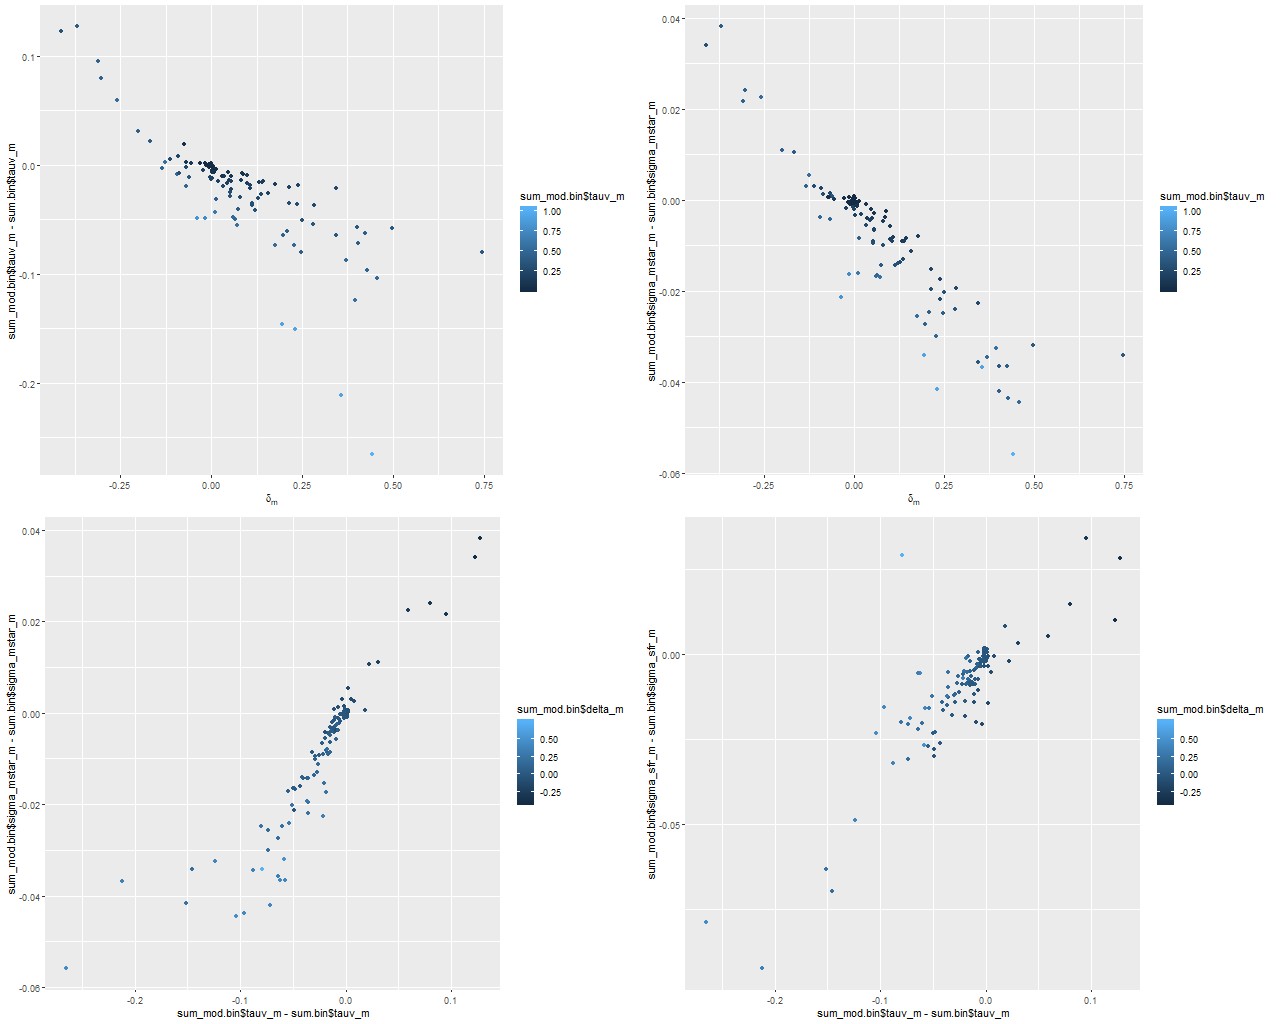
There’s an interesting pattern of correlations1astronmers like to call these “degeneracies,” and it’s fairly well known that they exist among attenuation, stellar age, stellar mass, and other properties here, some of which are summarized in the sequence of plots below. The main result is that a steeper (shallower) attenuation curve requires a smaller (larger) optical depth to create a fixed amount of reddening, so there’s a negative correlation between the slope parameter δ and the change in optical depth between the modified and unmodified curves. A lower optical depth means that a smaller amount of unattenuated light, and therefore lower stellar mass, is needed to produce a given observed flux. so there’s a negative correlation between the slope parameter and stellar mass density or a positive correlation between optical depth and stellar mass. The star formation rate density is correlated in the same sense but slightly weaker. In this data set both changed by less than about ± 0.05 dex.

(TL) change in optical depth (modified – unmodified calzetti) vs. slope parameter δ
(TR) change in stellar mass density vs. δ
(BL) change in stellar mass density vs. change in optical depth
(BR) change in SFR density vs change in optical depth Note: all quantities are marginal posterior mean estimagtes.

Here are a few relationships that I’ve shown previously. First between stellar mass and star formation rate density. The points with error bars (which are 95% marginal credible limits) are from the modified Calzetti run, while the red points are from the original. Regions with small stellar mass density and low star formation rate have small attenuation as well in this system, so the estimates hardly differ at all. Only at the high end are differences about as large as the nominal uncertainties.

SFR density vs. stellar mass density. Red points are point estimates for unmodified Calzetti attenuation. MaNGA plateifu 9491-6101

Finally, here is the relation between Hα luminosity density and star formation rate with the former corrected for attenuation using the Balmer decrement. The straight line is, once again, the calibration of Moustakas et al. Allowing the shape of the attenuation curve to vary has a larger effect on the luminosity correction than it does on the SFR estimates, but both sets of estimates straddle the line with roughly equal scatter.

9491-6101_sigma_ha_sfr_mod
SFR density vs. Hα luminosity density. Red points are point estimates for unmodified Calzetti attenuation. MaNGA plateifu 9491-6101

To conclude for now, adding the more flexible attenuation prescription proposed by Salim et al. has some quantitative effects on model posteriors, but so far at least qualitative inferences aren’t significantly affected. I haven’t yet looked in detail at star formation histories or at effects on metallicity or metallicity evolution. I’ve been skeptical that SFH modeling constrains stellar metallicity or (especially) metallicity evolution well, but perhaps it’s time to take another look.

Markarian 848

This galaxy1also known as VV705, IZw 107, IRAS F15163+4255, among others has been my feature image since I started this blog. Why is that besides that it’s kind of cool looking? As I’ve mentioned before I took a shot a few years ago at selecting a sample of “transitional” galaxies from the SDSS spectroscopic sample, that is ones that may be in the process of rapidly shutting down star formation2See for example Alatalo et al. (2017) for recent usage of this terminology.. I based the selection on a combination of strong Hδ absorption and either weak emission lines or line ratios other than pure starforming, using measurements from the MPA-JHU pipeline. This galaxy pair made the sample based on the spectrum centered on the northern nucleus (there is also a spectrum of the southern nucleus from the BOSS spectrograph, but no MPA pipeline measurements). Well now, these galaxies are certainly transitioning to something, but they’re probably not shutting down star formation just yet. Simulations of gas rich mergers generally predict a starburst that peaks around the time of final coalescence. There is also significant current star formation, as high as 100-200 \(M_\odot/yr\) per various literature estimates, although it is mostly hidden. So on the face of it at least this appears to be a false positive. This was also an early MaNGA target, and one of a small number where both nuclei of an ongoing merger are covered by a single IFU:

Markarian 848. SDSS image thumbnail with MaNGA IFU footprint.

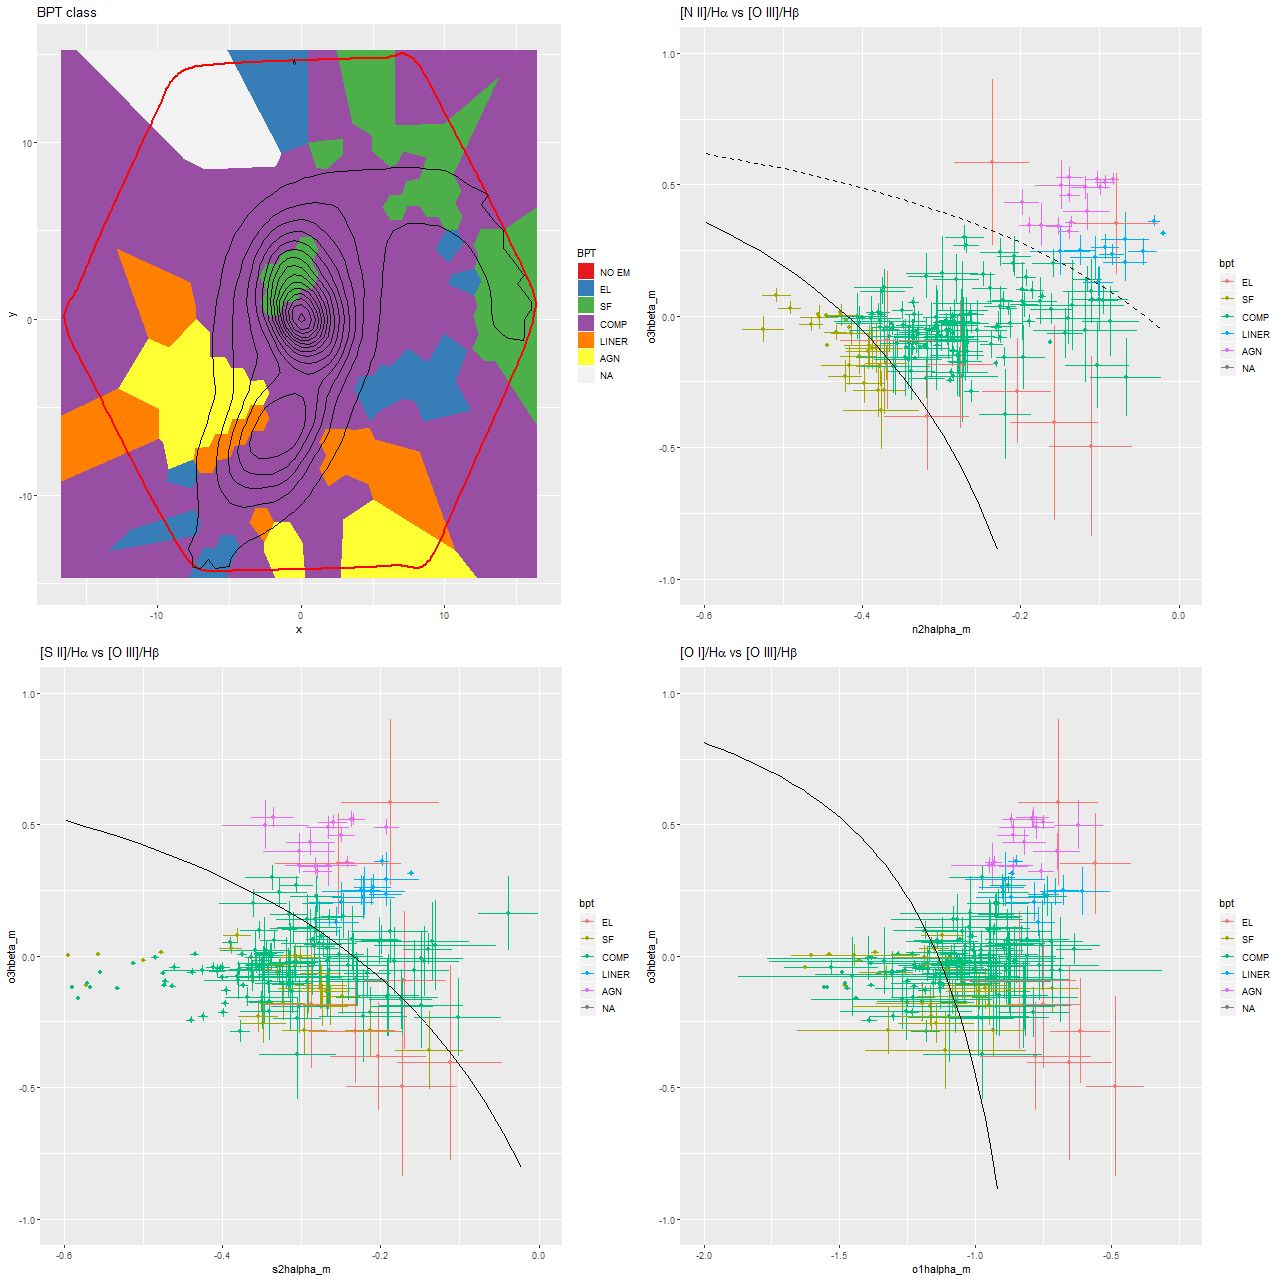
Today I’m going to look at a few results of my analysis of the IFU data that aren’t too model dependent to get some insight into why this system was selected. As usual I’m looking at the stacked RSS data rather than the data cubes, and for this exercise I Voronoi binned the spectra to a very low target SNR of 6.25. This leaves most of the fibers unbinned in the vicinity of the two nuclei. First, here is a map of BPT classification based on the [O III]/Hβ vs. [N II]/Hα diagnostic as well as scatterplots of several BPT diagnostics. Unfortunately the software I use for visualizing binned maps extends the bins out to the edge of the bounding rectangle rather than the hexagonally shaped edge of the data, which is outlined in red. Also note that different color coding is used for the scatter plots than the map. The contour lines in the map are arbitrarily spaced isophotes of the synthesized R band image supplied with the data cube.

Map of BPT class determined from [O III]/Hβ vs. [N II}/Hα diagnostic diagram, and BPT diagnostics for [N II], [S II] and [O I]. Curves are boundary lines form Kewley et al. (2006).

What’s immediately obvious is that most of the area covered by the IFU including both nuclei fall in the so-called “composite” region of the [N II]/Hα BPT diagram. This gets me back to something I’ve complained about previously. There was never a clear physical justification for the composite designation (which recall was first proposed in Kauffmann et al. 2003), and the upper demarcation line between “pure” AGN and composite systems as shown in the graph at upper right was especially questionable. It’s now known if it wasn’t at the turn of the century (which I doubt is the case) that a number of ionization mechanisms can produce line ratios that fall generally in the composite/LINER regions of BPT diagnostics. Shocks in particular are important in ongoing mergers. High velocity outflow of both ionized and neutral gas have been observed in the northern nucleus by Rupke and Veillux (2013), which they attributed to supernova driven winds.

The evidence for AGN in either nucleus is somewhat ambiguous. Fu et al. (2018) called this system a binary AGN, but that was based on the “composite” BPT line ratios from the same MaNGA data as we are examining (their map, by the way, is nearly identical to mine; see also Yuan et al. 2018). By contrast Vega et al. 2008 were able to fit the entire SED from NIR to radio frequencies with a pure starburst model and no AGN contribution at all, while more recently Dietrich et al. 2018 estimated the AGN fraction to be around 0.25 from NIR to FIR SED fitting. A similar conclusion that both nuclei contain both a starburst and AGN component was reached by Vardoulaki et al. 2015 based on radio and NIR data. One thing I haven’t seen commented on in the MaNGA data that possibly supports the idea that the southern nucleus harbors an AGN is that the regions with unambiguous AGN-like optical emission line ratios are fairly symmetrically located on either side of the southern nucleus and separated from it by ∼1-2 kpc. This could perhaps indicate the AGN is obscured from our view but visible from other angles.

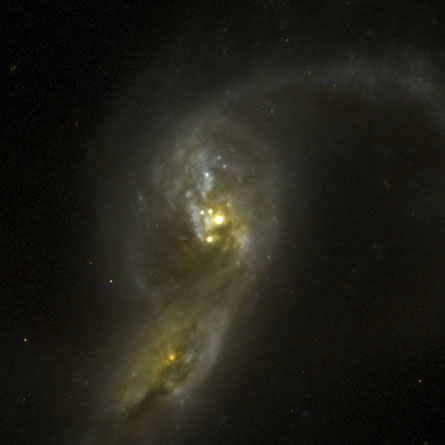
There are also several areas with starforming emission line ratios just to the north and east of the northern nucleus and scattered along the northern tidal tail (the southern tail is largely outside the IFU footprint). In the cutout below taken from a false color composite of the F435W+F814W ACS images several bright star clusters can be seen just outside the more heavily obscured nuclear region, and these are likely sources of ionizing photons.

mrk_848_hst_crop
Markarian 848 nuclei. Cutout from HST ACS F814W+F435W images.

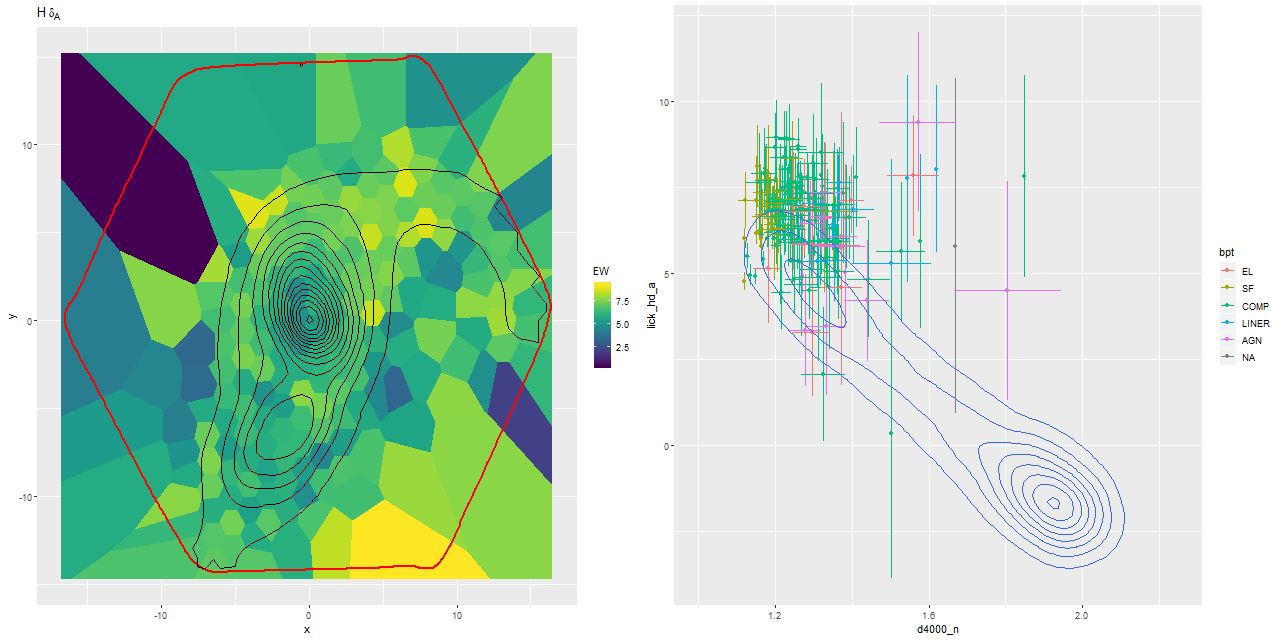
Finally turning to the other component of the selection criteria, here is a map of the (pseudo) Lick HδA index and a plot of the widely used HδA vs Dn(4000) diagnostic. It’s a little hard to see a clear pattern in the map because this is a rather noisy index, but strong Balmer absorption is seen pretty much throughout, with the highest values outside the two nuclei and especially along the northern tidal tail.

Location in the Hδ – D4000 plane doesn’t uniquely constrain the star formation history, but the contour plot taken from a largish sample of SDSS spectra from the NGP is clearly bimodal, with mostly starforming galaxies at upper left and passively evolving ones at lower right, with a long “green valley” in between. Simple models of post-starburst galaxies will loop upwards and to the right in this plane as the starburst ages before fading towards the green valley. This is exactly where most of points in this diagram lie, which certainly suggests an interesting recent star formation history.

mrk848_hda_d4000
(L) Map of HδA index. (R) HδA vs Dn(4000) index. Contours are for a sample of SDSS spectra from the north galactic pole.

I’m going to end with a bit of speculation. In simulations of gas rich major mergers the progenitors generally complete 2 or 3 orbits before final coalescence, with some enhancement of star formation during the perigalactic passages and perhaps some ebbing in between. This process plays out over hundreds of Myr to some Gyr. What I think we are seeing now is the 2nd or third encounter of this pair, with the previous encounters having left an imprint in the star formation history.

I’ve done SFH modeling for this binning of the data, and also for data binned to higher SNR and modeled with higher time resolution models. Next post I’ll look at these in more detail.

Revisiting the Baryonic Tully-Fisher relation… – Part 3

This post has been languishing in draft form for well over a month thanks to travel and me losing interest in the subject. I’m going to try to get it out of the way quickly and move on.

Last time I noted the presence of apparent outliers in the relationship between stellar mass and rotation velocity and pointed out that most of them are due to model failures of various sorts rather than “cosmic variance.” That would seem to suggest the need for some sample refinement, and the question then becomes how to trim the sample in a way that’s reproducible.

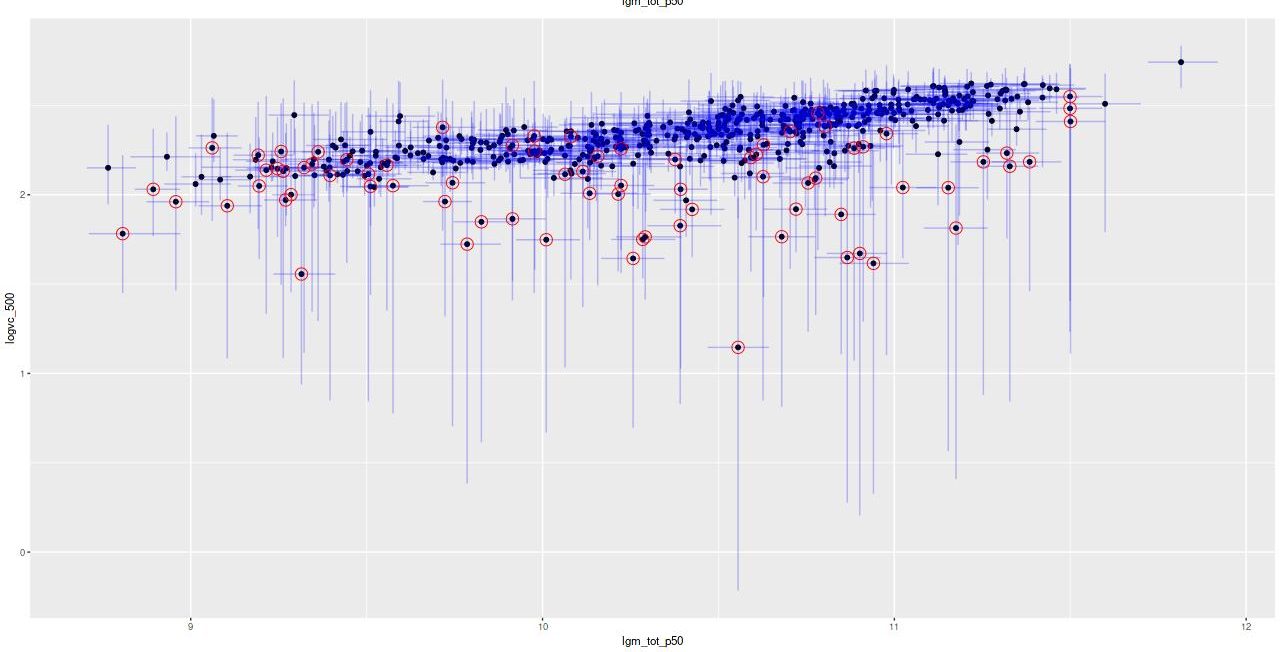
An obvious comment is that all of the outliers fall below the general trend and (less obviously perhaps) most have very large posterior uncertainties as well. This suggests a simple selection criterion: remove the measurements which have a small ratio of posterior mean to posterior standard deviation of rotation velocity. Using the asymptotic circular velocity v_c in the atan mean function and setting the threshold to 3 standard deviations the sample members that are selected for removal are circled in red below. This is certainly effective at removing outliers but it’s a little too indiscriminate — a number of points that closely follow the trend are selected for removal and in particular 19 out of 52 points with stellar masses less than \(10^{9.5} M_\odot\) are selected. But, let’s look at the results for this trimmed sample.

lgm_logvc_circled_bad_2ways
Posterior distribution of asymptotic velocity `v_c` vs stellar mass. Circled points have posterior mean(v_c)/sd(v_c) < 3.

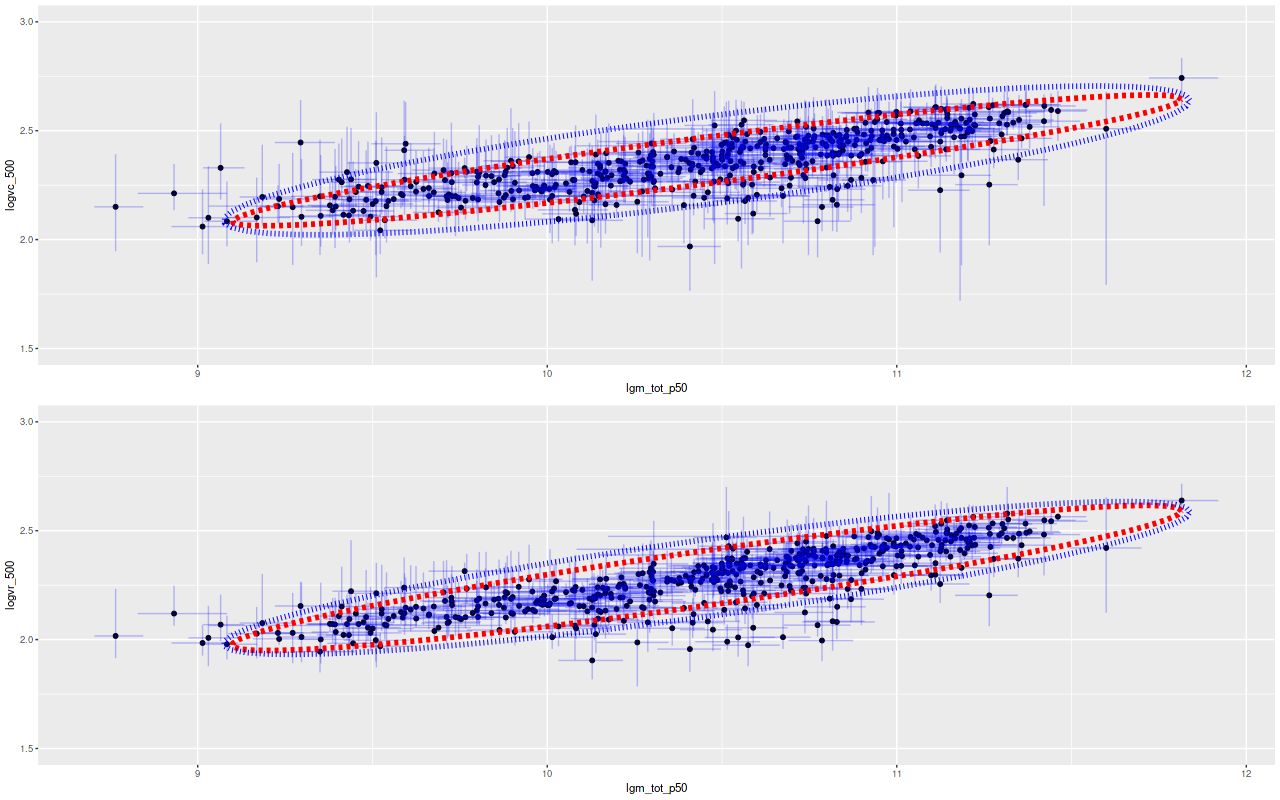
Again I model the joint relationship between mass and circular velocity using my Stan implementation of Bovy, Hogg, and Roweis’s “Extreme deconvolution” with the simplification of assuming gaussian errors in both variables. The results are shown below for both circular velocity fiducials. Recall from my previous post on this subject the dotted red ellipse is a 95% joint confidence interval for the intrinsic relationship while the outer blue one is a 95% confidence ellipse for repeated measurements. Compared to the first time I performed this exercise the former ellipse is “fatter,” indicating more “cosmic variance” than was inferred from the earlier model. I attribute this to a better and more flexible model. Notice also the confidence region for repeated measurements is tighter than previously, reflecting tighter error bars for model posteriors.

tf_subset1
Joint distribution of stellar mass and velocity by “Extreme deconvolution.” Inner ellipse: 95% joint confidence region for the intrinsic relationship. Outer ellipse: 95% confidence ellipse for new data. Top: Asymptotic circular velocity v_c. Bottom: Circular velocity at 1.5 r_eff.

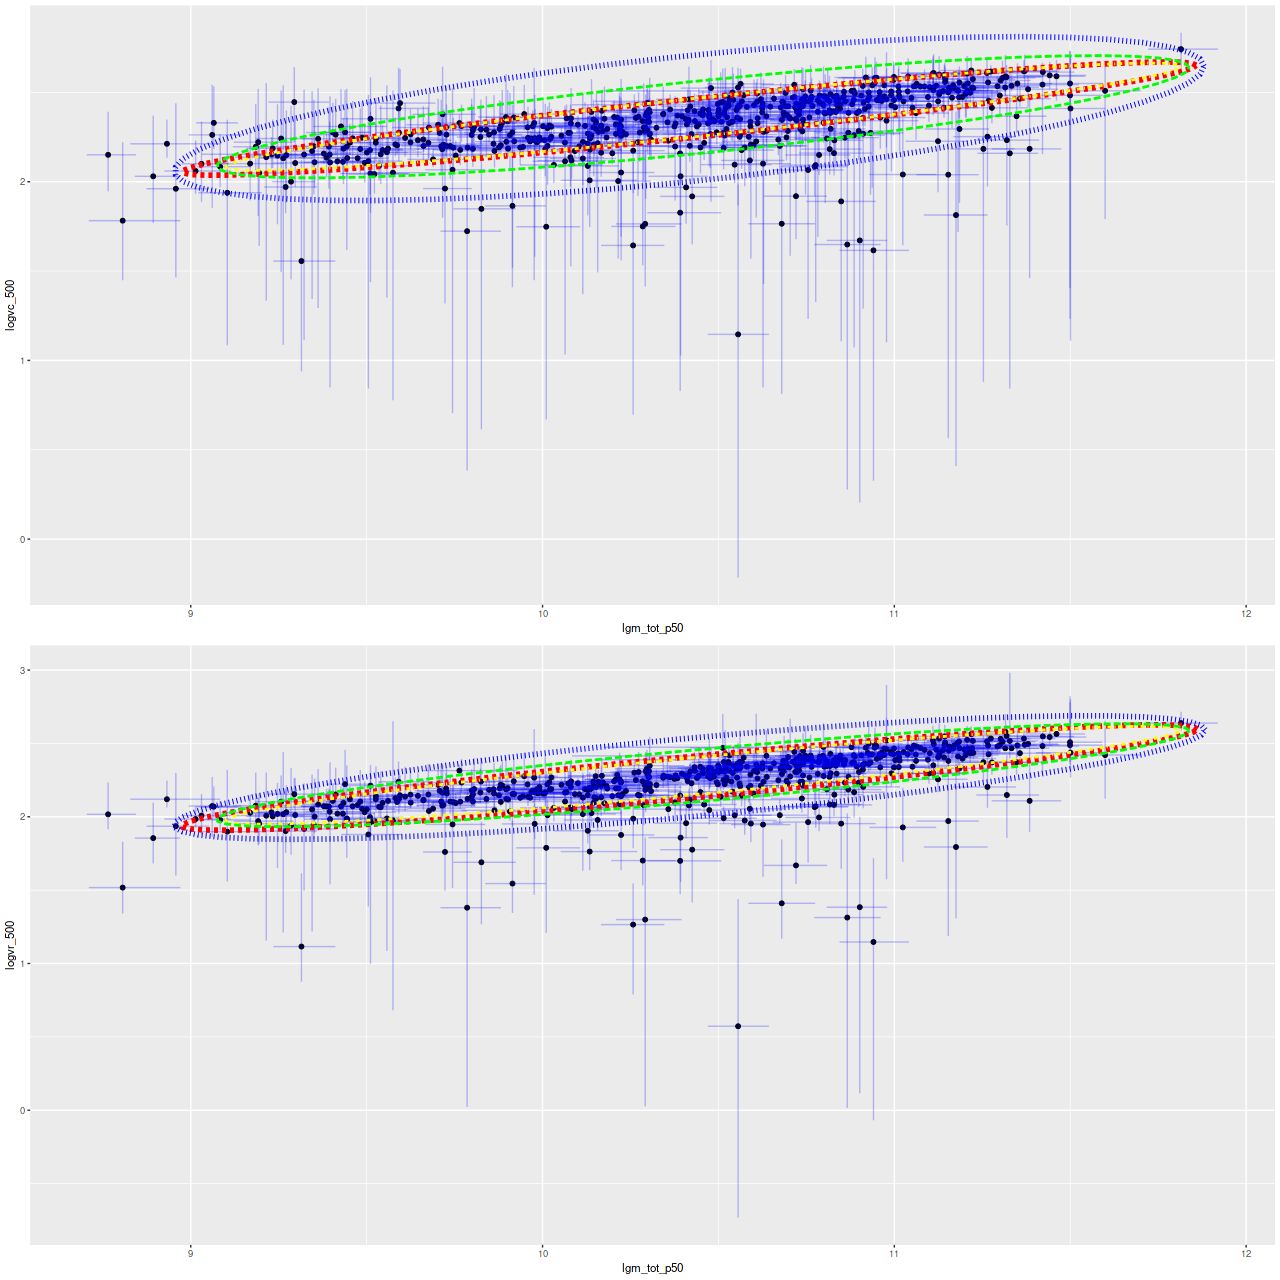
Now here is something of a surprise: below are the model results for the full sample compared to the trimmed one. The red and yellow ellipses are the estimated intrinsic relations using the full and trimmed samples, while green and blue are for repeated measurements. The estimated intrinsic relationships are nearly identical despite the many outliers. So, even though this model wasn’t formulated to be “robust” as the term is usually understood in statistics in practice it is, at least as regards to the important inferences in this application.

tf_alldr15
Joint distribution of stellar mass and velocity by “Extreme deconvolution” (complete sample). Inner ellipse: 95% joint confidence region for the intrinsic relationship. Outer ellipse: 95% confidence ellipse for new data. Top: Asymptotic circular velocity v_c. Bottom: Circular velocity at 1.5 r_eff.

Finally the slope, that is the exponent in the stellar mass Tully-Fisher relationship \(M^* \sim V_{rot}^\gamma\) is estimated as the (inverse of) slope of the major axis of the inner ellipses in the above plots. The posterior mean and 95% marginal confidence intervals for the two velocity measures and both samples are:

v_c (subset 1) \(4.81^{+0.28}_{-0.25}\)

v_c (all) \(4.81^{+0.28}_{-0.25}\)

v_r (subset 1) \(4.36^{+0.23}_{-0.20}\)

v_r (all) \(4.33^{+0.23}_{-0.21}\)

Does this suggest some tension with the value of 4 determined by McGaugh et al. (2000)? Not necessarily. For one thing this is properly an estimate of the stellar mass – velocity relationship, not the baryonic one. Generally lower stellar mass galaxies will have higher gas fractions than high stellar mass ones, so a proper accounting for that would shift the slope towards lower values. Also, and as can be seen here, both the choice of fiducial velocity and analysis method matter. This has been discussed recently in some detail by Lelli et al. (2019)1These two papers have two authors in common..

Next time, back to star formation history modeling.

Revisiting the Baryonic Tully-Fisher relation… – Part 2

Last time I left off with the remark that while most of the sample of disk galaxies clearly exhibits a tight relationship between circular velocity and stellar mass, there are some apparent outliers as well. While some “cosmic variance” is expected most of the apparent outliers are due to model failures, which have several possible causes:

  1. Violation of the physical assumptions of the model, namely that the stars and gas are rotating (together) in the plane of a thin disk that’s moderately inclined to our line of sight (see my original post on this topic).
  2. Errors in the photometry. I use two photometric quantities (specifically nsa_elpetro_ba and nsa_elpetro_phi) from the MaNGA DRPALL catalog to set priors for the kinematic parameters cos_i and phi(cosine of the disk inclination and angle to receding side) and also to initialize the sampler. Since proper and in practice fairly informative priors are required for these parameters errors here will propagate into the models, sometimes in ways that are fatal. I’ll look in more detail at some examples below.
  3. Bad velocity data.
  4. Not enough data.
  5. Sampler convergence failures with no obvious cause.

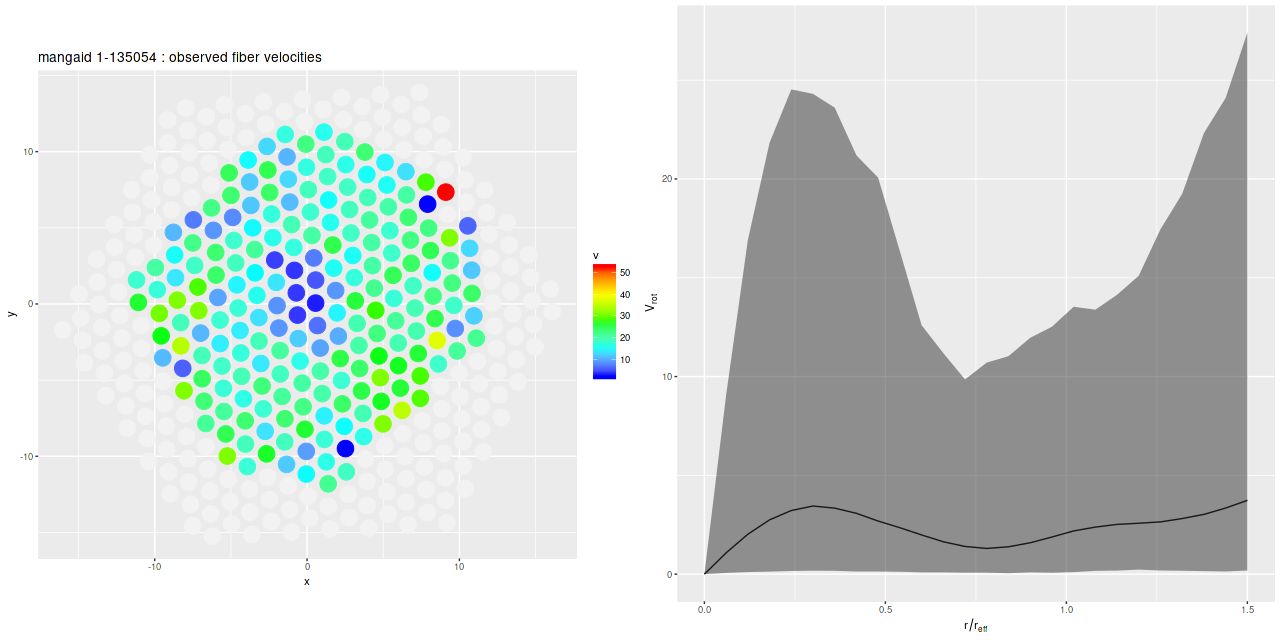
The first two bullet points are closely related: most of the failures to satisfy the physical assumptions are directly related to errors in the photometric decompositions. One fairly common failure was galaxies that were too nearly face on to obtain reliable rotation curves. As an example here is the galaxy with the lowest estimated rotation velocity in the sample, mangaid 1-135054 (plateifu 8550-12703):

8550-12703_vf_vrot
Mangaid 1-135054 (plateifu 8550-12703). (L) Measured velocity field and (R) posterior predictive estimate of circular velocity with 95% confidence band.

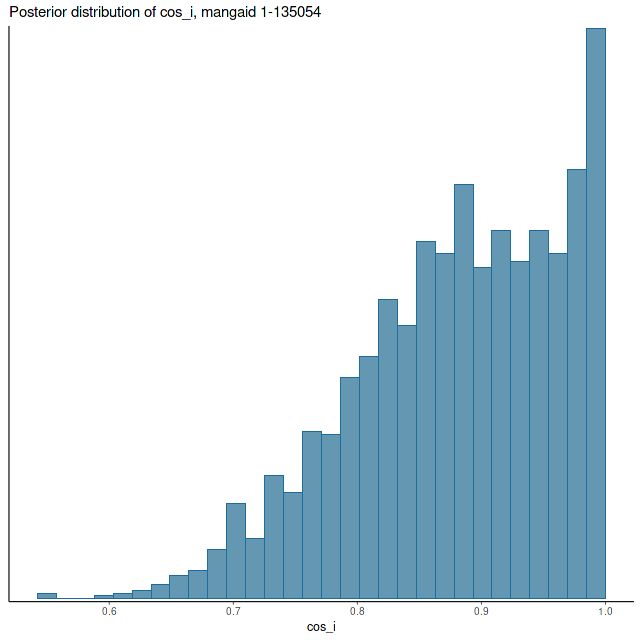
Besides showing no sign of rotation the velocity field hints at possible large scale, low velocity outflow in the central region. There are also a few apparent outliers, although these had little effect on model results. Fortunately the model output gives us plenty of clues that the results shouldn’t be trusted. The median circular velocity estimate is unrealistically low with very large posterior uncertainty (above right), while the posterior marginal density for cos_ihas a mode near 1 and also very large uncertainty (below).

8550-12703_post_cosi
Mangaid 1-135054 (plateifu 8550-12703). Posterior distribution of cosine of disk inclination.

Zooming out a bit on SDSS imaging gives a likely explanation for the peculiar velocity field. The elliptical galaxy just to the NW has nearly the same redshift (the velocity difference is ∼75 km/sec) and is almost certainly interacting with our target.

MaNGA target and companion; credit SDSS

A key assumption in using photometric properties as proxies for kinematic quantities is that disk galaxies have intrinsically circular surface brightness profiles. This is never quite the case in practice and sometimes morphological features like strong bars can make this assumption catastrophically wrong. Here was perhaps the most extreme example in DR14:

mangaid 1-185287 (plateifu 8252-12704). SDSS thumbnail with IFU overlay
8252-12704_vf
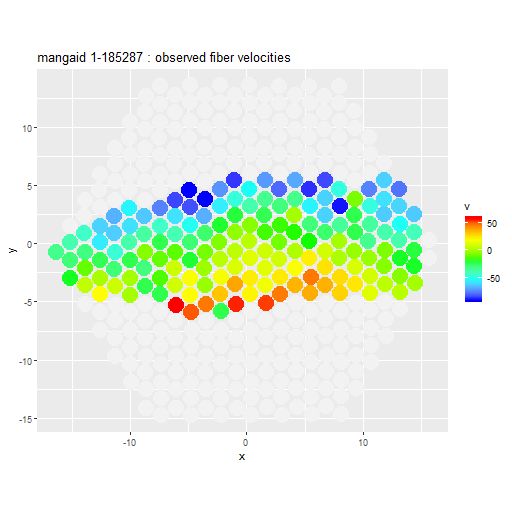
mangaid 1-185287 (plateifu 8252-12704) Measured velocity field from stacked RSS spectra

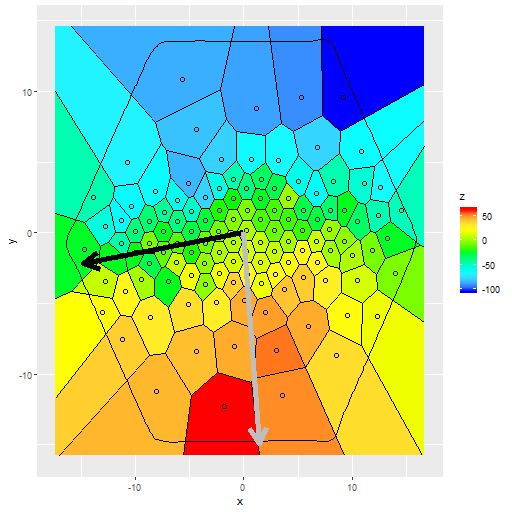
The photometric major axis angle was estimated to be 98.4o, that is just south of east, while the position angle of the maximum recession velocity is close to due south. When I first examined this velocity field I had a hard time reconciling it with rotation in a thin disk. This was before I learned how to do Voronoi binning though. The image below shows the binned velocity field (with a target S/N of 6.25). This shows that the relative velocity does increase on a roughly north to south line, indicating that this is indeed a rotating disk galaxy.

8252-12704_vf_binned
mangaid 1-185287 (plateifu 8252-12704) Measured velocity field from binned RSS spectra. Black arrow indicates major axis position angle from photometry. Gray arrow: position angle of receding side from velocity model with prior guess of 180o

I mentioned in an earlier post that without a proper prior on the kinematic position angle phi these models are inherently multi-modal (in fact they are infinitely modal and therefore would have improper posteriors). The solution to that of course is to have a proper prior. But if the prior is seriously in error the posterior estimates for the components of the velocity will end up scrambled as can be seen in the top row of the graph below, which shows the posterior distributions of the circular and “expansion” velocities1Remember that the photometric position angle is determined modulo π while the direction to the maximum recession velocity is measured modulo 2π. We don’t care about a π radian error in the prior though because that just flips the signs of the velocity components, which causes no sampling issues and is trivially fixable in the generated quantities block. It’s smaller errors that cause problems.

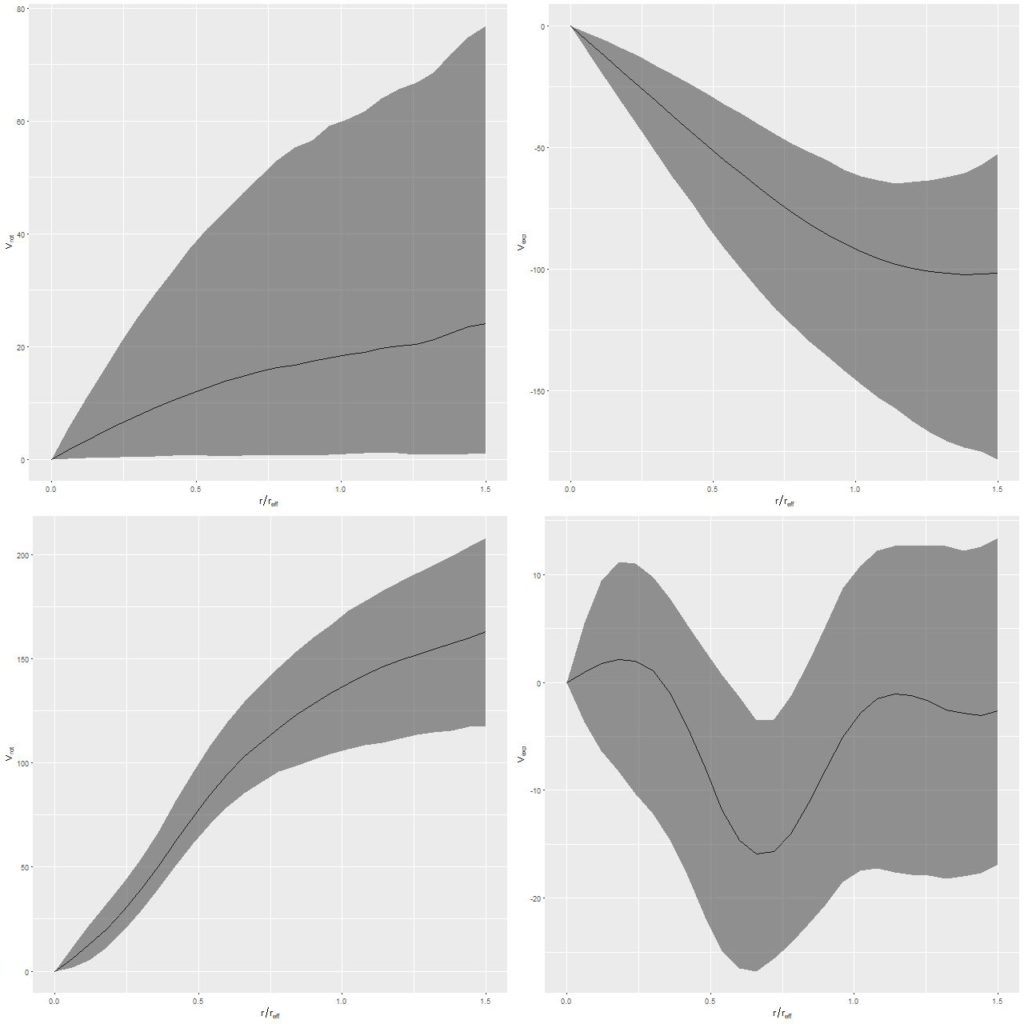
The obvious solution to a bad prior is to correct it2Using the data you’re trying to model to establish a prior is, technically, cheating (the polite term is “Empirical Bayes”), but this seems a relatively benign use of the data., which is easy enough. The bottom row shows the results of re-running the model with a prior phicentered on 180o and the same data. Now both the circular and expansion velocity curves are at least plausible. The posterior mean of phiis ≈185o, which is very close to correct as can be seen in the binned velocity field shown above.

8252-12704_rot_exp_guessphi_guess180
mangaid 1-185287 (plateifu 8252-12704) Top row: model rotation (L) and expansion (R) velocities with prior for major axis angle taken from photometry (phi = 98.4). Bottom row: same but with prior phi = 180o.

One more example. Bars were the most common cause of misleading photometric decompositions, but not the only one. Some galaxies are just asymmetrical. Here is the one that had the largest offset between the photometric and kinematic position angles:

mangaid 1-201291 (plateifu 8145-6103) – SDSS thumbnail with IFU footprint overlay

And the velocity field (again this agrees well with the Marvin measurements of the data cube):

8145-6103_velocityfield
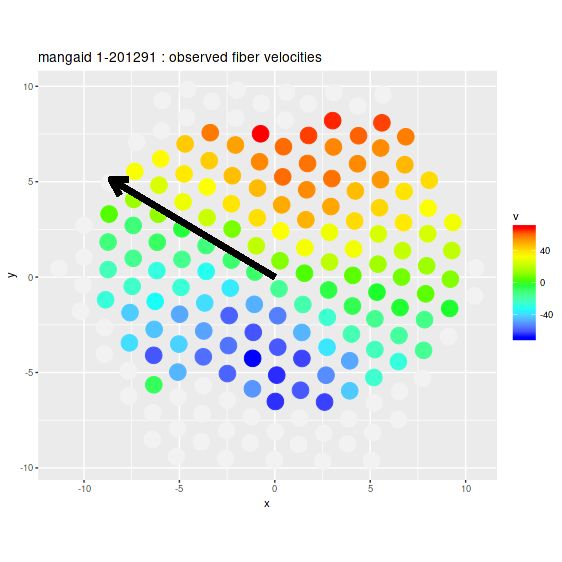
mangaid 1-201291 (plateifu 8145-6103). Velocity field from stacked RSS spectra with major axis angle from nsa_elpetro_phi

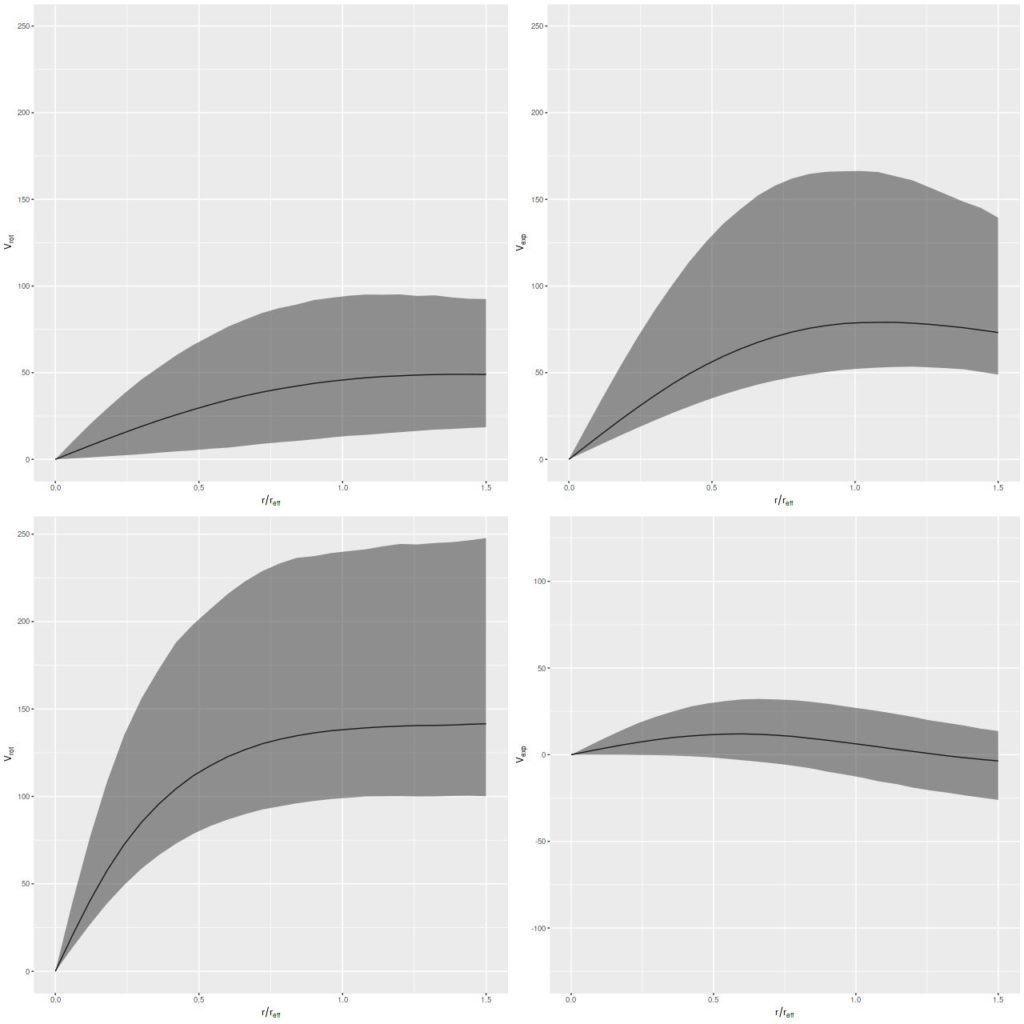
This time the velocity field looks unremarkable, but again because of the prior the estimated circular and expansion velocities are scrambled together. And once again also, changing the prior to be centered on the approximate actual position angle of the receding side produces reasonable estimates for both:

mangaid 1-201291 (plateifu 8145-6103).
mangaid 1-201291 (plateifu 8145-6103). Top: Posterior predictive distributions of circular and expansion velocity with prior on `phi` from photometry. Bottom: Same with prior centered on -10o

Next up, I’ll take a more holistic look at final sample selection, and maybe get to results.

Revisiting the Baryonic Tully-Fisher relation with DR15 data

As I mentioned in the previous two posts SDSS Data Release 15 went public back in December and a query for “normal” disk galaxies as judged by Galaxy Zoo 2 classifiers returned 588 hits. I’ve finally run the GP velocity models on all of the new data and made a second run on around 40 that were contaminated by foreground stars or neighboring galaxies. So far I haven’t found an alternative to selecting these by eye and doing the masking manually, so that’s an error prone process. The month+ long gap between postings by the way was due to travel — my computer wasn’t grinding away on these models for all that time. As I mentioned last post the sampling properties including execution time of the GP model with arctangent mean function are usually quite favorable using Stan. The median wall time for these runs was about a minute, with a range from 25 to 1600 seconds. All model runs used 500 warmup iterations and 500 post-warmup with 4 chains run in parallel. This is more than enough for inference.

Before I discuss the results I’ll show them. As I did for the first pass at this way back in July I retrieved stellar mass and uncertainty estimates made by the MPA-JHU group from CasJobs; all but a handful also have mass estimates from the Wisconsin group. I may look at those later but don’t anticipate any very significant differences.

There are now at least two plausible choices for reference circular velocities: the velocity at a fiducial radius, and again I choose 1.5 effective radii since the MaNGA IFUs are meant to cover out to that radius in the primary sample. The other obvious choice is the asymptotic velocity vc in the arctangent mean function. This seems in principle to be the better choice since it estimates the circular velocity in the flat part of the rotation curve, but it might be a considerable extrapolation from the actual data in some cases.

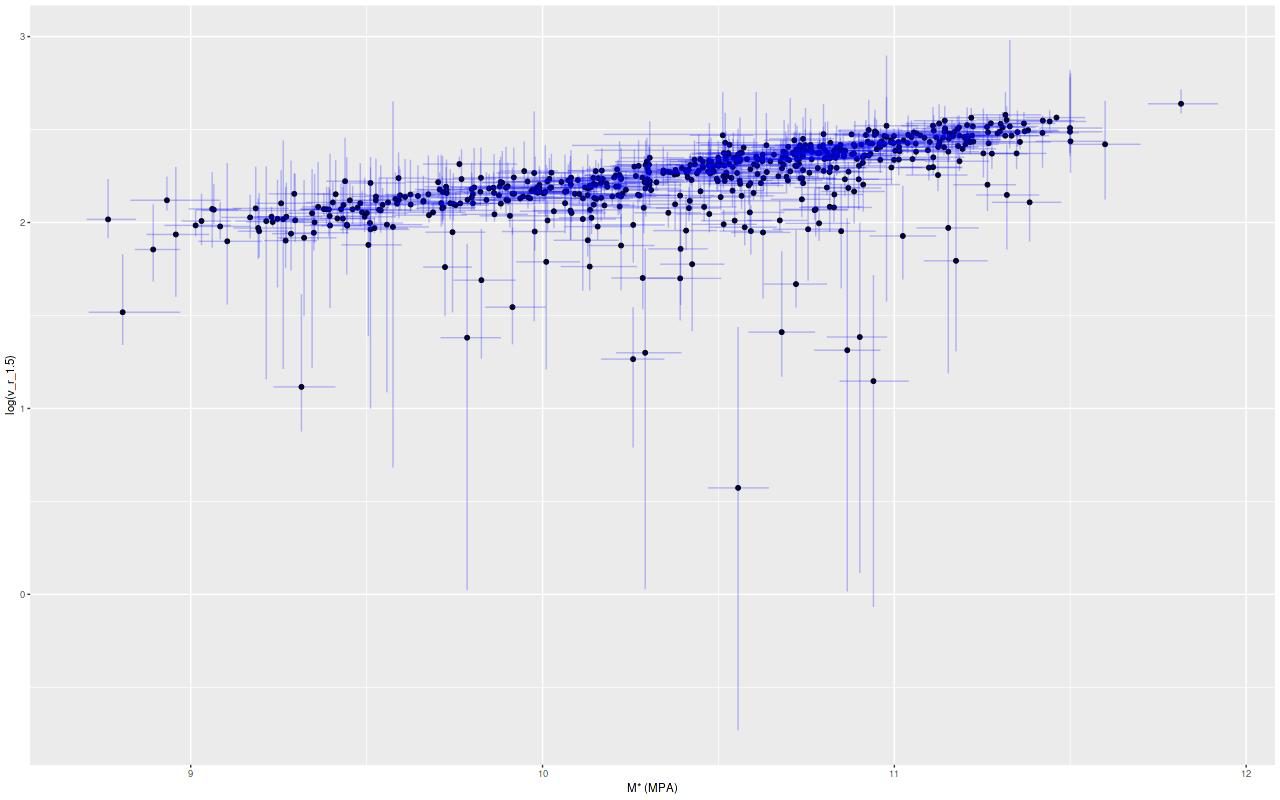
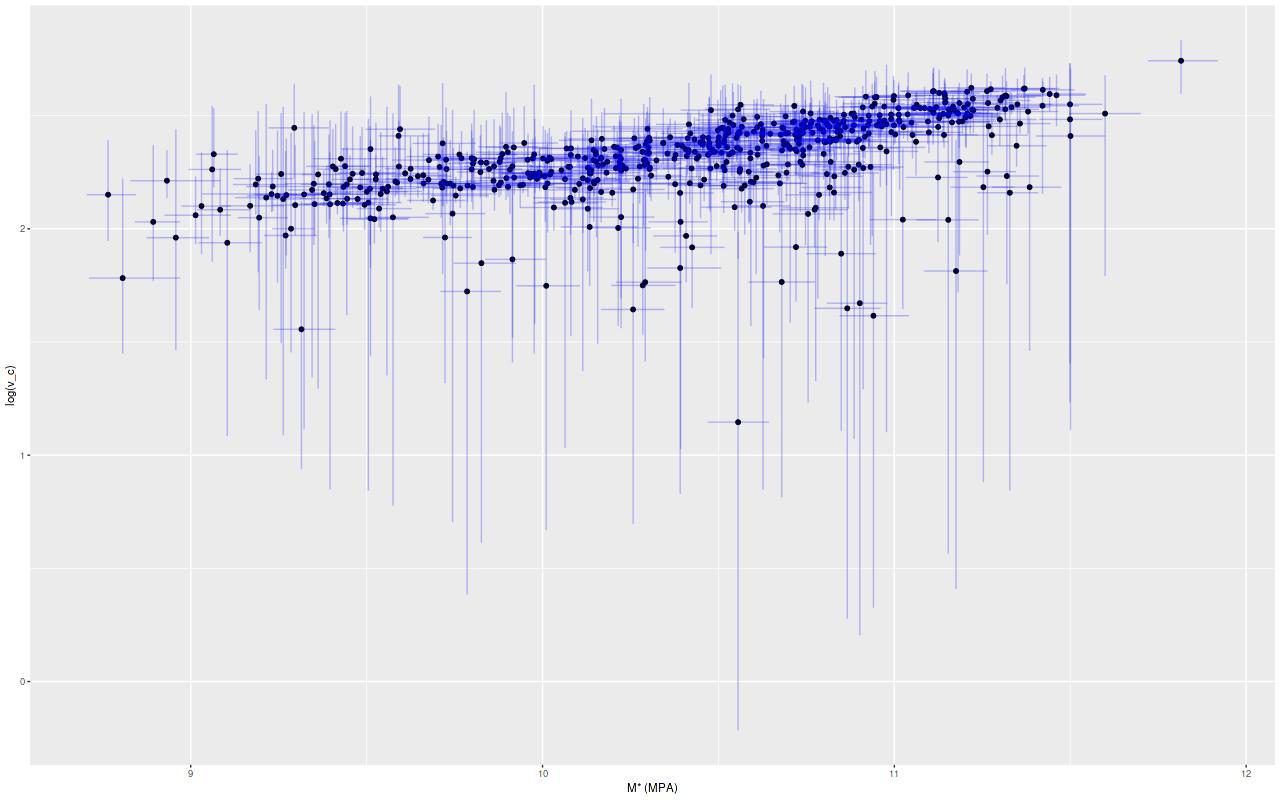
Both sets of results are shown below for all model runs that ran to completion (N=582). Plotted are the median, 2.5, and 97.5 percentiles (≈ ± 2σ) of posterior predictions for the log-circular velocity at 1.5reff (top graph) and the same quantiles of the posteriors of the parameter v_c (bottom graph). These are plotted against the median, 16, and 84 percentiles (≈ ± 1σ) of the total stellar mass estimates per the MPA group.

logvr_mstar_dr15
Estimated rotation velocity at 1.5 effective radii vs. stellar mass estimate from MPA-JHU models
logvc_mstar_dr15
Estimated asymptotic rotation velocity against stellar mass from MPA-JHU models. Vertical error bars mark the 2.5 and 97.5 percentiles of the model posteriors of (log) velocity in km/sec. Horizontal error bars mark the 16 and 84 percentiles model posteriors of (log) stellar mass.

Evidently most of the sample follows a tight linear relationship with either measure of circular velocity, but there are some apparent outliers as well. I’m feeling a bit blocked right now, so I’ll end the post here. Next time I’ll look at some of the causes of model failure, what to do about them, and get to the results.

Yet more on rotation curve modeling — why the mean function matters

When I first began modeling disk galaxy rotation curves using low order polynomials for the circular velocity I noticed two rather frequent systematics in the model residuals:

  1. Lobe like areas symmetrically located around the nucleus with approximately equal and opposite signs. Sometimes these are co-located with bar ends but a bar is not always obvious.
  2. A contrast of a few 10’s of kilometers/sec between spiral arms and interarm regions. This is rather common in grand design spirals.

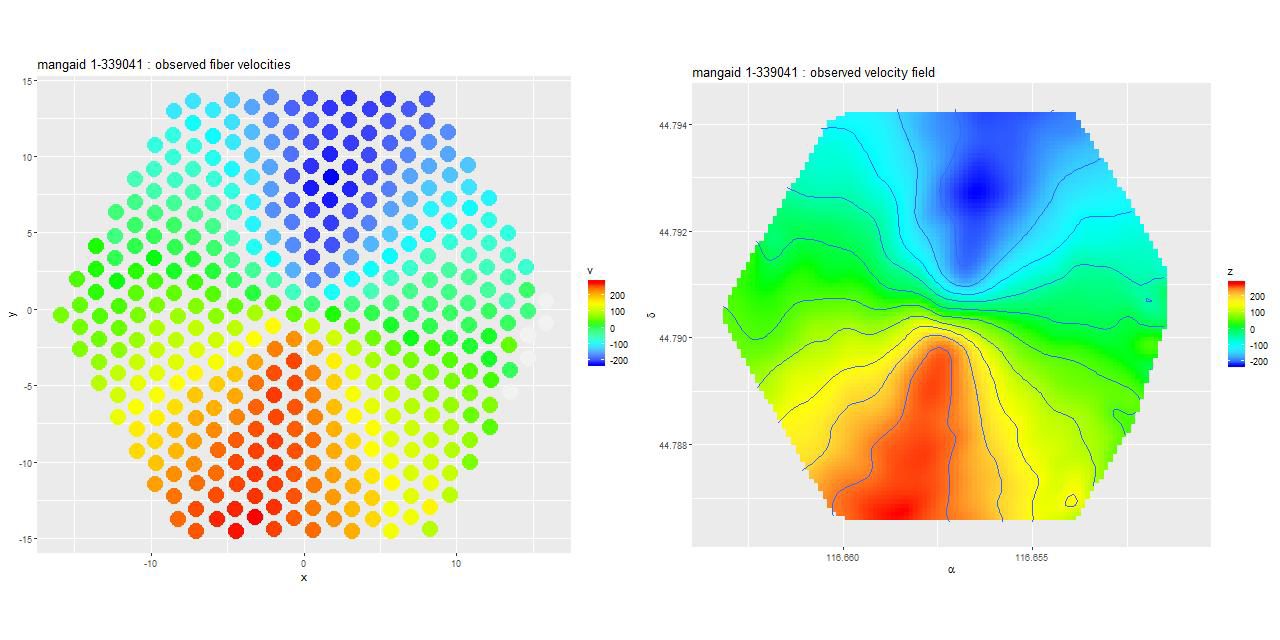
Here’s a particularly dramatic example of symmetrical lobes in mangaid 1-339041 (plateifu 8138-12704), IAU name SDSS J074637.70+444725.8. First, here are the measured line of sight velocities for the fiber spectra:

vf_rss_8138-12704
(L) Velocity field measured from stacked RSS file (R) Interpolated velocity field mangaid 1-339041 (plateifu 8138-12704)

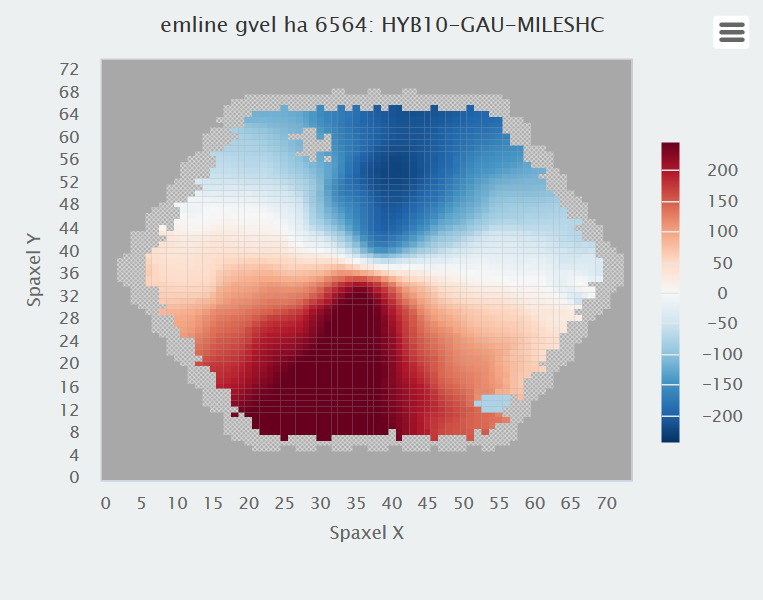
The left plot shows the actual measurements from the stacked RSS file. The right is just an interpolated version of the left. Since value added data is now available it’s worth comparing this to output from “Marvin“. For reference here is the Hα velocity map:

Hα velocity map from MaNGA DAP

It’s hard to tell in any detail, but these look similar enough and the stellar velocity field as measured by the DAP also looks similar.

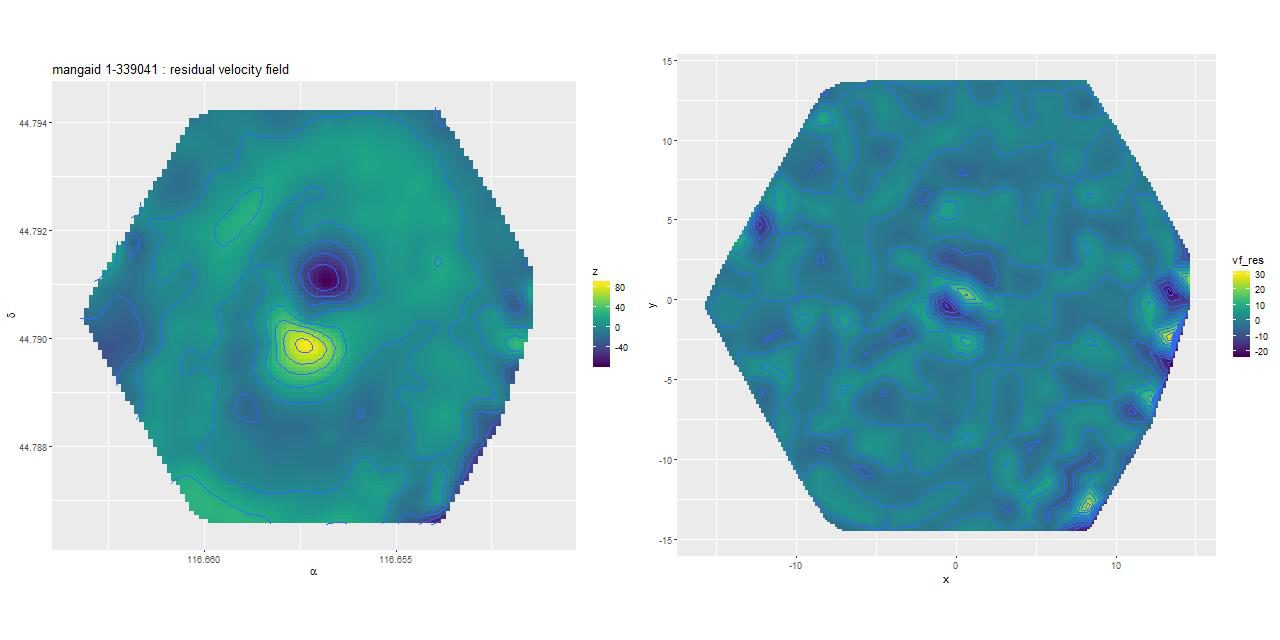
Next, here are the mean residuals from the posterior predictive fits shown as interpolated maps derived from the fits at the observed positions. As promised the left hand map from the low order polynomial fit has prominent lobes situated on either side of the nucleus and a more subtle contrast between spiral arms and interarm regions. The right hand map from the GP model appears to be largely free of systematic patterns. Why the difference?

vf_res_2ests_8138-12704
Mean residuals from models: (L) Polynomial rotation curve model (R) GP model with atan mean function

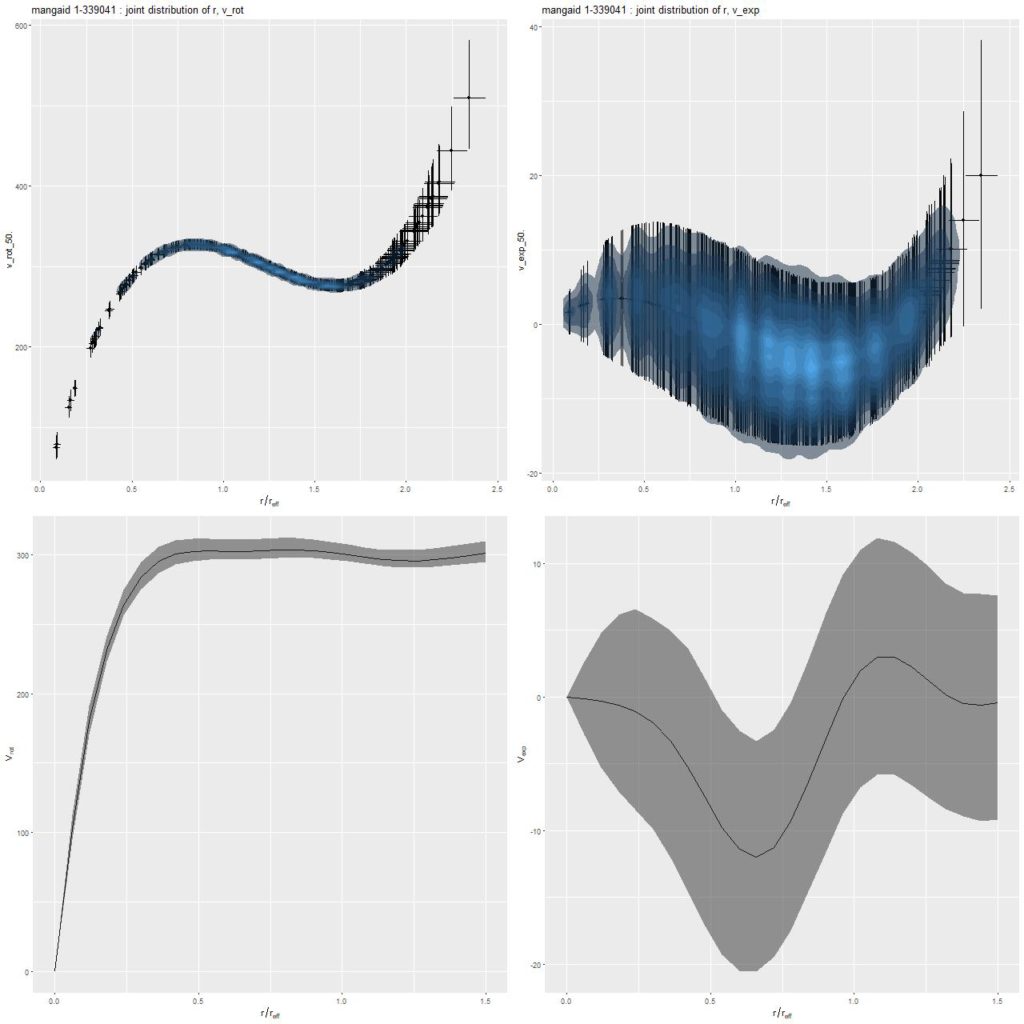
In this case the arctangent mean function I introduced in the last post worked very well, with the estimated circular velocity rising quickly to an asymptotic value of ∼300km/s. The low order polynomial representation is necessarily constrained by the possible shapes of a low order polynomial (in this case cubic), resulting in a shallower initial slope and a first local maximum farther out than in the GP model. The lobed residuals in the polynomial model are therefore seen to be due to an inner disk that’s rotating more rapidly than can be modeled (and not due to a kinematically distinct component or to streaming material).

rot_curves_2ests_8138-12704
Rotation and “expansion” velocity curves (T) polynomial model (B) GP model with atan mean function

As a brief morphological note, GZ2 classifiers thought this was a normal looking disk galaxy by an overwhelming majority. It’s hard to say they were wrong based on the SDSS imaging, but the deeper and wider legacy survey thumbnail clearly shows the outer disk to be disturbed, presumably by the edge on disk galaxy to the north — the relative velocities are ∼340km/sec, so they are likely in close proximity.

Plateifu 8138-12704 IFU footprint

As time allows I may take a closer look at model diagnostics available in Stan or some more examples. Longer term I plan to take another look at the Baryonic Tully-Fisher relationship for the larger sample available in DR15.