
As I mentioned in the previous two posts SDSS Data Release 15 went public back in December and a query for “normal” disk galaxies as judged by Galaxy Zoo 2 classifiers returned 588 hits. I’ve finally run the GP velocity models on all of the new data and made a second run on around 40 that were contaminated by foreground stars or neighboring galaxies. So far I haven’t found an alternative to selecting these by eye and doing the masking manually, so that’s an error prone process. The month+ long gap between postings by the way was due to travel — my computer wasn’t grinding away on these models for all that time. As I mentioned last post the sampling properties including execution time of the GP model with arctangent mean function are usually quite favorable using Stan. The median wall time for these runs was about a minute, with a range from 25 to 1600 seconds. All model runs used 500 warmup iterations and 500 post-warmup with 4 chains run in parallel. This is more than enough for inference.
Before I discuss the results I’ll show them. As I did for the first pass at this way back in July I retrieved stellar mass and uncertainty estimates made by the MPA-JHU group from CasJobs; all but a handful also have mass estimates from the Wisconsin group. I may look at those later but don’t anticipate any very significant differences.
There are now at least two plausible choices for reference circular velocities: the velocity at a fiducial radius, and again I choose 1.5 effective radii since the MaNGA IFUs are meant to cover out to that radius in the primary sample. The other obvious choice is the asymptotic velocity vc in the arctangent mean function. This seems in principle to be the better choice since it estimates the circular velocity in the flat part of the rotation curve, but it might be a considerable extrapolation from the actual data in some cases.
Both sets of results are shown below for all model runs that ran to completion (N=582). Plotted are the median, 2.5, and 97.5 percentiles (≈ ± 2σ) of posterior predictions for the log-circular velocity at 1.5reff (top graph) and the same quantiles of the posteriors of the parameter v_c (bottom graph). These are plotted against the median, 16, and 84 percentiles (≈ ± 1σ) of the total stellar mass estimates per the MPA group.
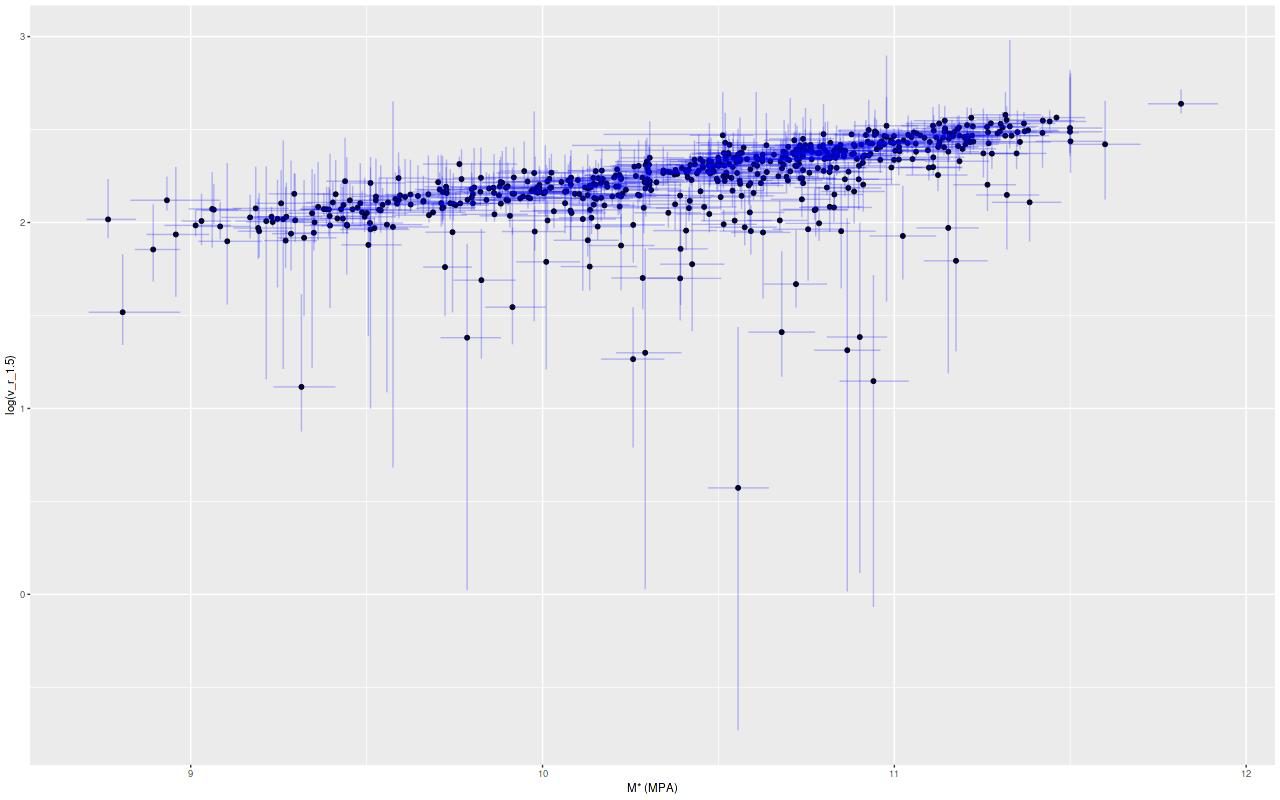
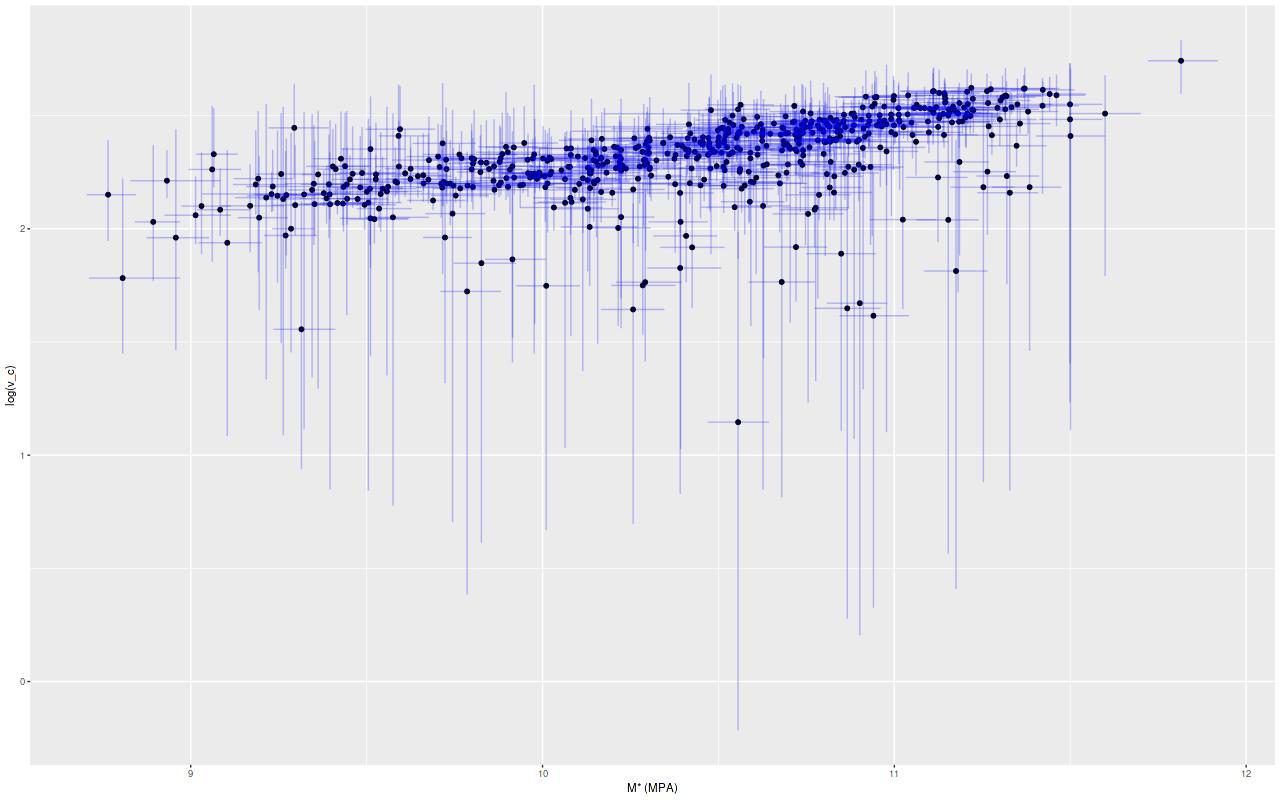
Evidently most of the sample follows a tight linear relationship with either measure of circular velocity, but there are some apparent outliers as well. I’m feeling a bit blocked right now, so I’ll end the post here. Next time I’ll look at some of the causes of model failure, what to do about them, and get to the results.