
Here’s an SDSS finder chart image of one of the two grand design spirals that found its way into my “transitional” galaxy sample:
and here’s a zoomed in thumbnail with IFU footprint:

This galaxy is in a compact group and slightly tidally distorted by interaction with its neighbors, but is otherwise a fairly normal star forming system. I picked it because I had a recent set of model runs and because it binned to a manageable but not too small number of spectra (112). The fits to the data in the first set of model runs were good and the (likely) AGN doesn’t have broad lines. Here are a few selected results from the set of model runs using the modified Calzetti attenuation relation on the same binned spectra. First, using a tight prior on the slope parameter δ had the desired effect of returning the prior for δ when τ was near zero, while the marginal posterior for τ was essentially unchanged:
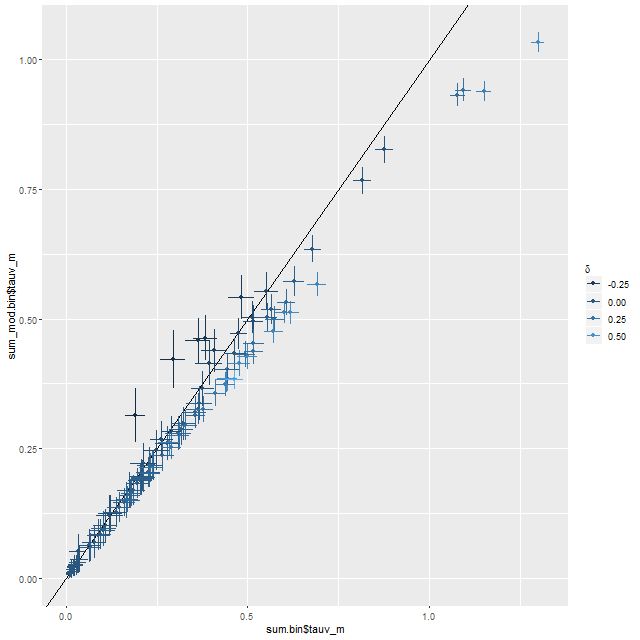
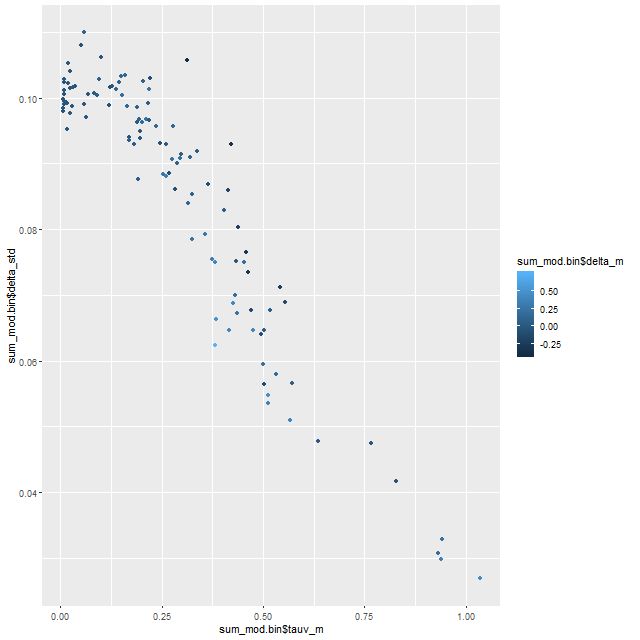
At larger optical depths the data do constrain both the shape of the attenuation curve and optical depth. At low optical depth the posterior uncertainty in δ is about the same as the prior, while it decreases more or less monotonically for higher values of τ. A range of (posterior mean) values of δ from slightly shallower than a Calzetti relation to somewhat steeper. The general trend is toward a steeper relation with lower optical depth in the dustier regions (per the models) of the galaxy.
There’s an interesting pattern of correlations1astronmers like to call these “degeneracies,” and it’s fairly well known that they exist among attenuation, stellar age, stellar mass, and other properties here, some of which are summarized in the sequence of plots below. The main result is that a steeper (shallower) attenuation curve requires a smaller (larger) optical depth to create a fixed amount of reddening, so there’s a negative correlation between the slope parameter δ and the change in optical depth between the modified and unmodified curves. A lower optical depth means that a smaller amount of unattenuated light, and therefore lower stellar mass, is needed to produce a given observed flux. so there’s a negative correlation between the slope parameter and stellar mass density or a positive correlation between optical depth and stellar mass. The star formation rate density is correlated in the same sense but slightly weaker. In this data set both changed by less than about ± 0.05 dex.
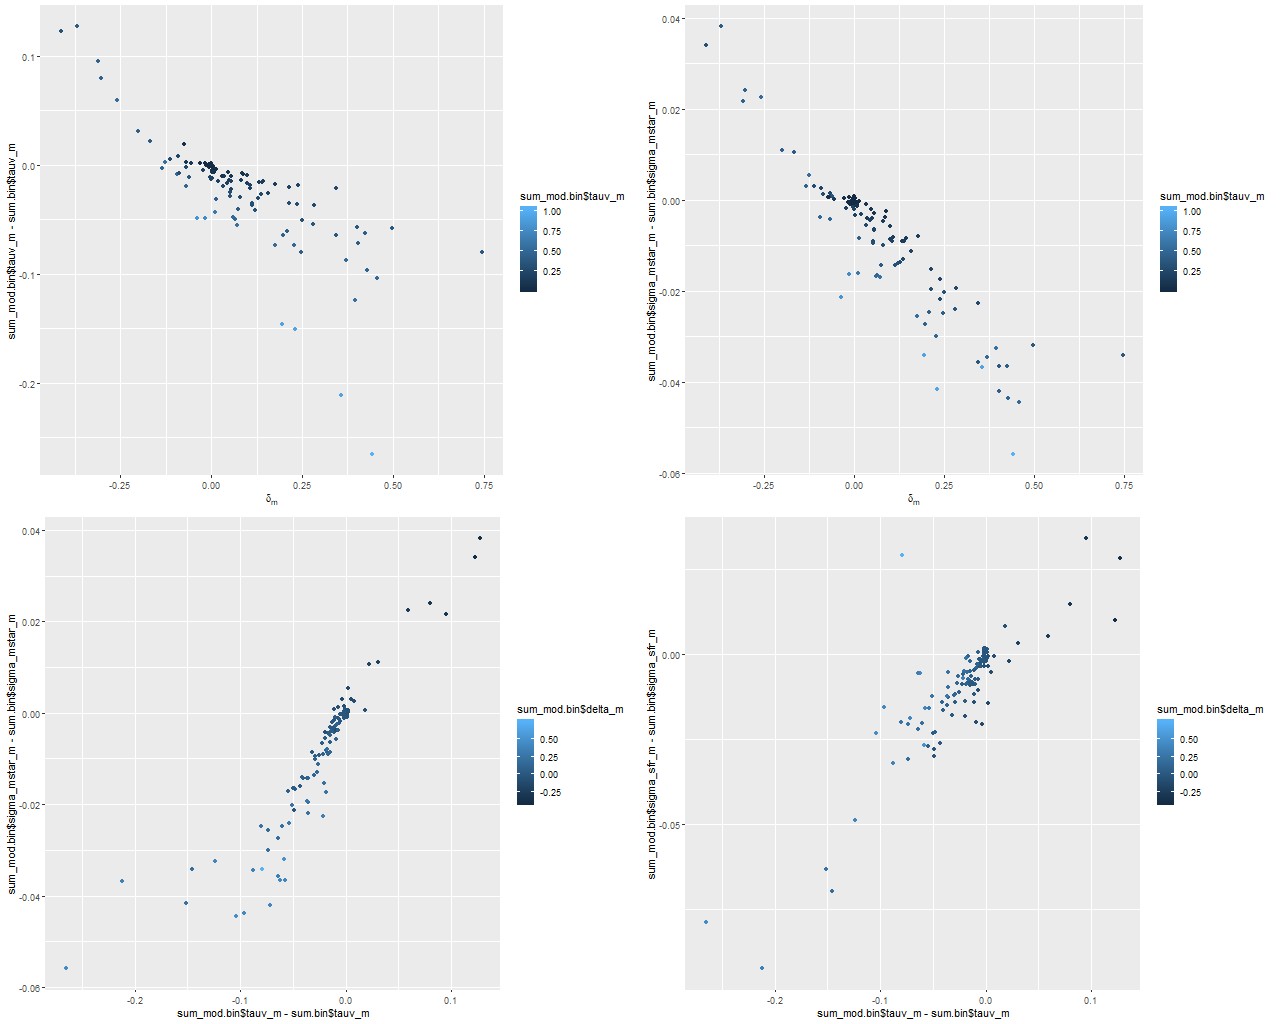
(TR) change in stellar mass density vs. δ
(BL) change in stellar mass density vs. change in optical depth
(BR) change in SFR density vs change in optical depth Note: all quantities are marginal posterior mean estimagtes.
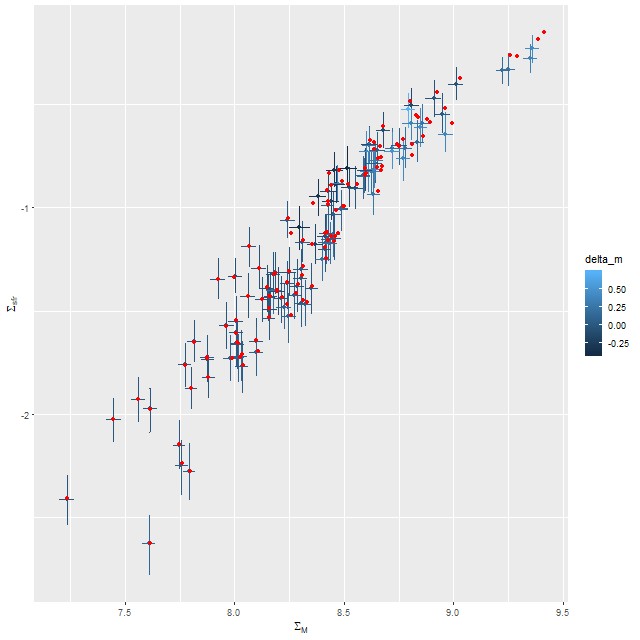
Here are a few relationships that I’ve shown previously. First between stellar mass and star formation rate density. The points with error bars (which are 95% marginal credible limits) are from the modified Calzetti run, while the red points are from the original. Regions with small stellar mass density and low star formation rate have small attenuation as well in this system, so the estimates hardly differ at all. Only at the high end are differences about as large as the nominal uncertainties.
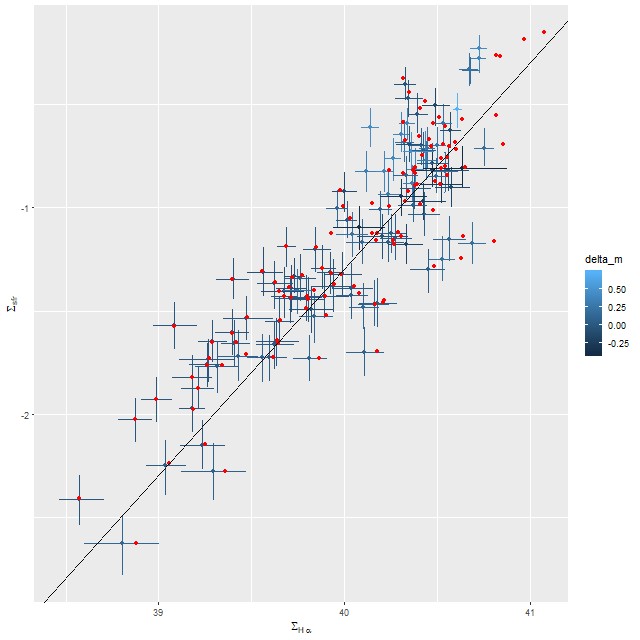
Finally, here is the relation between Hα luminosity density and star formation rate with the former corrected for attenuation using the Balmer decrement. The straight line is, once again, the calibration of Moustakas et al. Allowing the shape of the attenuation curve to vary has a larger effect on the luminosity correction than it does on the SFR estimates, but both sets of estimates straddle the line with roughly equal scatter.
To conclude for now, adding the more flexible attenuation prescription proposed by Salim et al. has some quantitative effects on model posteriors, but so far at least qualitative inferences aren’t significantly affected. I haven’t yet looked in detail at star formation histories or at effects on metallicity or metallicity evolution. I’ve been skeptical that SFH modeling constrains stellar metallicity or (especially) metallicity evolution well, but perhaps it’s time to take another look.