
Last time I left off with the remark that while most of the sample of disk galaxies clearly exhibits a tight relationship between circular velocity and stellar mass, there are some apparent outliers as well. While some “cosmic variance” is expected most of the apparent outliers are due to model failures, which have several possible causes:
- Violation of the physical assumptions of the model, namely that the stars and gas are rotating (together) in the plane of a thin disk that’s moderately inclined to our line of sight (see my original post on this topic).
- Errors in the photometry. I use two photometric quantities (specifically
nsa_elpetro_baandnsa_elpetro_phi) from the MaNGA DRPALL catalog to set priors for the kinematic parameterscos_iandphi(cosine of the disk inclination and angle to receding side) and also to initialize the sampler. Since proper and in practice fairly informative priors are required for these parameters errors here will propagate into the models, sometimes in ways that are fatal. I’ll look in more detail at some examples below. - Bad velocity data.
- Not enough data.
- Sampler convergence failures with no obvious cause.
The first two bullet points are closely related: most of the failures to satisfy the physical assumptions are directly related to errors in the photometric decompositions. One fairly common failure was galaxies that were too nearly face on to obtain reliable rotation curves. As an example here is the galaxy with the lowest estimated rotation velocity in the sample, mangaid 1-135054 (plateifu 8550-12703):
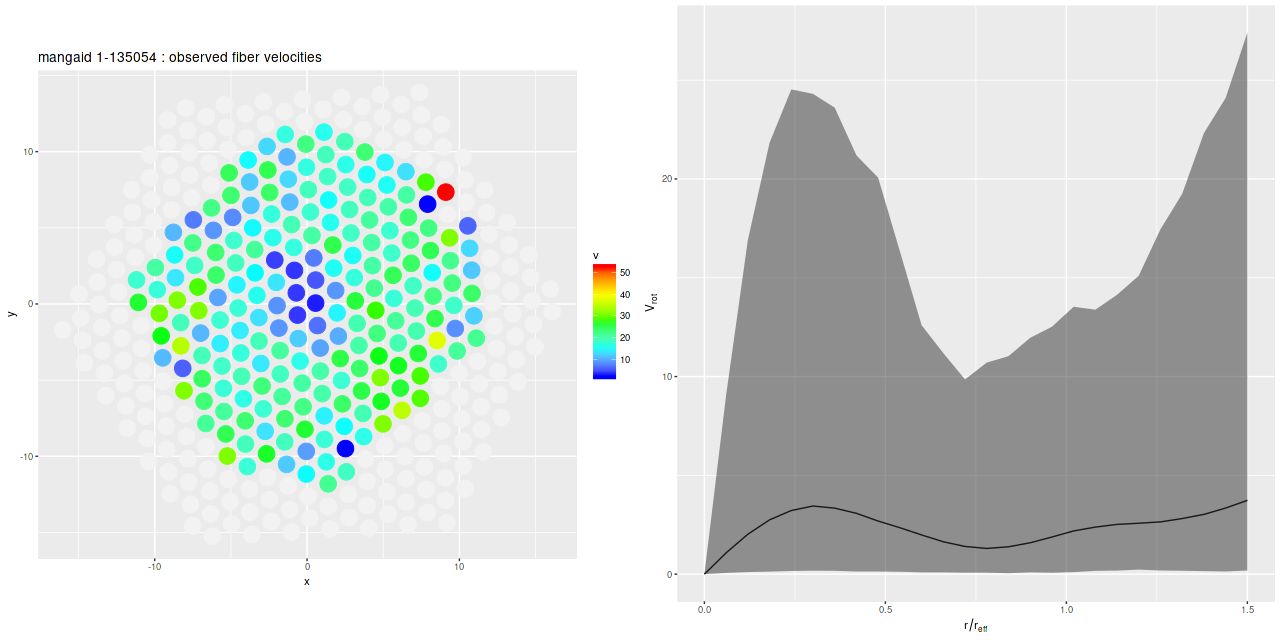
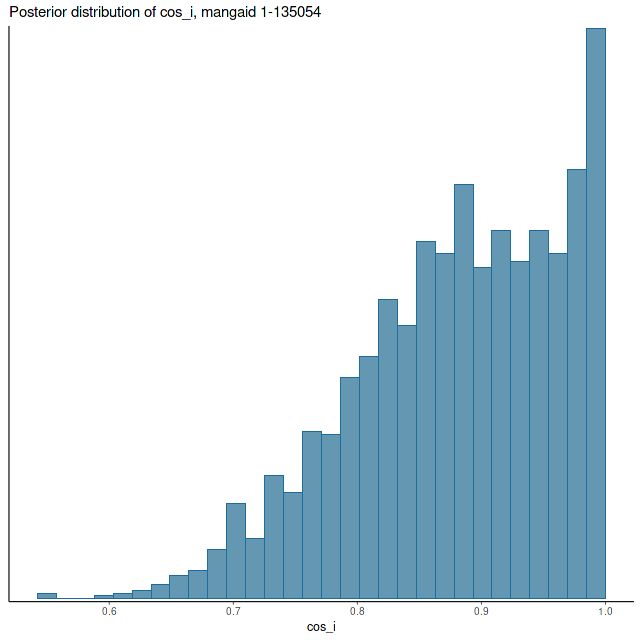
Besides showing no sign of rotation the velocity field hints at possible large scale, low velocity outflow in the central region. There are also a few apparent outliers, although these had little effect on model results. Fortunately the model output gives us plenty of clues that the results shouldn’t be trusted. The median circular velocity estimate is unrealistically low with very large posterior uncertainty (above right), while the posterior marginal density for cos_ihas a mode near 1 and also very large uncertainty (below).
Zooming out a bit on SDSS imaging gives a likely explanation for the peculiar velocity field. The elliptical galaxy just to the NW has nearly the same redshift (the velocity difference is ∼75 km/sec) and is almost certainly interacting with our target.
A key assumption in using photometric properties as proxies for kinematic quantities is that disk galaxies have intrinsically circular surface brightness profiles. This is never quite the case in practice and sometimes morphological features like strong bars can make this assumption catastrophically wrong. Here was perhaps the most extreme example in DR14:

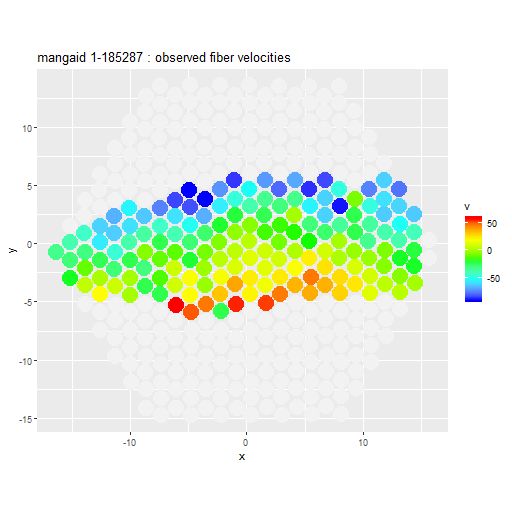
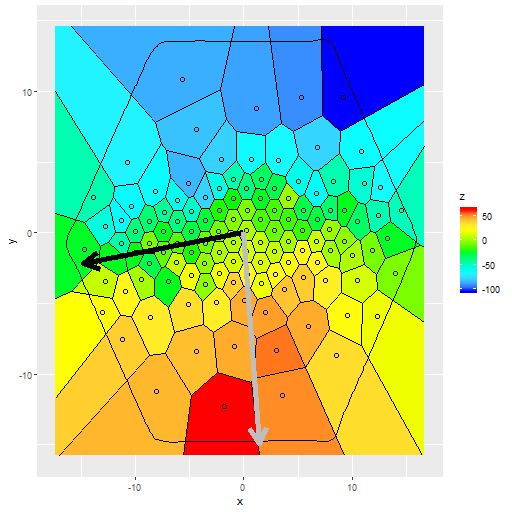
The photometric major axis angle was estimated to be 98.4o, that is just south of east, while the position angle of the maximum recession velocity is close to due south. When I first examined this velocity field I had a hard time reconciling it with rotation in a thin disk. This was before I learned how to do Voronoi binning though. The image below shows the binned velocity field (with a target S/N of 6.25). This shows that the relative velocity does increase on a roughly north to south line, indicating that this is indeed a rotating disk galaxy.
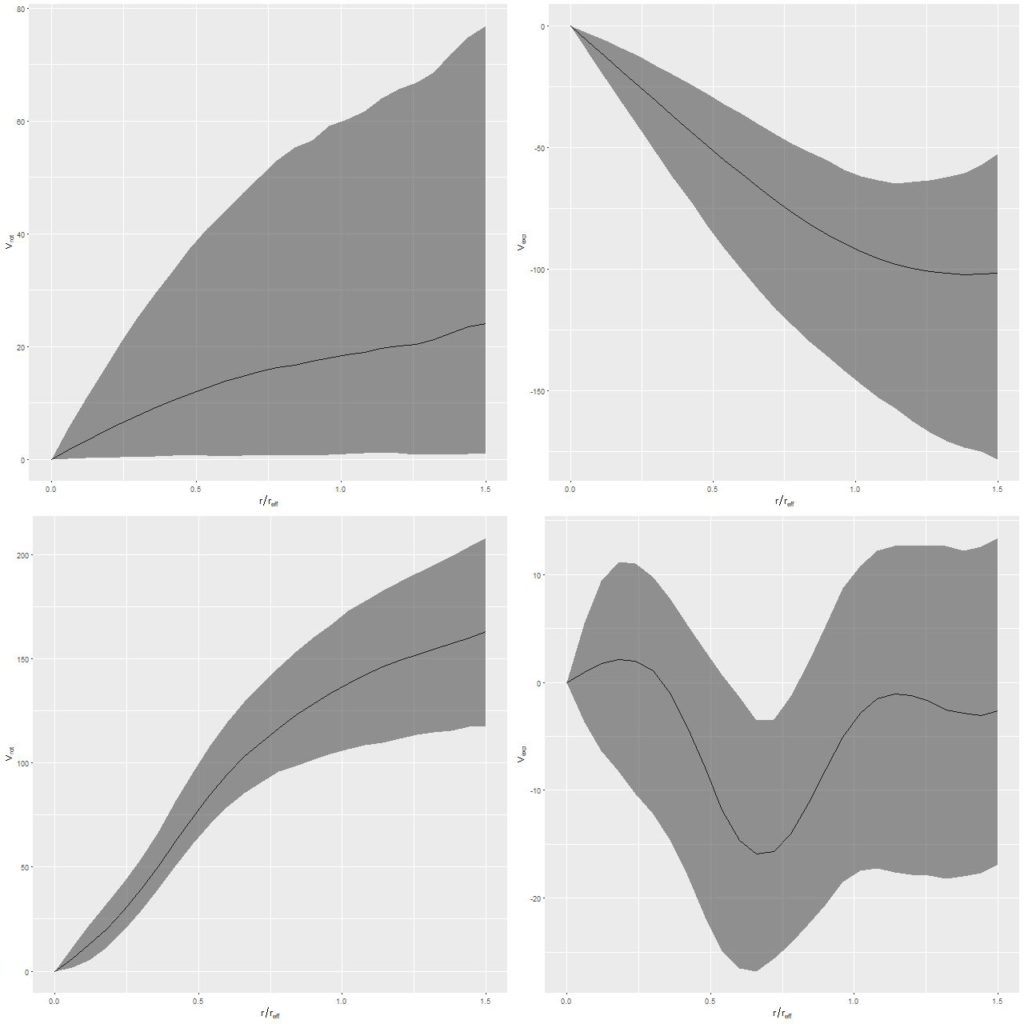
I mentioned in an earlier post that without a proper prior on the kinematic position angle phi these models are inherently multi-modal (in fact they are infinitely modal and therefore would have improper posteriors). The solution to that of course is to have a proper prior. But if the prior is seriously in error the posterior estimates for the components of the velocity will end up scrambled as can be seen in the top row of the graph below, which shows the posterior distributions of the circular and “expansion” velocities1Remember that the photometric position angle is determined modulo π while the direction to the maximum recession velocity is measured modulo 2π. We don’t care about a π radian error in the prior though because that just flips the signs of the velocity components, which causes no sampling issues and is trivially fixable in the generated quantities block. It’s smaller errors that cause problems.
The obvious solution to a bad prior is to correct it2Using the data you’re trying to model to establish a prior is, technically, cheating (the polite term is “Empirical Bayes”), but this seems a relatively benign use of the data., which is easy enough. The bottom row shows the results of re-running the model with a prior phicentered on 180o and the same data. Now both the circular and expansion velocity curves are at least plausible. The posterior mean of phiis ≈185o, which is very close to correct as can be seen in the binned velocity field shown above.
One more example. Bars were the most common cause of misleading photometric decompositions, but not the only one. Some galaxies are just asymmetrical. Here is the one that had the largest offset between the photometric and kinematic position angles:

And the velocity field (again this agrees well with the Marvin measurements of the data cube):
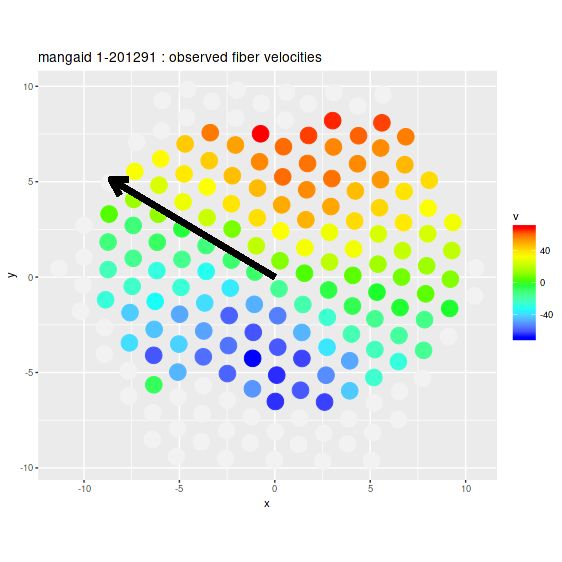
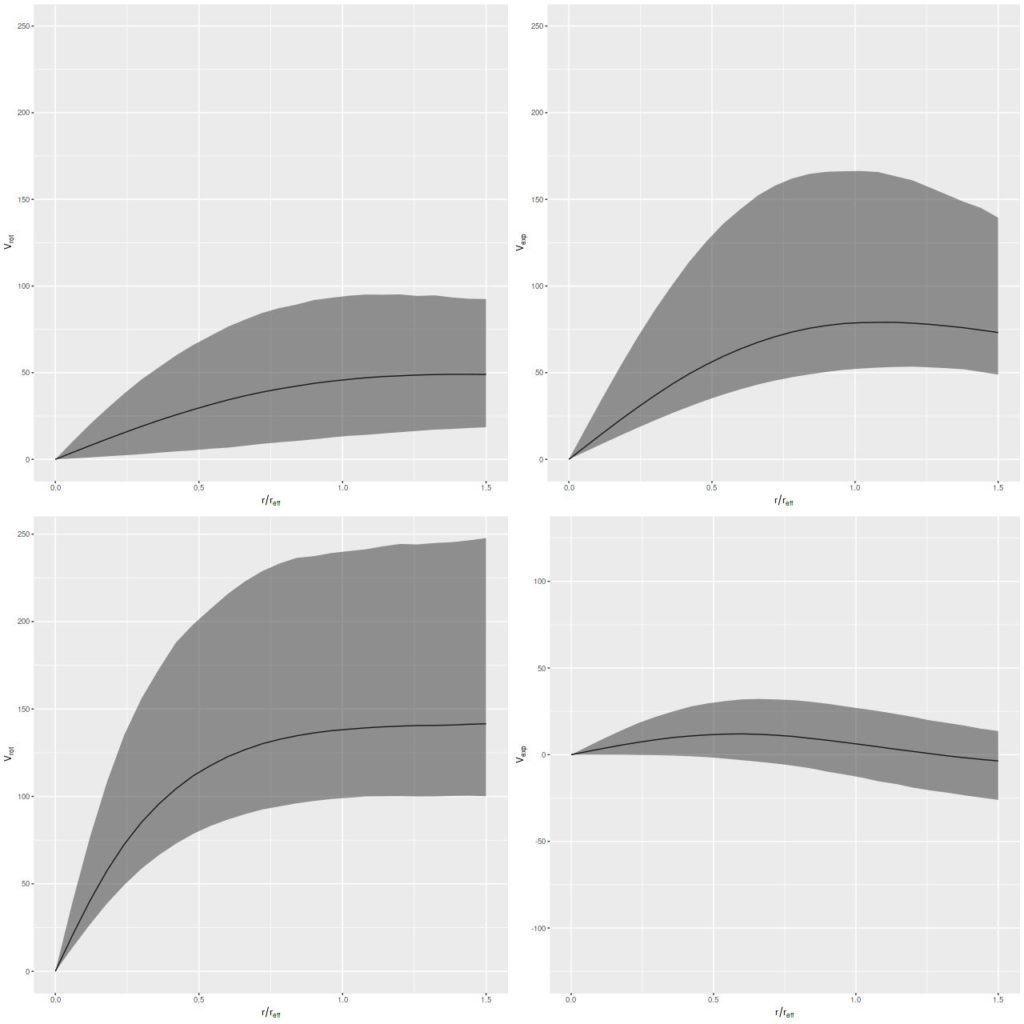
This time the velocity field looks unremarkable, but again because of the prior the estimated circular and expansion velocities are scrambled together. And once again also, changing the prior to be centered on the approximate actual position angle of the receding side produces reasonable estimates for both:
Next up, I’ll take a more holistic look at final sample selection, and maybe get to results.