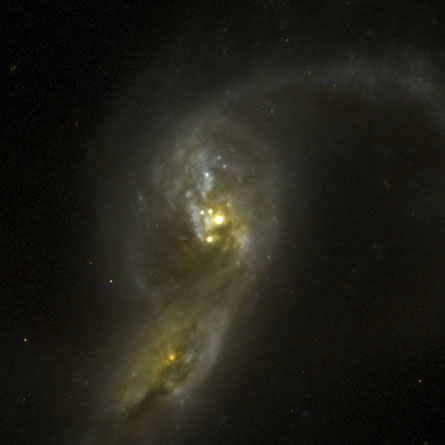
This galaxy1also known as VV705, IZw 107, IRAS F15163+4255, among others has been my feature image since I started this blog. Why is that besides that it’s kind of cool looking? As I’ve mentioned before I took a shot a few years ago at selecting a sample of “transitional” galaxies from the SDSS spectroscopic sample, that is ones that may be in the process of rapidly shutting down star formation2See for example Alatalo et al. (2017) for recent usage of this terminology.. I based the selection on a combination of strong Hδ absorption and either weak emission lines or line ratios other than pure starforming, using measurements from the MPA-JHU pipeline. This galaxy pair made the sample based on the spectrum centered on the northern nucleus (there is also a spectrum of the southern nucleus from the BOSS spectrograph, but no MPA pipeline measurements). Well now, these galaxies are certainly transitioning to something, but they’re probably not shutting down star formation just yet. Simulations of gas rich mergers generally predict a starburst that peaks around the time of final coalescence. There is also significant current star formation, as high as 100-200 \(M_\odot/yr\) per various literature estimates, although it is mostly hidden. So on the face of it at least this appears to be a false positive. This was also an early MaNGA target, and one of a small number where both nuclei of an ongoing merger are covered by a single IFU:

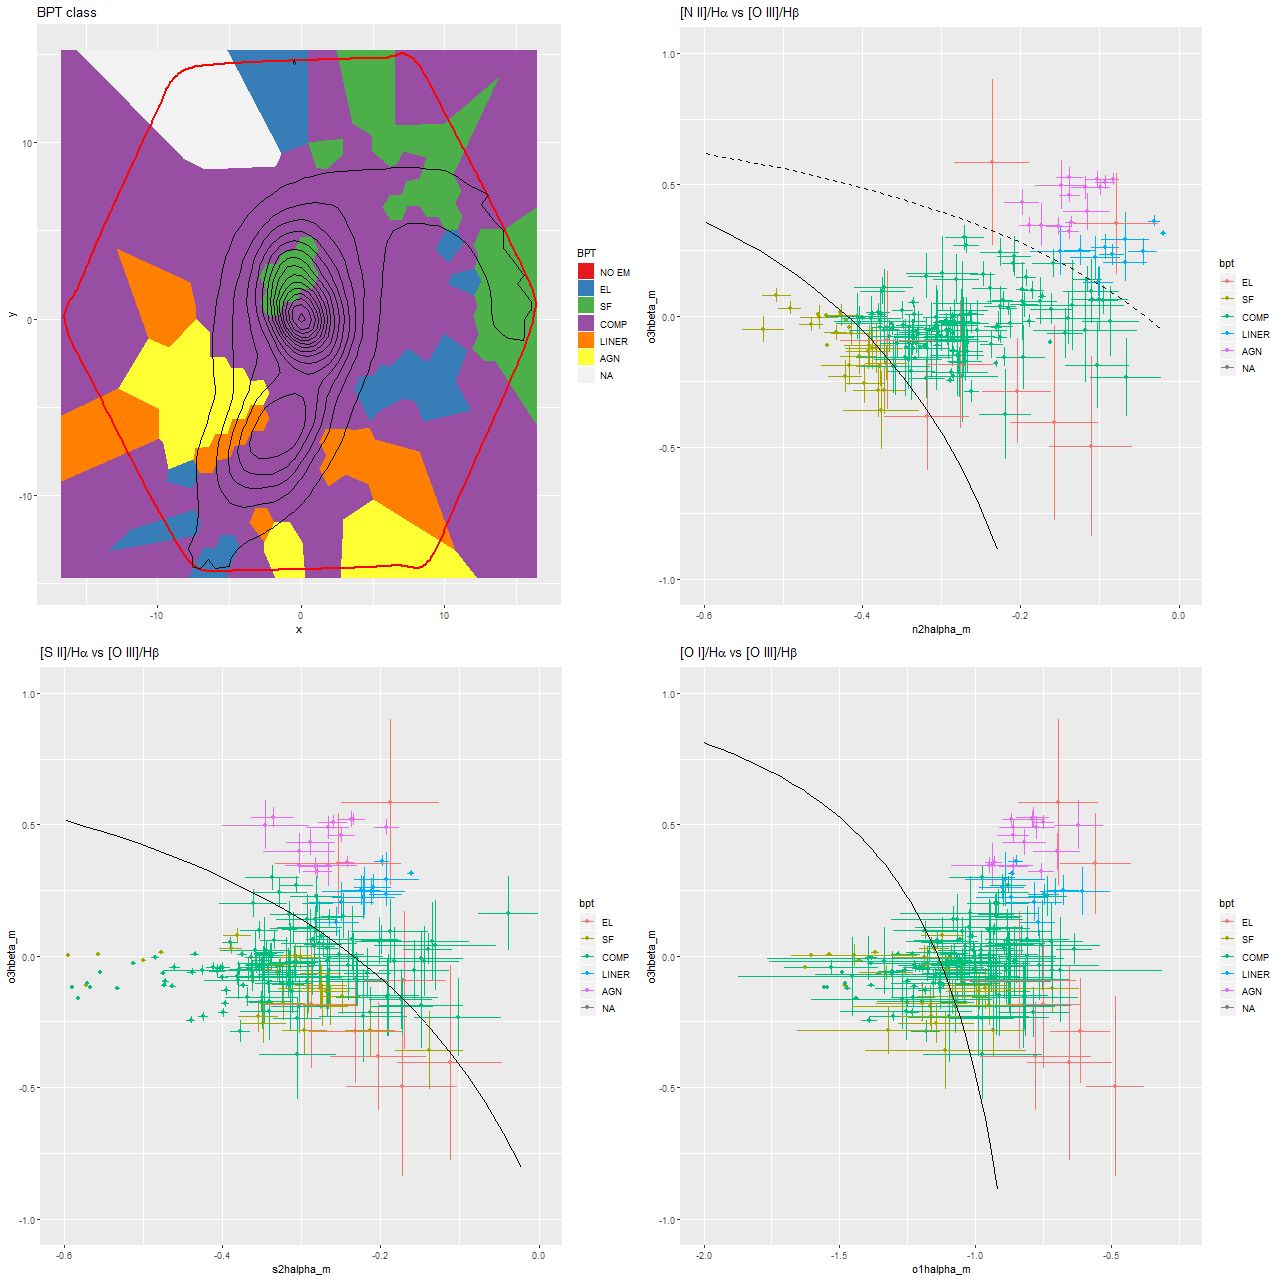
Today I’m going to look at a few results of my analysis of the IFU data that aren’t too model dependent to get some insight into why this system was selected. As usual I’m looking at the stacked RSS data rather than the data cubes, and for this exercise I Voronoi binned the spectra to a very low target SNR of 6.25. This leaves most of the fibers unbinned in the vicinity of the two nuclei. First, here is a map of BPT classification based on the [O III]/Hβ vs. [N II]/Hα diagnostic as well as scatterplots of several BPT diagnostics. Unfortunately the software I use for visualizing binned maps extends the bins out to the edge of the bounding rectangle rather than the hexagonally shaped edge of the data, which is outlined in red. Also note that different color coding is used for the scatter plots than the map. The contour lines in the map are arbitrarily spaced isophotes of the synthesized R band image supplied with the data cube.

What’s immediately obvious is that most of the area covered by the IFU including both nuclei fall in the so-called “composite” region of the [N II]/Hα BPT diagram. This gets me back to something I’ve complained about previously. There was never a clear physical justification for the composite designation (which recall was first proposed in Kauffmann et al. 2003), and the upper demarcation line between “pure” AGN and composite systems as shown in the graph at upper right was especially questionable. It’s now known if it wasn’t at the turn of the century (which I doubt is the case) that a number of ionization mechanisms can produce line ratios that fall generally in the composite/LINER regions of BPT diagnostics. Shocks in particular are important in ongoing mergers. High velocity outflow of both ionized and neutral gas have been observed in the northern nucleus by Rupke and Veillux (2013), which they attributed to supernova driven winds.
The evidence for AGN in either nucleus is somewhat ambiguous. Fu et al. (2018) called this system a binary AGN, but that was based on the “composite” BPT line ratios from the same MaNGA data as we are examining (their map, by the way, is nearly identical to mine; see also Yuan et al. 2018). By contrast Vega et al. 2008 were able to fit the entire SED from NIR to radio frequencies with a pure starburst model and no AGN contribution at all, while more recently Dietrich et al. 2018 estimated the AGN fraction to be around 0.25 from NIR to FIR SED fitting. A similar conclusion that both nuclei contain both a starburst and AGN component was reached by Vardoulaki et al. 2015 based on radio and NIR data. One thing I haven’t seen commented on in the MaNGA data that possibly supports the idea that the southern nucleus harbors an AGN is that the regions with unambiguous AGN-like optical emission line ratios are fairly symmetrically located on either side of the southern nucleus and separated from it by ∼1-2 kpc. This could perhaps indicate the AGN is obscured from our view but visible from other angles.
There are also several areas with starforming emission line ratios just to the north and east of the northern nucleus and scattered along the northern tidal tail (the southern tail is largely outside the IFU footprint). In the cutout below taken from a false color composite of the F435W+F814W ACS images several bright star clusters can be seen just outside the more heavily obscured nuclear region, and these are likely sources of ionizing photons.

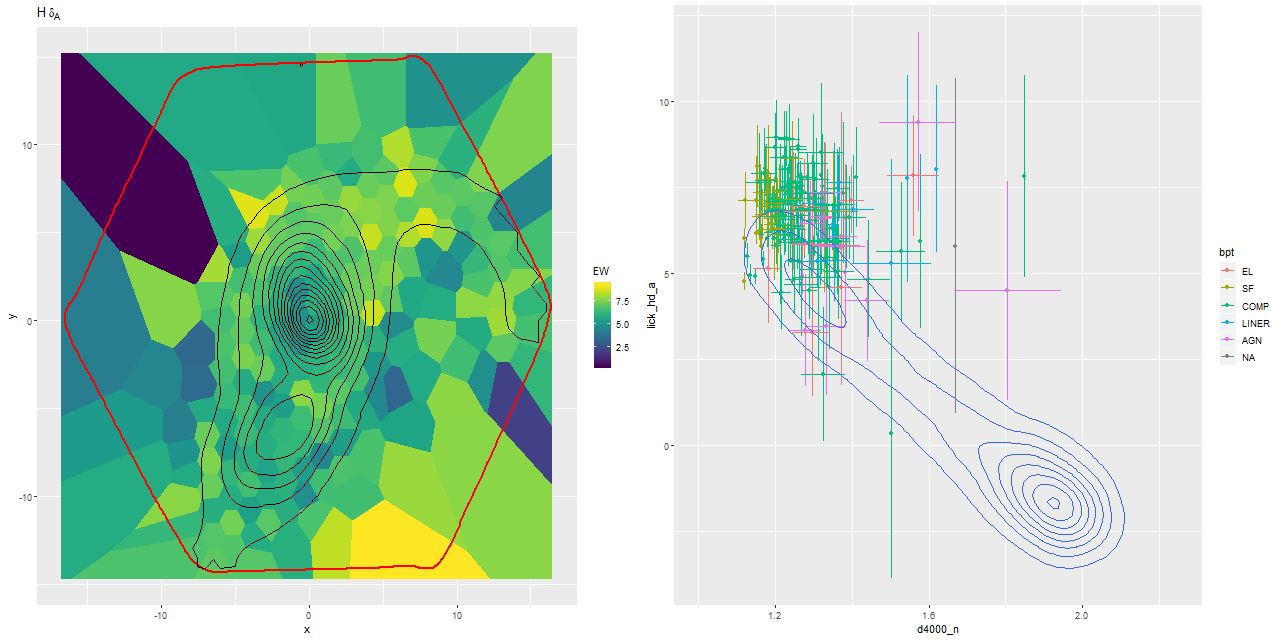
Finally turning to the other component of the selection criteria, here is a map of the (pseudo) Lick HδA index and a plot of the widely used HδA vs Dn(4000) diagnostic. It’s a little hard to see a clear pattern in the map because this is a rather noisy index, but strong Balmer absorption is seen pretty much throughout, with the highest values outside the two nuclei and especially along the northern tidal tail.
Location in the Hδ – D4000 plane doesn’t uniquely constrain the star formation history, but the contour plot taken from a largish sample of SDSS spectra from the NGP is clearly bimodal, with mostly starforming galaxies at upper left and passively evolving ones at lower right, with a long “green valley” in between. Simple models of post-starburst galaxies will loop upwards and to the right in this plane as the starburst ages before fading towards the green valley. This is exactly where most of points in this diagram lie, which certainly suggests an interesting recent star formation history.

I’m going to end with a bit of speculation. In simulations of gas rich major mergers the progenitors generally complete 2 or 3 orbits before final coalescence, with some enhancement of star formation during the perigalactic passages and perhaps some ebbing in between. This process plays out over hundreds of Myr to some Gyr. What I think we are seeing now is the 2nd or third encounter of this pair, with the previous encounters having left an imprint in the star formation history.
I’ve done SFH modeling for this binning of the data, and also for data binned to higher SNR and modeled with higher time resolution models. Next post I’ll look at these in more detail.
