
A paper showed up on arxiv in early August titled “An early-type galaxy with an inner star-forming disk” by Li et al. (article id 1808.01730) that describes a system observed by MaNGA that’s rather similar to the one I have been writing about in recent posts, namely an apparent post-merger ETG with ongoing star formation. The paper is a little light on details, but it’s refreshingly short and not technically demanding. Unfortunately their discovery claim is incorrect: this galaxy was identified as a star forming elliptical in Helmboldt (2007), who also measured its HI mass to be 5.4±0.5 × \(10^8 \mathsf{M}_{\odot}\), about 5% of its baryonic mass.
Of course I did my own analysis which I’ll summarize in this post, also filling in some details missing from the paper. The first step in my analysis is to compute a velocity field (actually what I compute are redshift offsets, but these are easily converted to line of sight velocities). One of the first things I noticed is that while this is qualitatively similar to the one published by Li et al. (and shown twice!), the rotating inner component has nearly 3 times the maximum rotation velocity as their stellar velocity map.
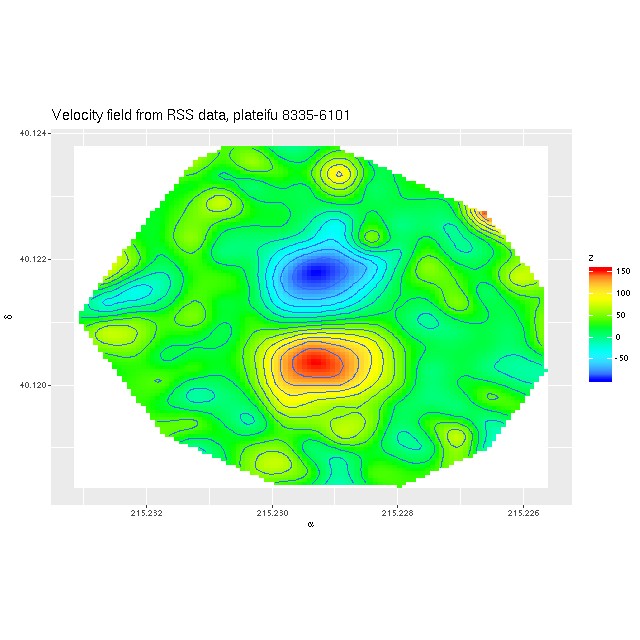 Velocity field estimated from RSS data
So, naturally concerned that there was an error in my processing of the RSS data I downloaded the data cube and ran my code on that, getting the velocity field shown below on the left, which is evidently nearly identical.
Recall that my redshift offset measurement routine does template matching very similar to the SDSS spectro pipeline, using for templates a set of eigenspectra from a principal components analysis of a largish set of SDSS single fiber spectra from a high galactic latitude sample. These naturally encode information about both emission and absorption lines, with the code returning a single blended estimate. This works fine when ionized gas and stars are kinematically tightly coupled, but not so well when they’re not. Suspecting that emission lines were dominating the velocity estimates in the inner regions, as something of a one-off experiment I masked the area around emission lines in the galaxy spectra and reran the routine, getting the velocity field on the right.
Now this agrees in some detail with the stellar velocity field published by Li et al. (visual differences are mostly due to different color palettes). So an interesting first result is that not only is there a rotating, kinematically decoupled core but the stars and ionized gas within the core are decoupled from each other. This would seem to point to a recent injection of fresh cold gas.
Unfortunately they only published the stellar velocity field even though the official data analysis pipeline calculates separate ones for stars and gas, so I won’t be able to verify this result until value added kinematic data is made available.
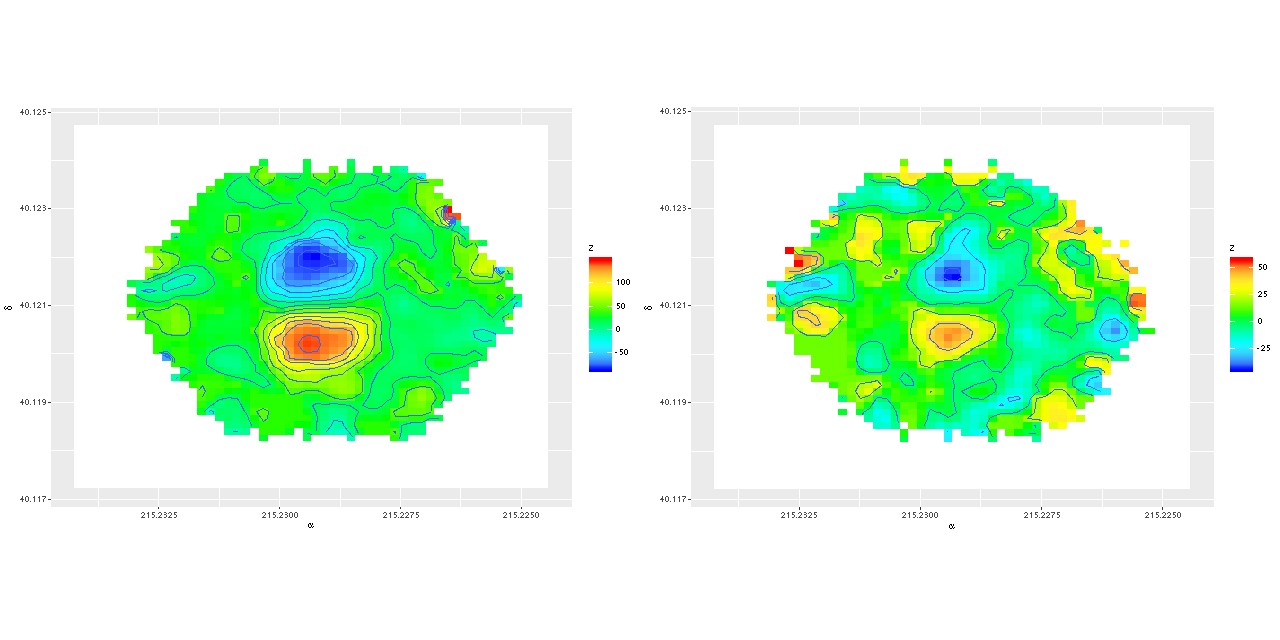 (L) Velocity field estimated for data cube
(R) Stellar velocity field
For reference here is the spectrum from the central fiber. Wavelengths are vacuum rest frame and fluxes are corrected for foreground galactic extinction.
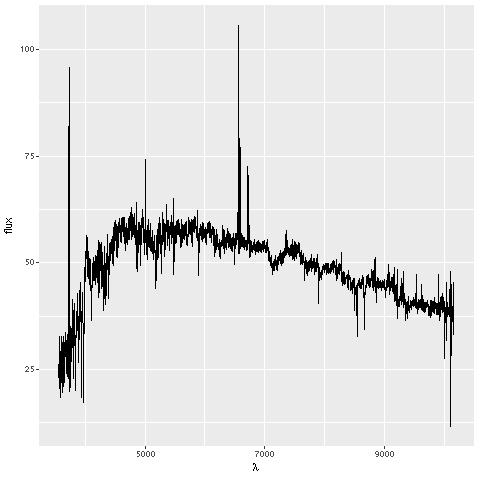 Central fiber spectrum, plateifu 8335-6101
As with the previous galaxy I did two sets of star formation history models. The first set a low S/N threshold for binning spectra and used an 81 SSP model subset of EMILES for fitting. For the second run I bin to a considerably higher target S/N and fit with the larger 216 SSP model set with the full BaSTI time resolution. The second data set has 25 coadded spectra with mean S/N per pixel ranging from 18-60.
For a quick comparison of the two sets of runs here are model mass growth histories summed over all spectra. Both indicate that a very substantial burst of star formation occurred beginning ~1.25Gyr ago (curiously, this is the same time as the initial burst in the galaxy KUG 0859+406 that I previously wrote about — part 1, part 2, part3). The present day stellar mass is just under \(1 times 10^{10} mathsf{M}_{odot}\), in agreement with the value cited by Li et al.
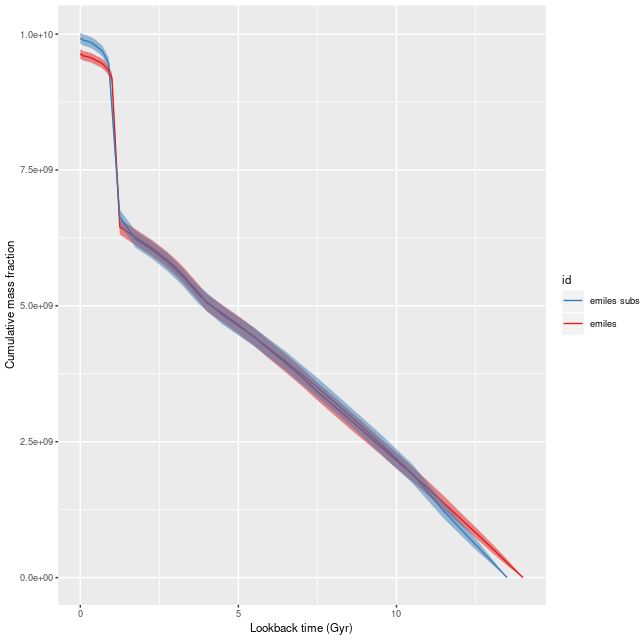 Summed model mass growth histories, emiles subset and “full” emiles
I find that ongoing star formation is largely confined to the KDC, in agreement with Li et al., so after running the models for the 25 bins I partitioned them into a core set and an outer set, with the core set comprising the bins within about 4×2″ (1.5 x 0.75 kpc semi-major and semi-minor axes) of the nucleus as shown below.
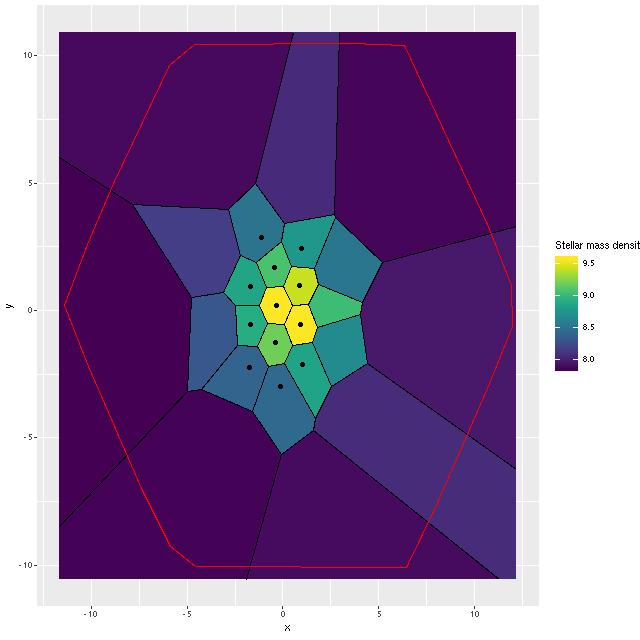 Stellar mass density for binned data, showing outlines of bins and core region
The summed star formation history models are shown below. As with my previous subject there was a galaxy wide burst of star formation ~1Gyr ago, but unlike it star formation declined monotonically after that, with no more recent secondary burst. The ongoing star formation in the central region is seen to be a relatively recent (last ~100Myr) uptick. This leads me to a slightly different interpretation of the data — the authors suggest that we are seeing the late stages of a gas rich major merger. I would say rather that the merger was completed ~1Gyr ago and that gas has recently been recaptured. This is consistent with simulations that show in the absence of AGN feedback star formation can proceed for some time after a merger. It’s also consistent with the observed reservoir of neutral hydrogen, which is sufficient to fuel star formation at the current level for another ~1Gyr.
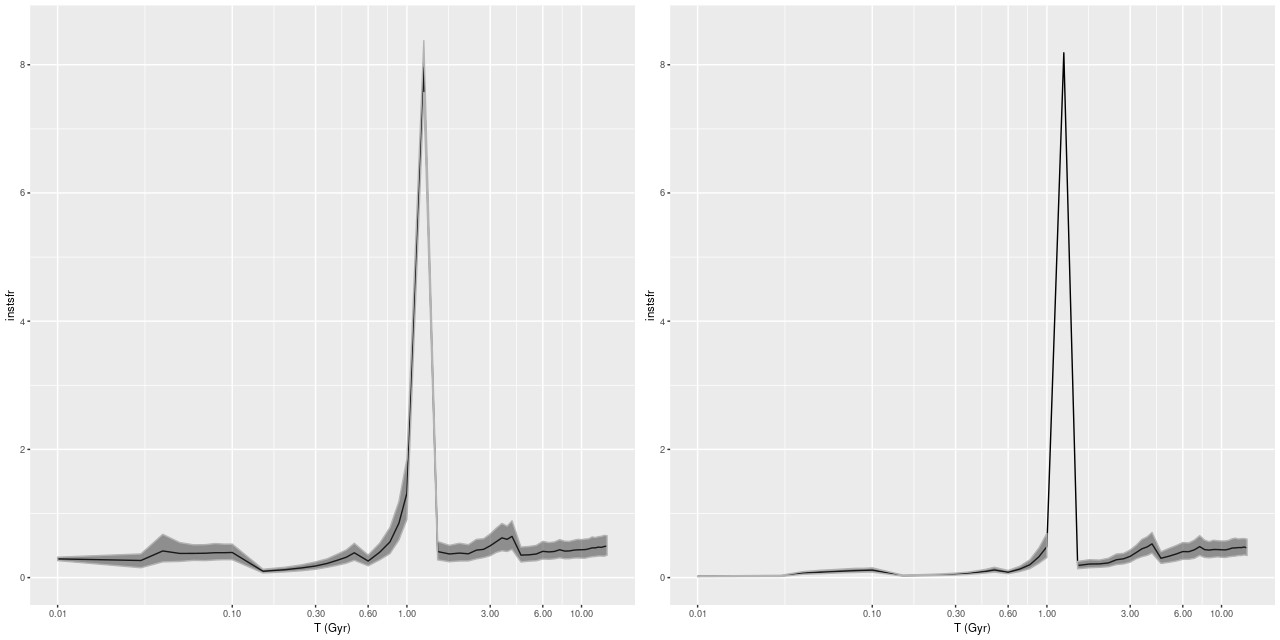 (L) Model Star formation history, inner core
(R) Star formation history, outside core
Here are some additional results of the analysis of the 25 binned spectra. All of these agree with Li et al. where comparable results are displayed.
First, the Hδ absorption line index vs. 4000Å break strength index Dn(4000):
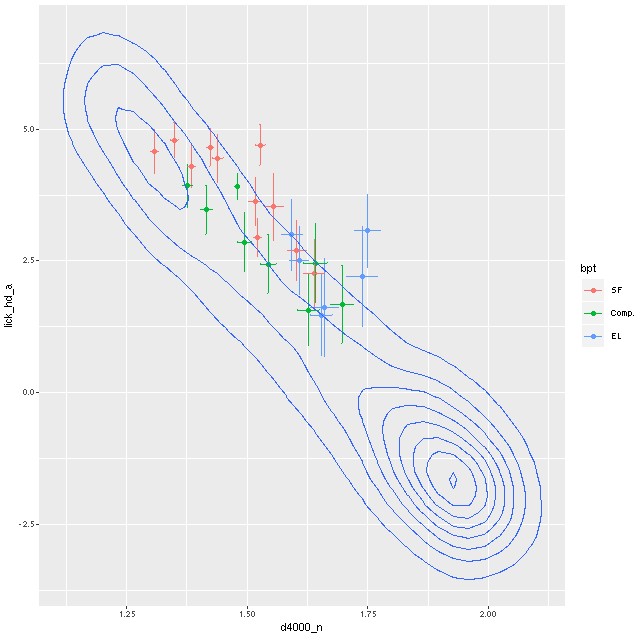 Lick HδA vs. Dn(4000)
Contour lines are my measurements of a sample of ~20K single fiber SDSS spectra. As with many quantities there is a distinct bimodality in this distribution, with star forming galaxies at upper left and passively evolving, mostly early type galaxies at bottom right. If star formation were to stop today there would be no K+A phase in this galaxy. A 1Gyr population has already passed its peak Balmer line strength, so if there was a K+A phase it was in the past.
Turning to emission lines, here are the 3 BPT diagnostic diagrams that are most commonly used with SDSS spectra. The curved lines are the starforming/something else demarcation lines of Kewley et al. 2006. In spatially resolved spectroscopy these lines seem not so useful. I find, in agreement with Li et al., that many of the spectra have “composite” line ratios, but except for the central fiber these are mostly near the edge or outside the KDC. The bottom right panel below shows the trend with radius of the [S II]/Hα line ratio (the other two show similar but weaker trends). This trend is the opposite of what we’d expect if an AGN were the ionizing source. Shocks or hot evolved stars are more likely.
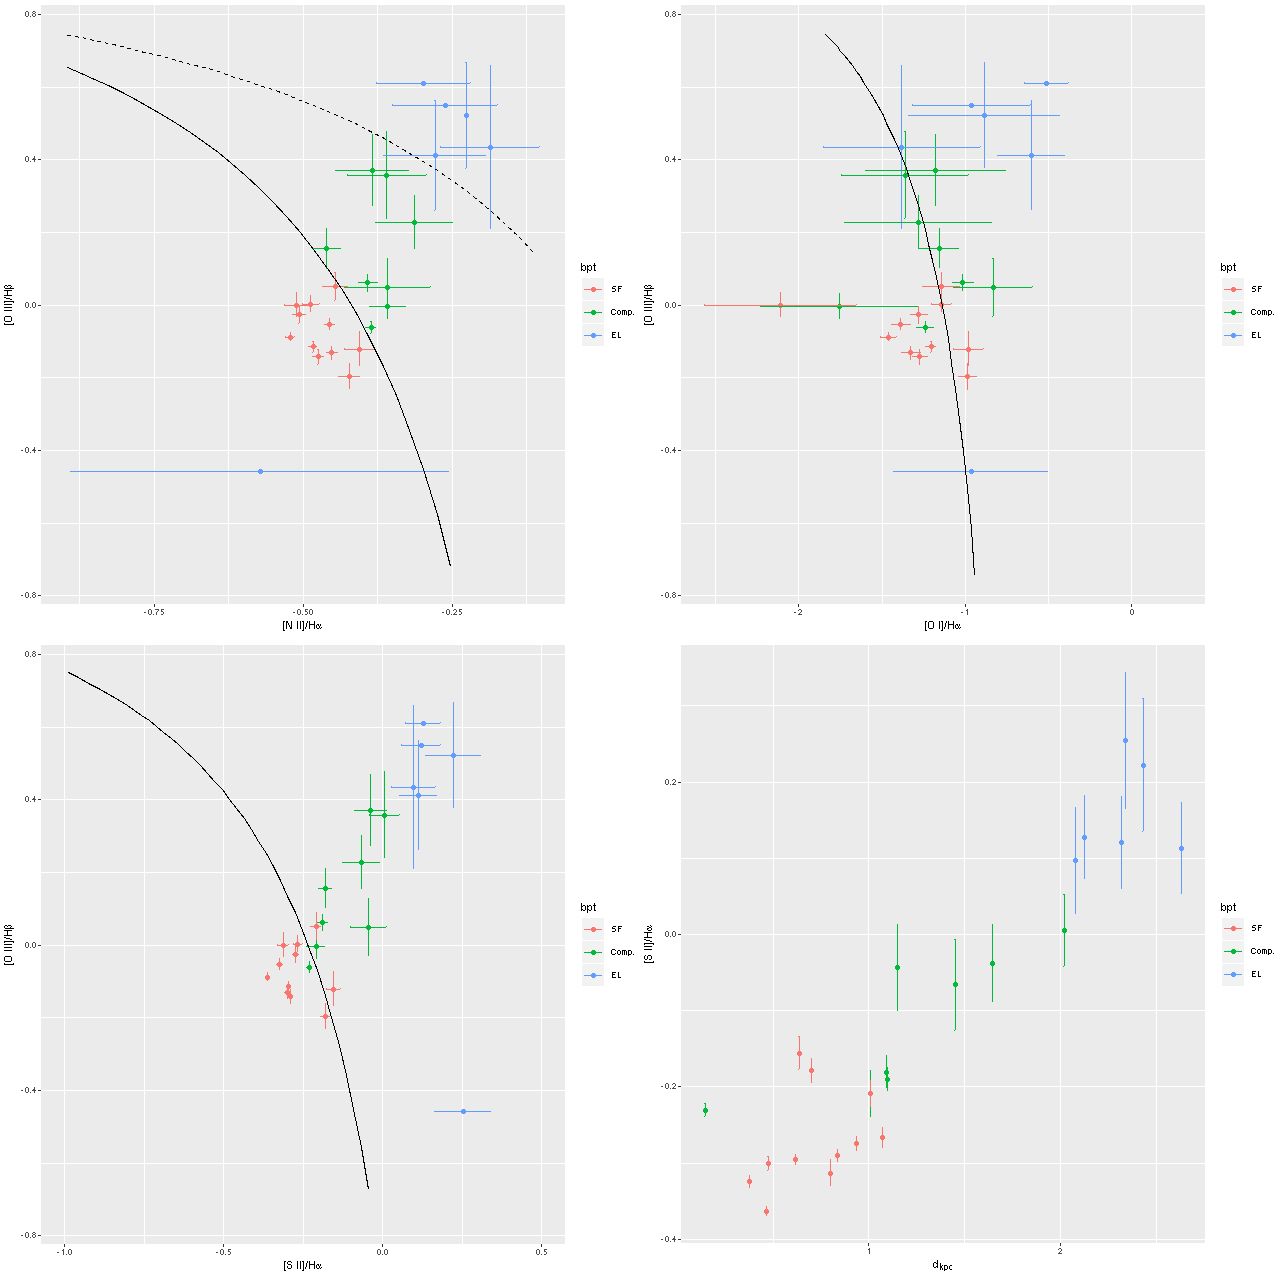 Emission line diagnostic (BPT) plots
TL: [N II]/Hα vs [O III]/Hβ
TR: [O I]6300/Hα
BL: [S II]/Hα
BR: trend of [S II]/Hα with radius
I estimate a 100Myr average star formation rate from the SFH models. The log of the star formation rate density (in \(\mathsf{M}_{\odot}/\mathsf{yr/kpc}^2\)) is plotted against log stellar mass density (in \(\mathsf{M}_{\odot}/\mathsf{kpc}^2\)) below (the line is the estimate of the SF main sequence of Renzini and Peng 2015). Again in agreement with Li et al. the areas of highest SFR lie near the SF main sequence, while the outskirts of the IFU footprint fall below it. 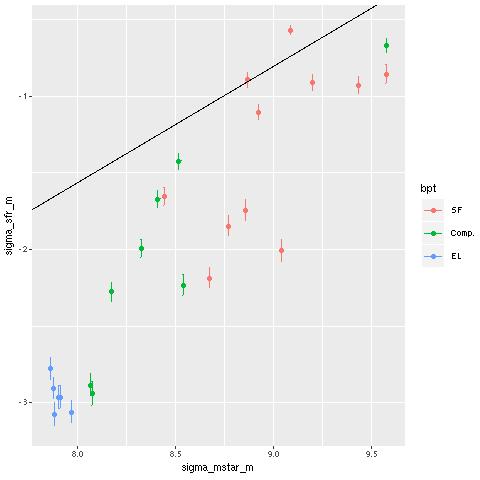 log SFR density vs. log stellar mass density
The radial trend of star formation rate is shown below on the left. On the right is my estimate of SFR density plotted against Hα luminosity density along with the calibration of Moustakis et al. Hα is corrected for attenuation using the Balmer decrement.
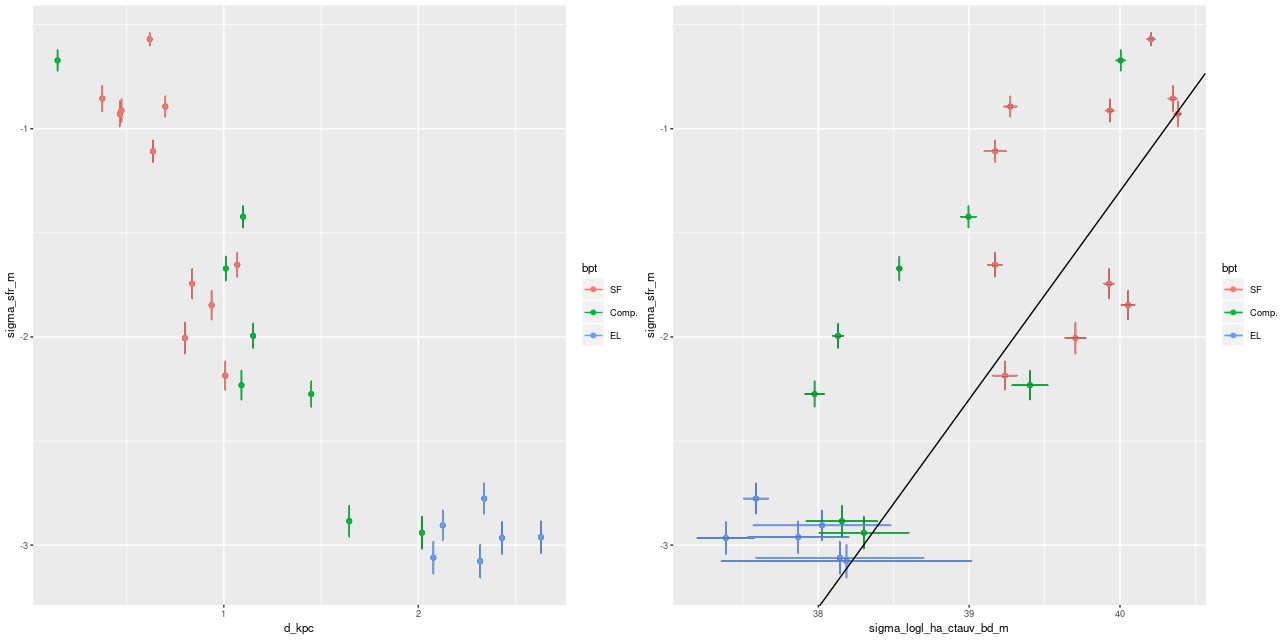 (L) log SFR density vs. radius
(R) log SFR density vs. attenuation corrected log Hα luminosity density
By the way my models directly estimate dust attenuation of the stellar light, typically assuming a Calzetti attenuation curve. A comparison with attenuation estimated with the Balmer decrement is shown below. To anyone familiar with SDSS spectra it’s not too surprising that estimates from the Balmer decrement have a huge amount of scatter due mostly to the fact that Hβ emission line strength is often poorly constrained. Despite that there is a clear positive correlation between these two estimates. I will probably examine this relationship in more detail in a future post, perhaps based on more favorable data.
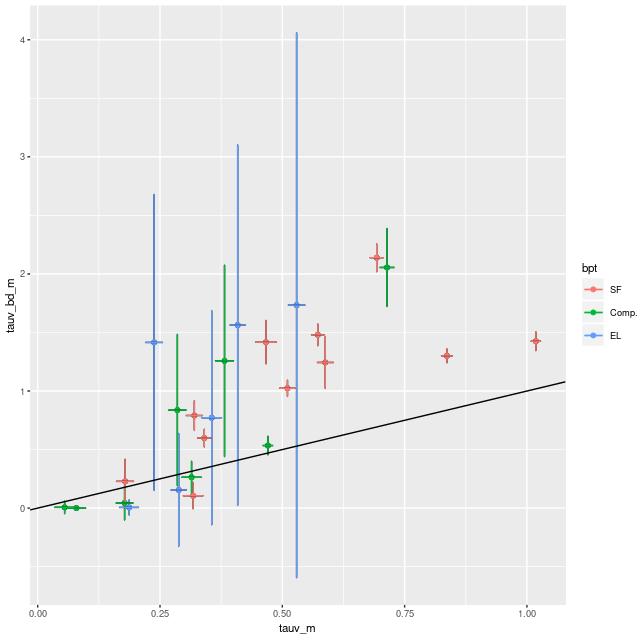 τV estimated from Balmer decrement vs SFH model estimates
Finally, trend with radius of the metallicity 12+log(O/H) estimated with the strong line O3N2 method. As with the post merger galaxy in the previous posts there is a hint of a weak negative gradient. Overall the gas phase metallicity is around solar or just a little below. This is somewhat lower than my other post merger example, which is not unexpected given an approximately factor of 4 difference in stellar masses.
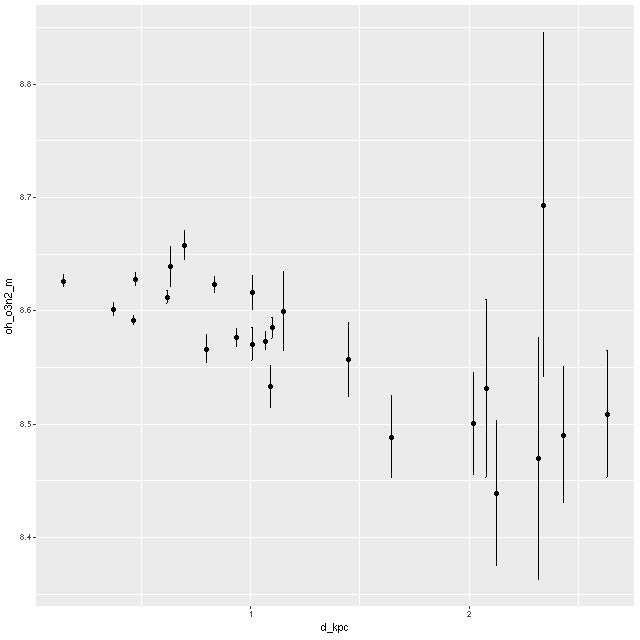 Metallicity 12+log(O/H) vs radius, estimated by O3N2 index