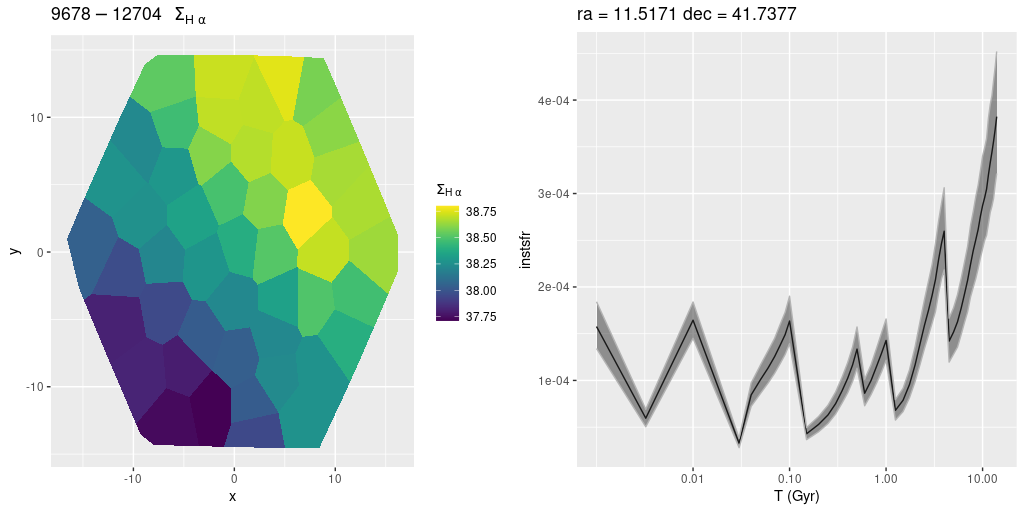
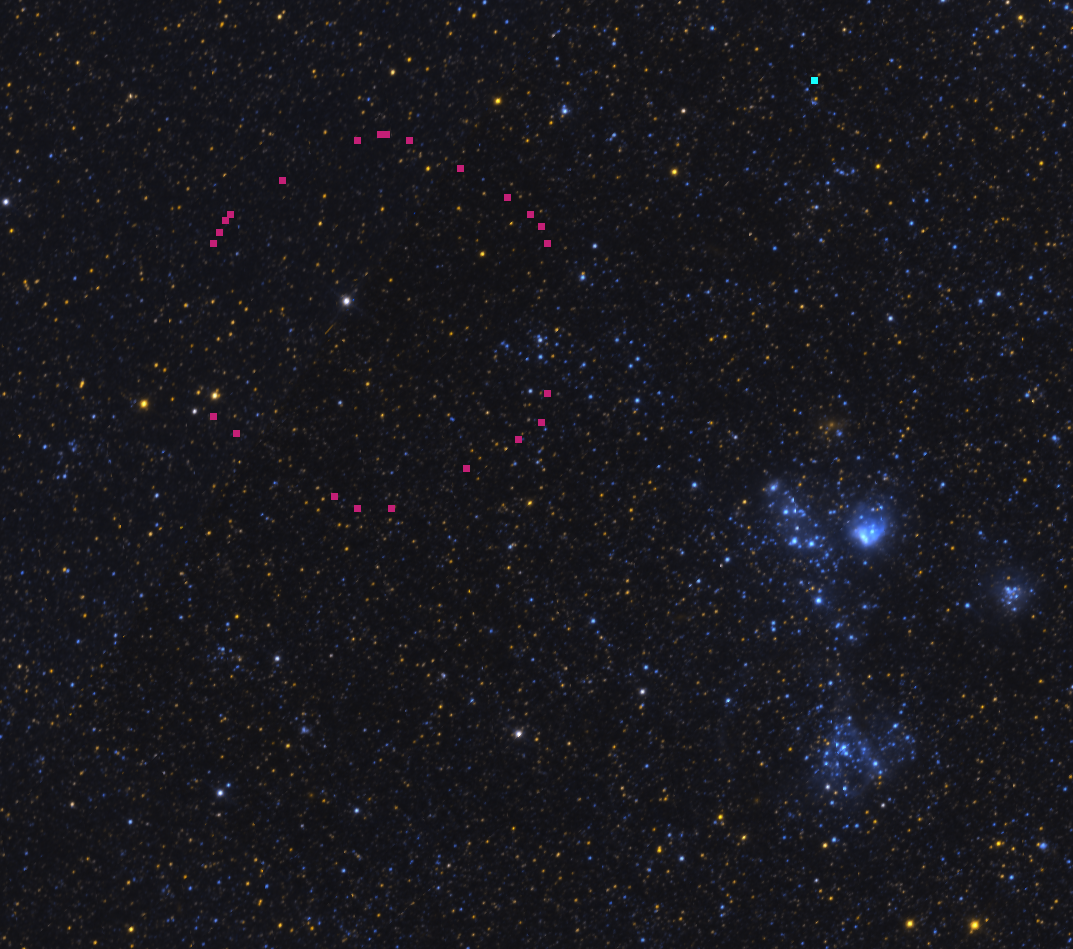
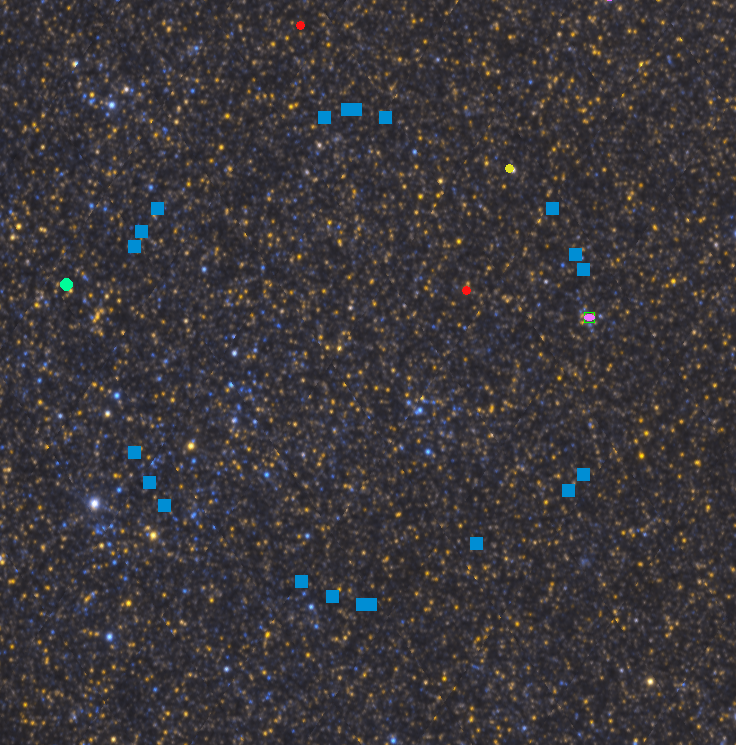
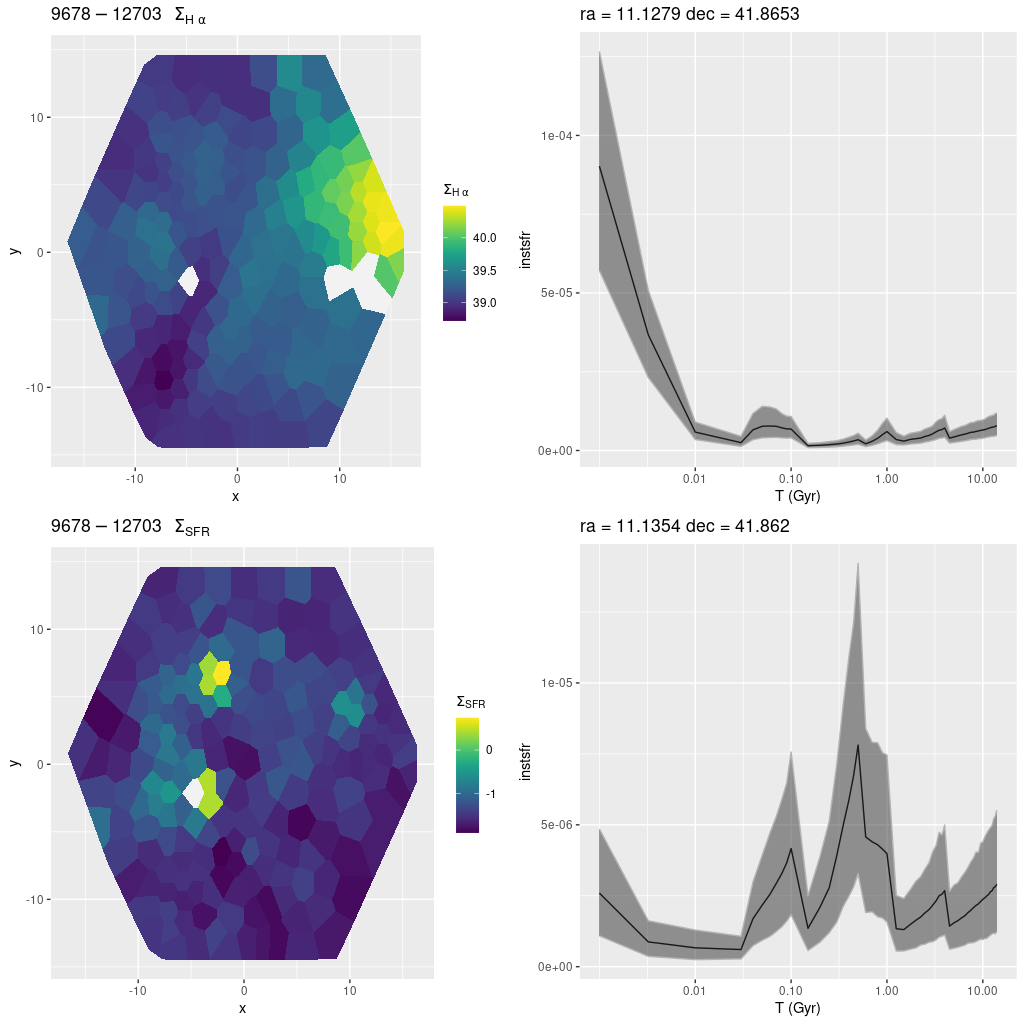
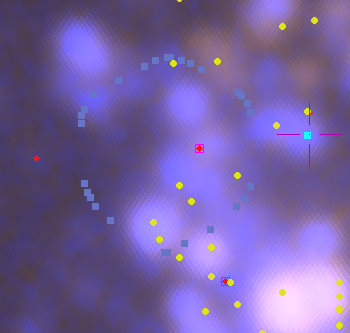
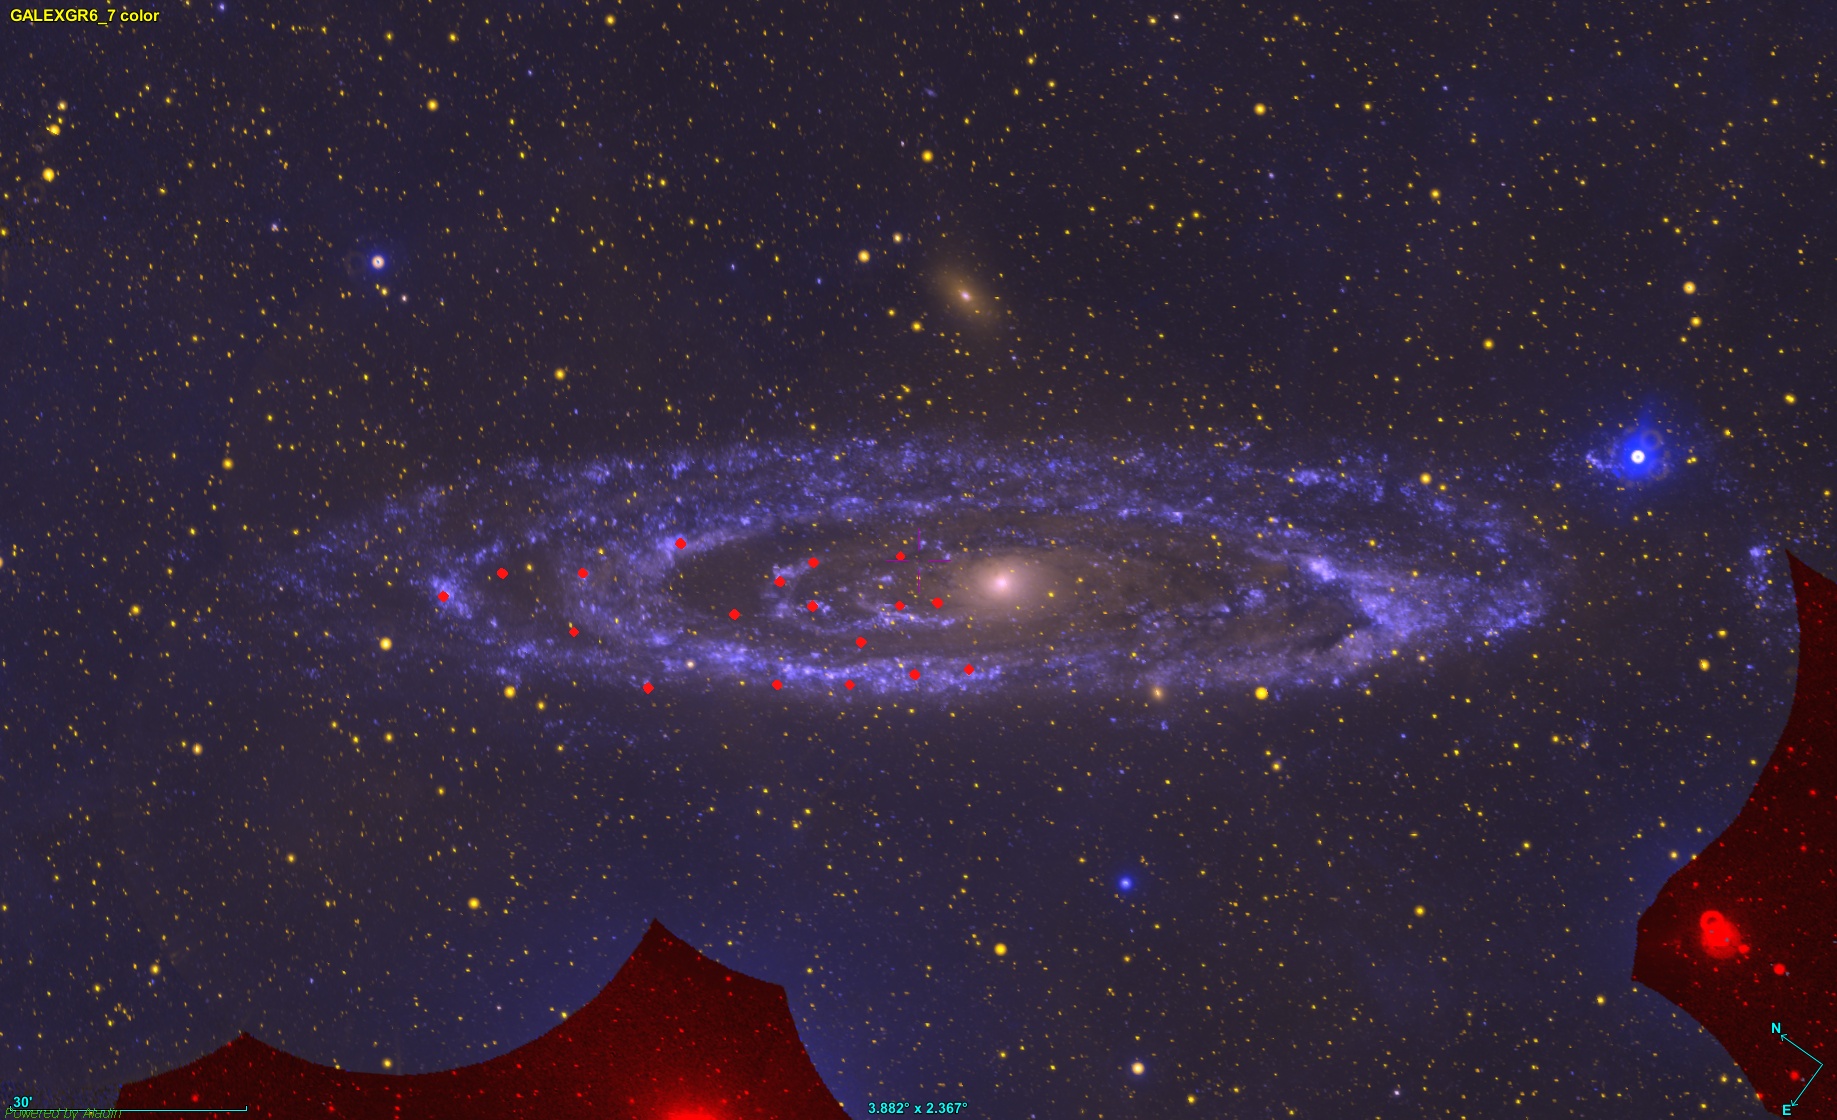
When I was doing my initial fits to the M31 MaNGA spectra I noted two that I initially thought were contaminated by foreground stars, and therefore I masked them to prevent further analysis. One of the two, in MaNGA plateifu 9677-12701 (mangaid 52-8) is a certain foreground star and won’t be discussed further. The other, in plateifu 9678-12703 (mangaid 52-23), turns out to be a luminous red supergiant that’s a genuine resident of M31. This is confirmed by two nearly contemporaneous catalogs of M31 red supergiants: the one by Ren et al. (2021) that I noted previously and Massey et al. (2021), which I stumbled upon more recently.
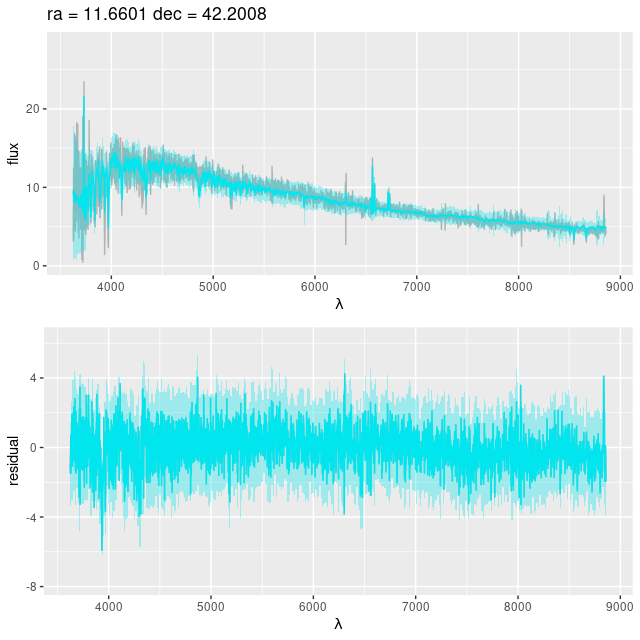
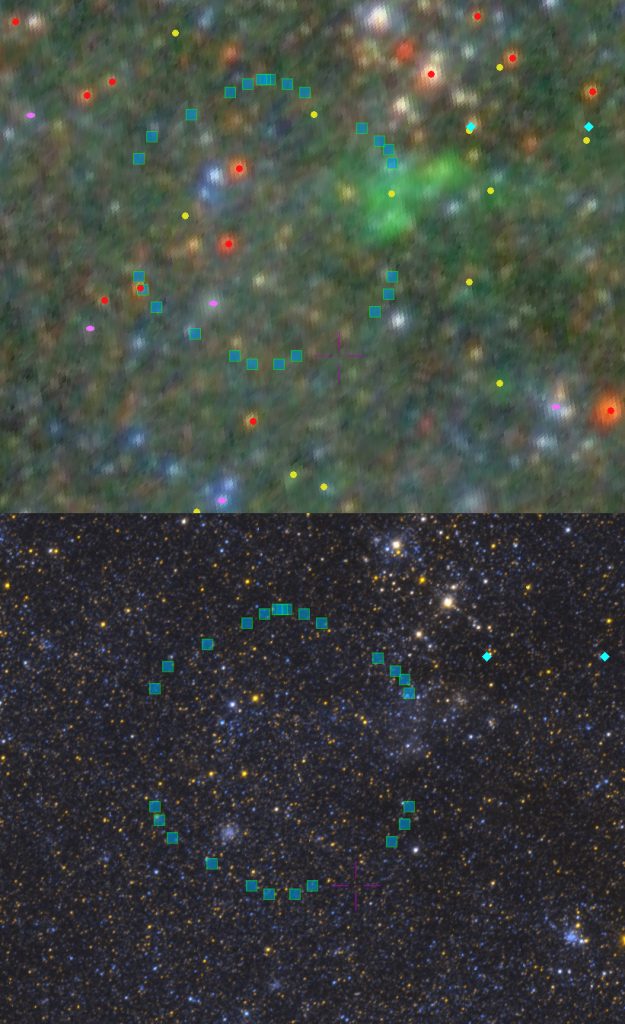
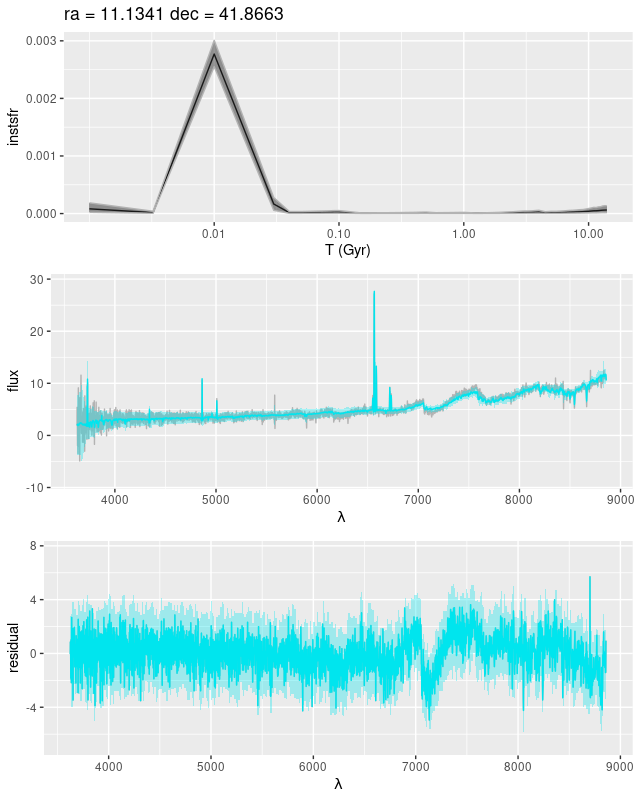
In fact there are two comparably bright red supergiants in this IFU. One that’s about 9″ north of the masked one probably should have been masked by whatever criteria I used, but it’s likely I failed to notice the fit to the data since I don’t have the patience to look at every spectrum and data fit that pops up. So, here is the spectrum, displayed in (negative) magnitudes with arbitrary zero point. The blue spectrum is the closest match in my SSP library, a 10 Myr old population with the highest metallicity I used (2.5 Z☉. This is one of the theoretical spectra from PyPopstar). This sorta looks right except it’s much too blue. The solution to that is, of course, to add some reddening through dust attenuation.
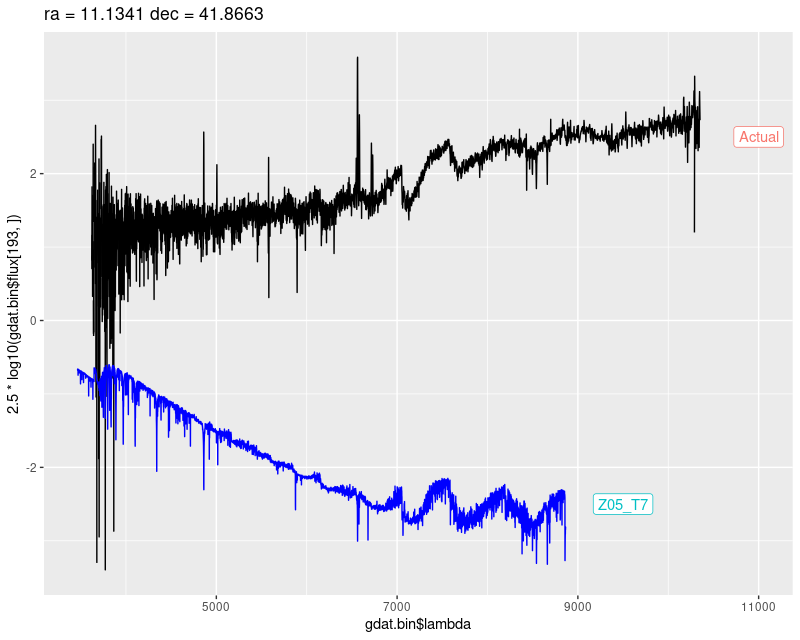
The maximum likelihood (non-negative weighted least squares) fit did just that, with only a single stellar contributor and a very high dust attenuation of τV = 3.0. This still doesn’t quite work: the residuals are rather strongly sloped in the blue and the details of the absorption features in the red aren’t quite right.
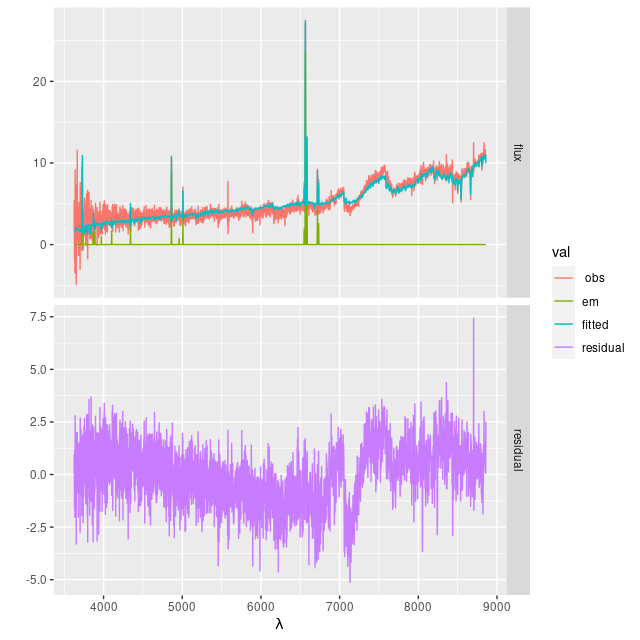
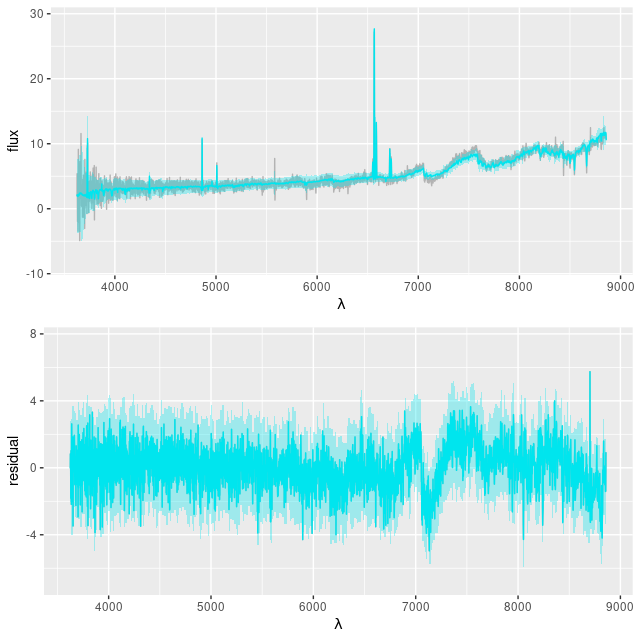
I still use a Calzetti attenuation relation in my NNLS fits. The Bayesian fits using Stan have the more flexible attenuation prescription that I described back in this post, and that helped considerably with the continuum as seen in the plot below. The absorption features in the red still aren’t fit well. The model has an even more extreme attenuation estimate with a much “grayer” than Calzetti slope, with τV = 4.38 ± 0.05 and δ = -0.33 ± 0.011see the link above for the meaning of these parameters.
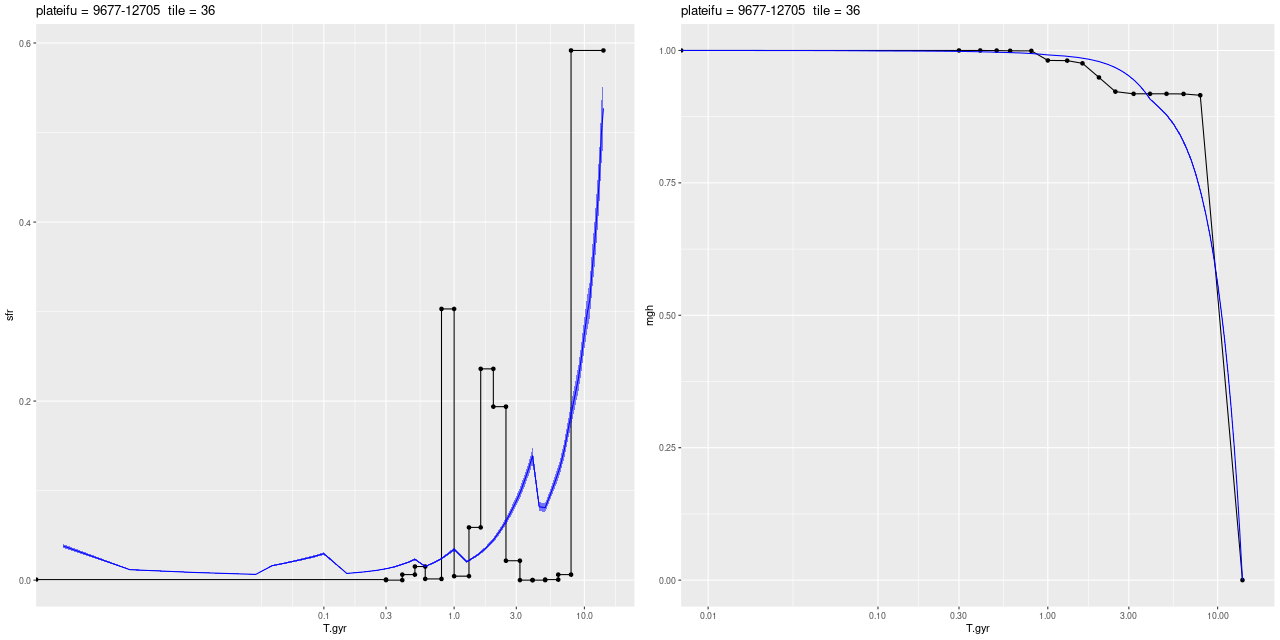
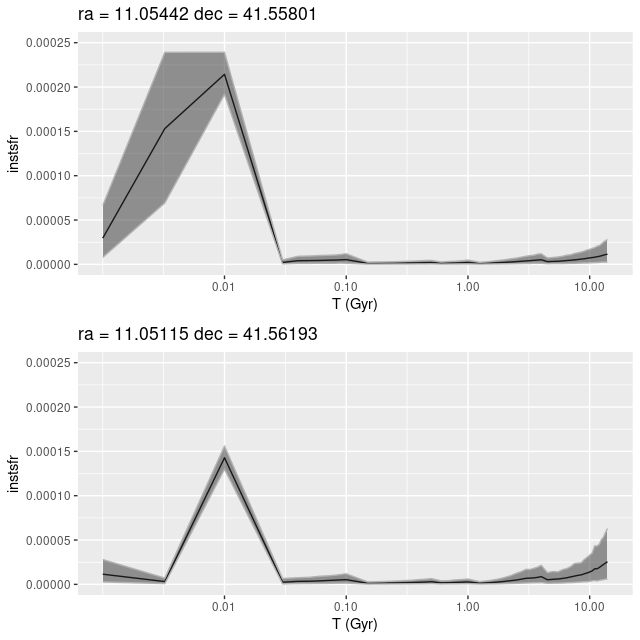
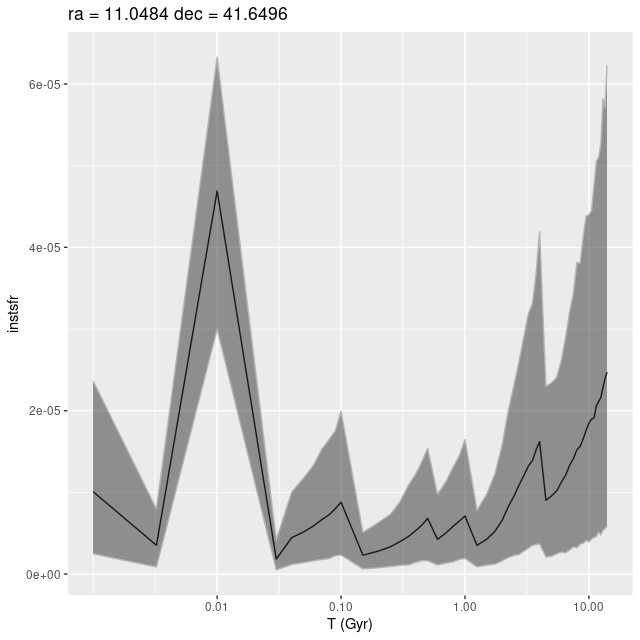
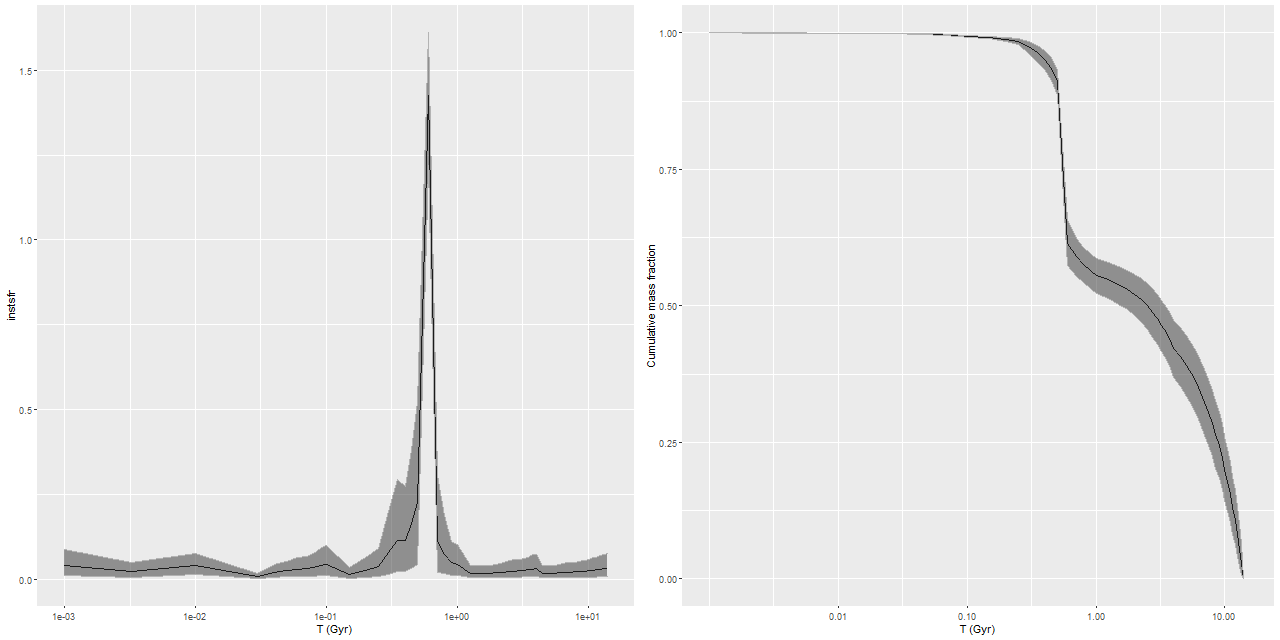
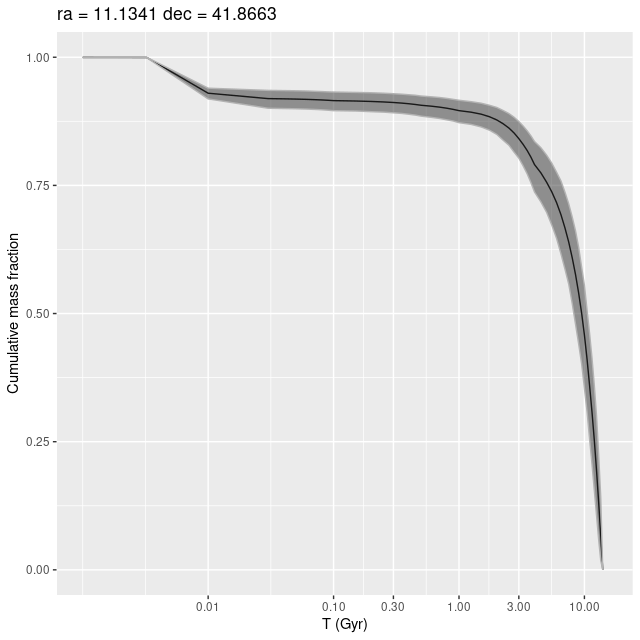
The model star formation history (displayed as a mass growth history below) isn’t completely implausible. The presence of a very luminous evolved star indicates the region is at least some Myr old, and a rapid onset and decline of star formation is typical for star forming regions in mature spirals. The recent episode of star formation added about 7% to the present day stellar mass, while at least 60% was in place by 8 Gyr ago (per the model).
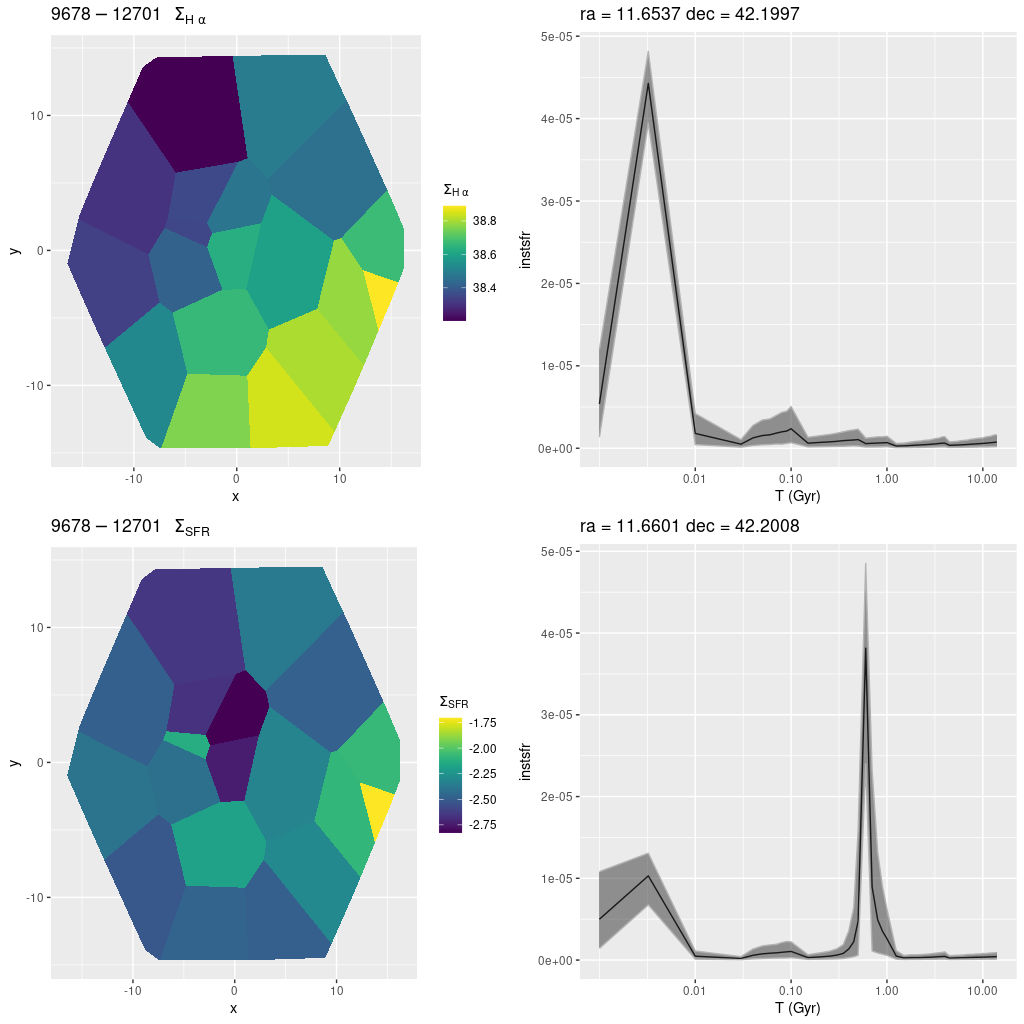
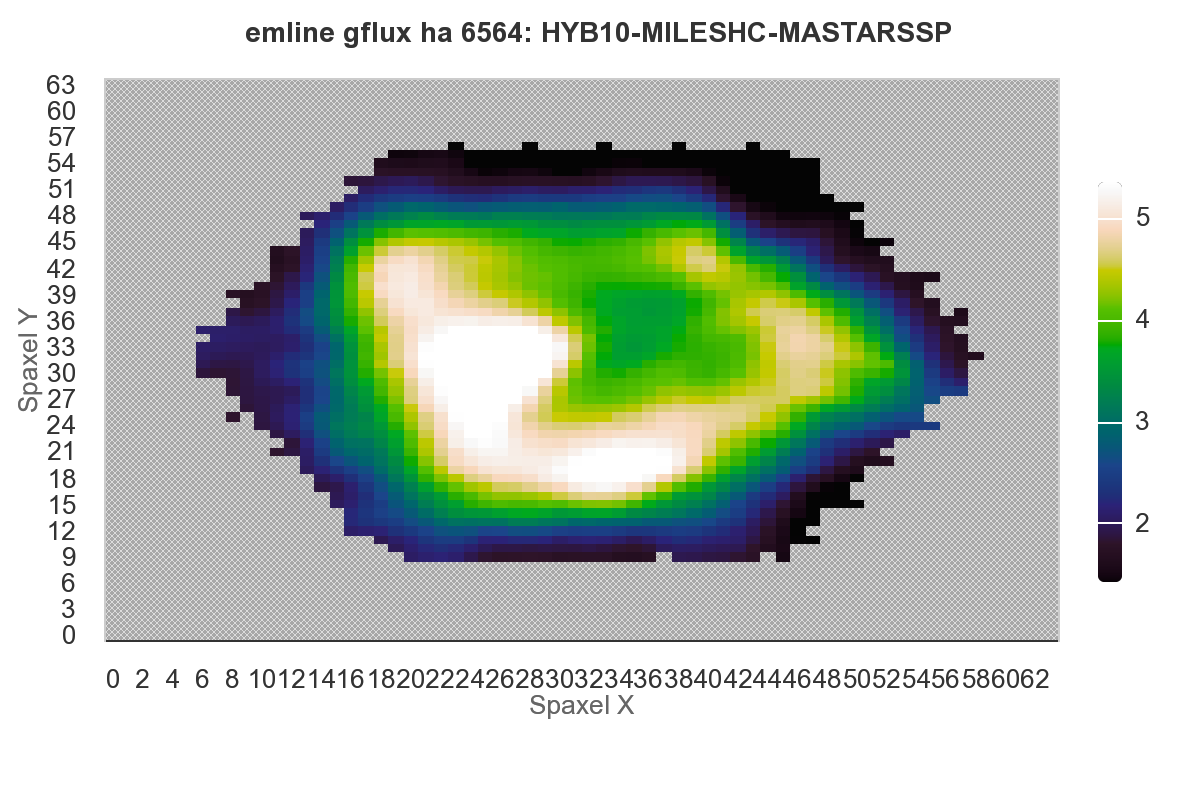
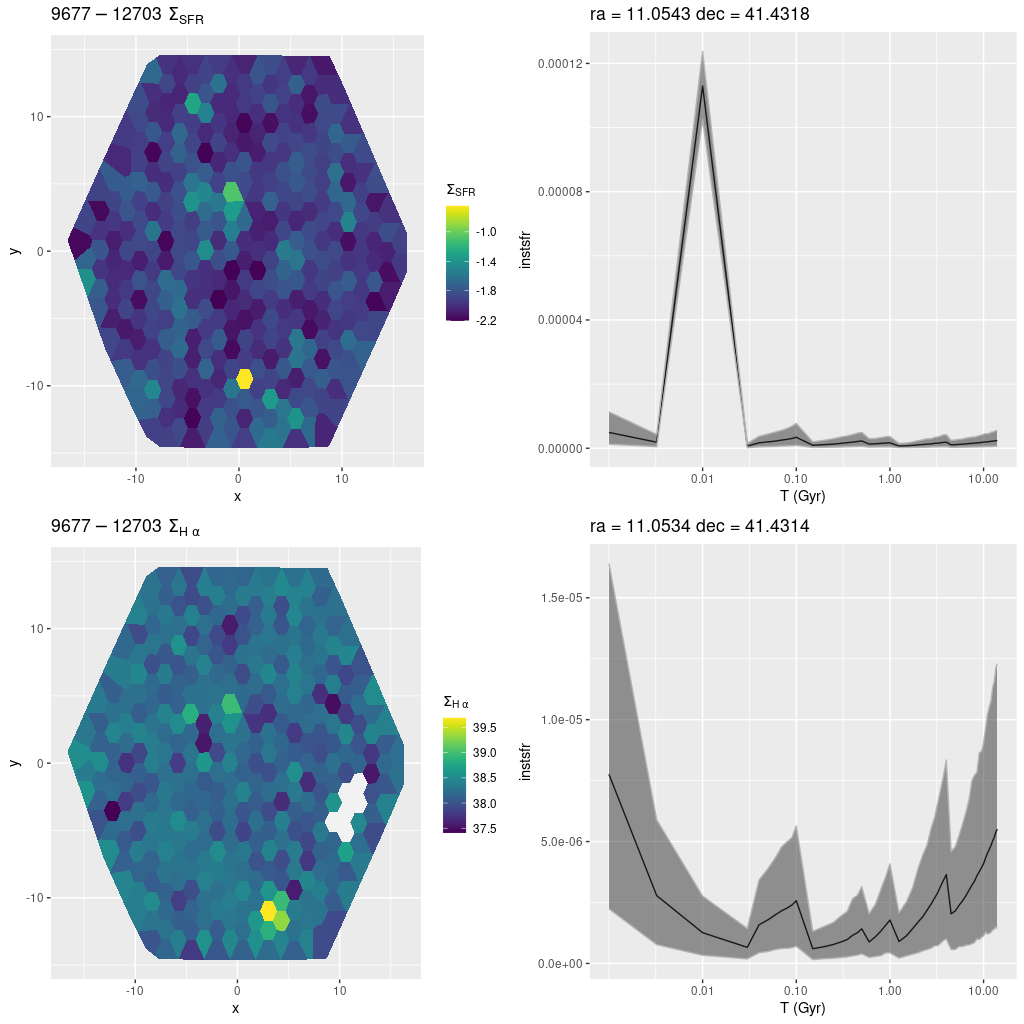
Nevertheless I consider the model results to be highly suspect, mainly based on the very large optical depth. Massey estimates the attenuation for the red supergiant to be AV ≈ 1.18, although this is apparently based on a formula rather than a direct empirical estimate. But another piece of evidence that’s close to a smoking gun is an estimate based on the Balmer decrement of emission. Despite the lack of apparent ionizing sources outside the bright H II regions in the west there is widespread diffuse emission in this region with star-forming like line ratios. The estimated optical depth derived from the Balmer decrement for this region is τV, bd = 1.47 ± 0.23 (1σ), reasonably consistent with the Massey estimate and with the values derived for the rest of the IFU.
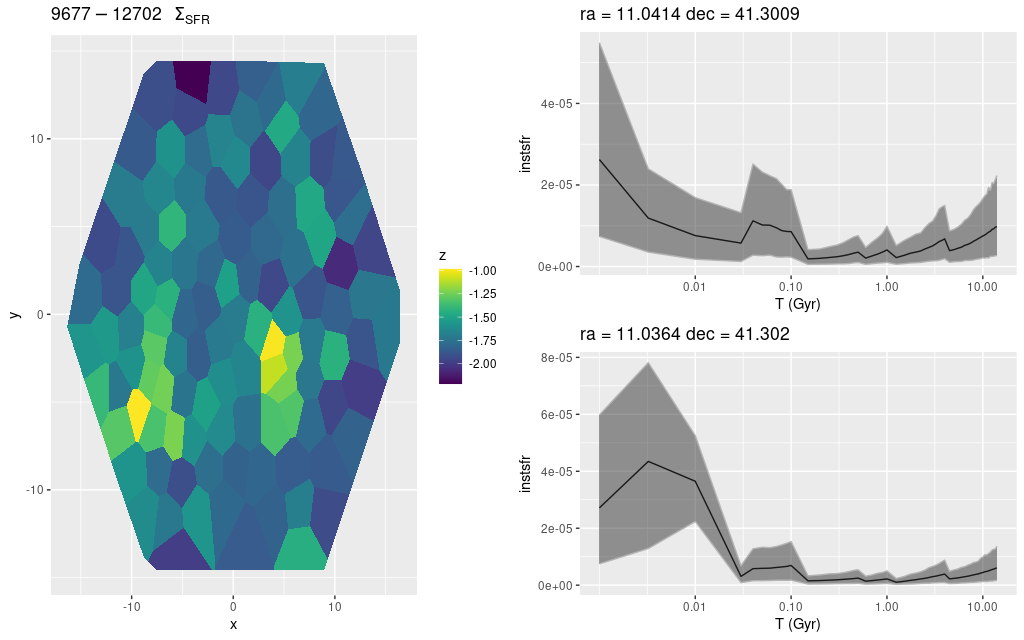
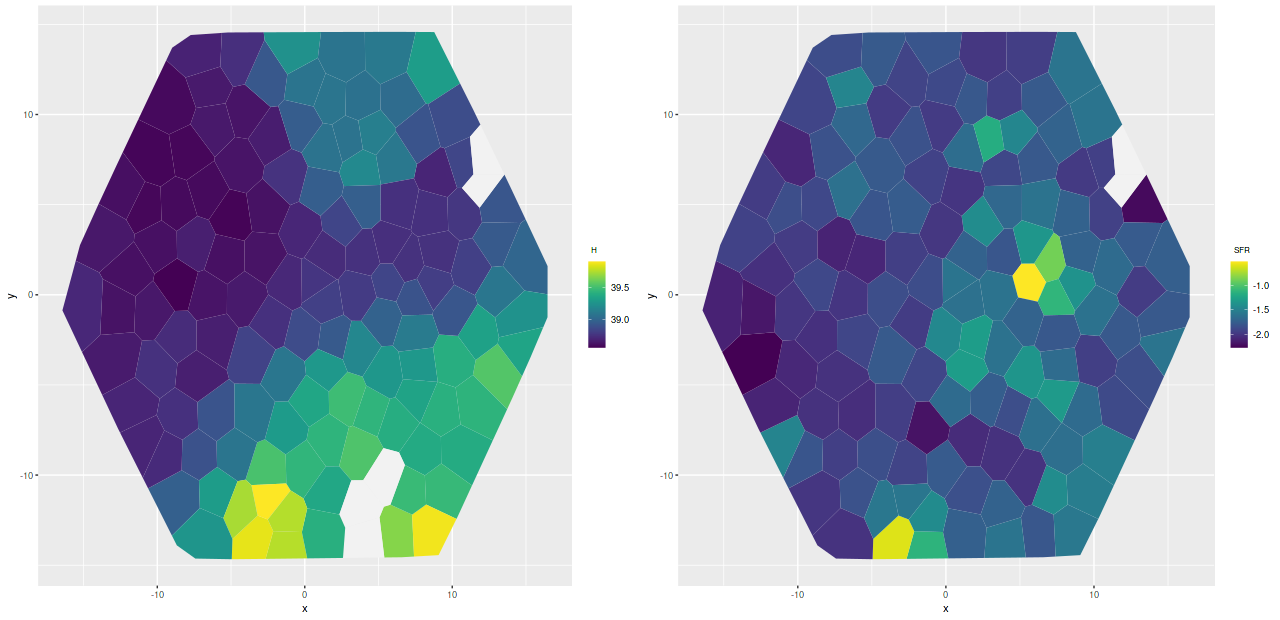
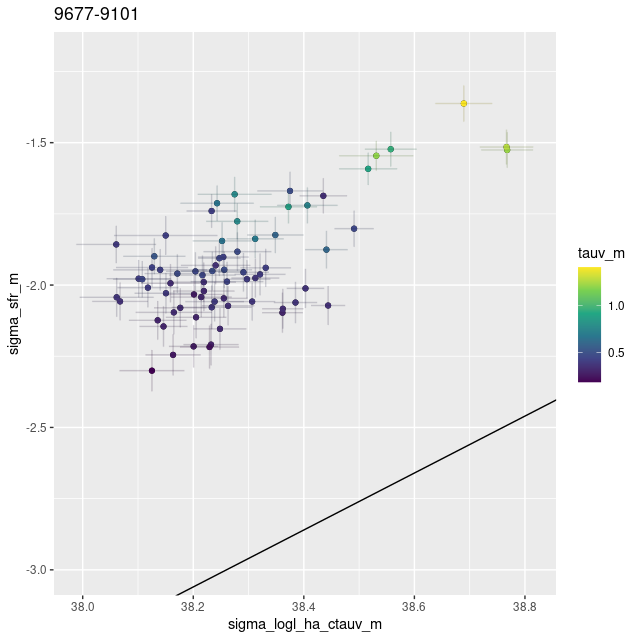
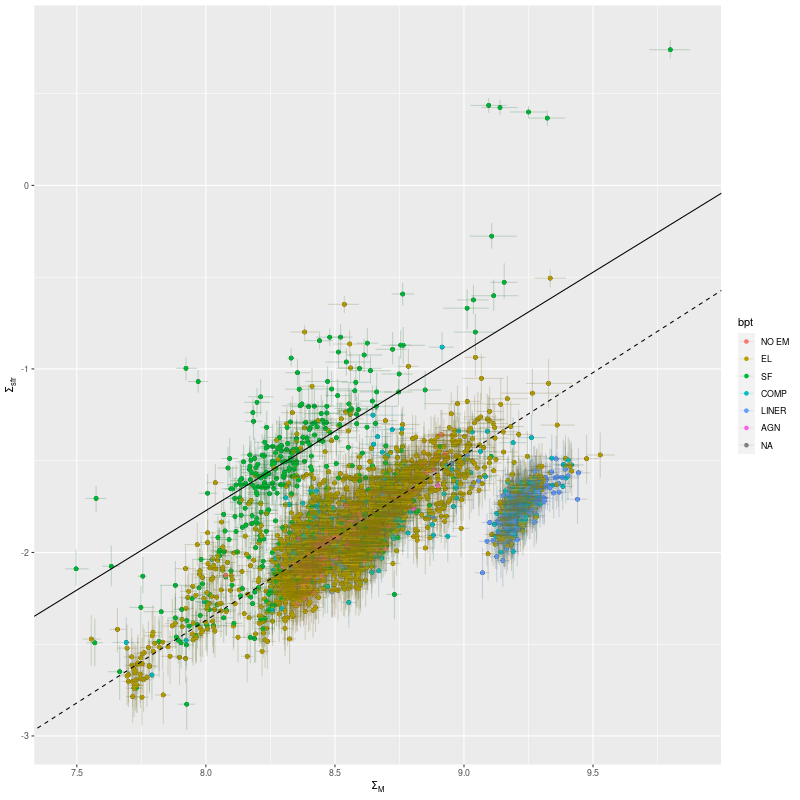
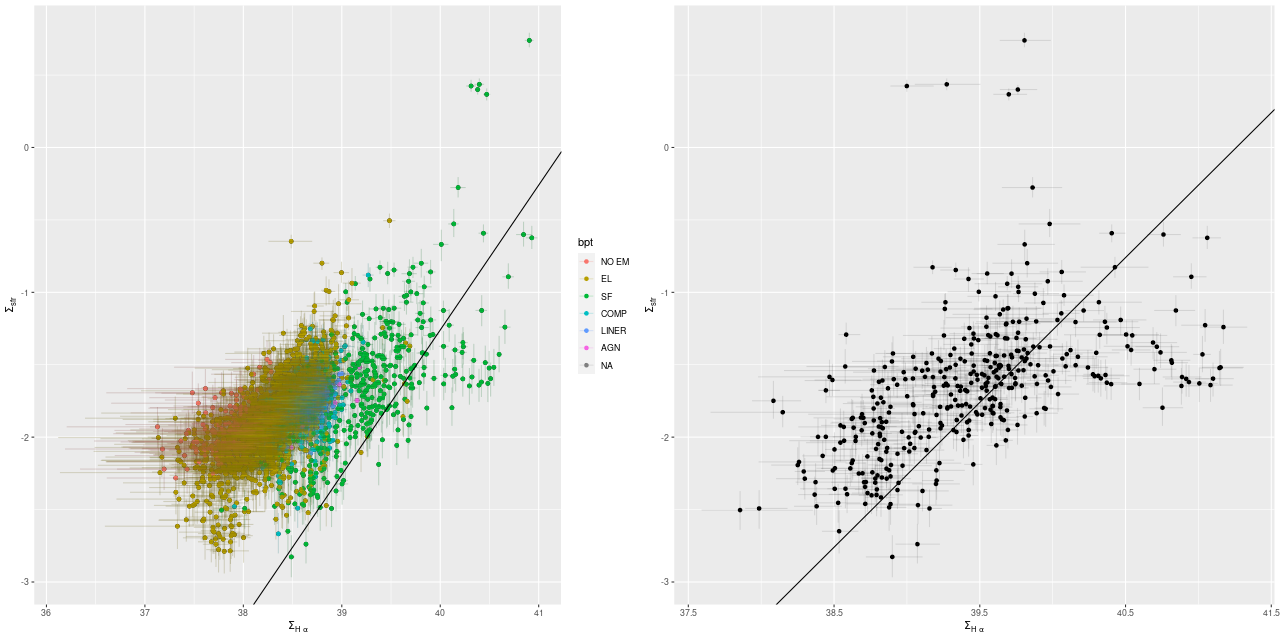
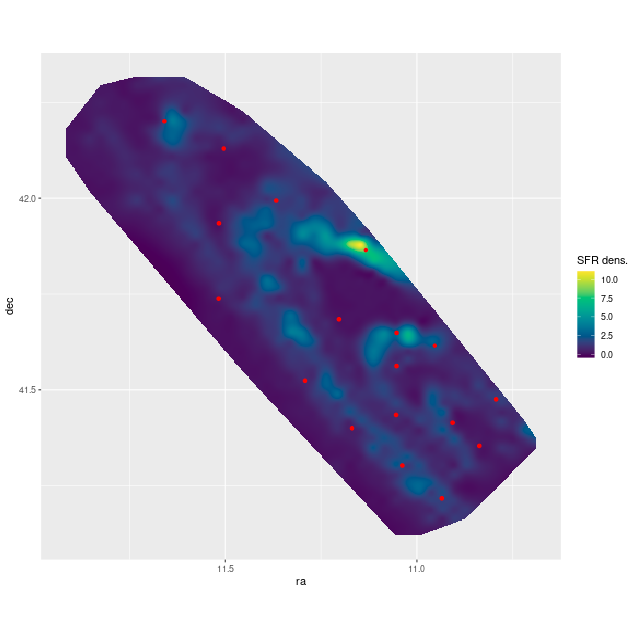
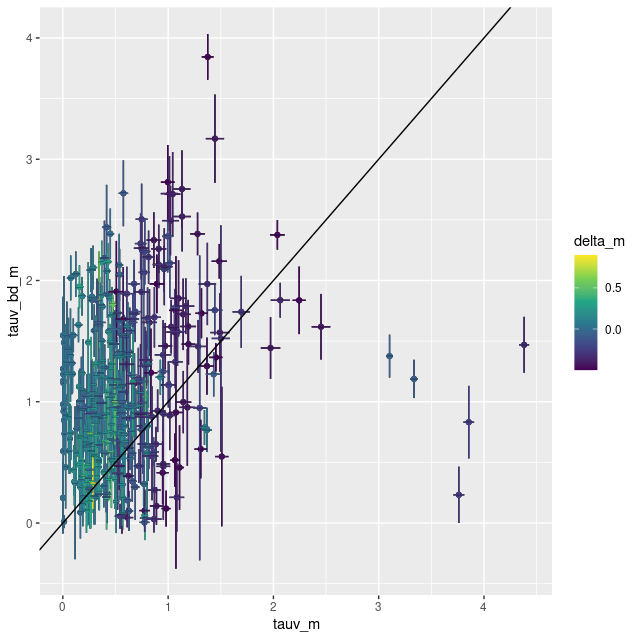
How widespread a problem is this? Below I plot the Balmer decrement derived optical depths against the stellar based estimates for all spectra in M31 MaNGA with star forming emission line ratios, about 11% of the entire sample. The 5 most extreme outliers are in this IFU in the regions surrounding the two bright red supergiants (the masked spectrum would also be in this region of the plot). The same 5 regions are also extreme outliers in the SFR vs. stellar mass and SFR vs. Hα plots that I showed early on. So, even though there are many cataloged supergiants in the study region these two appear to be uniquely bright and to have had the largest impact on model results.
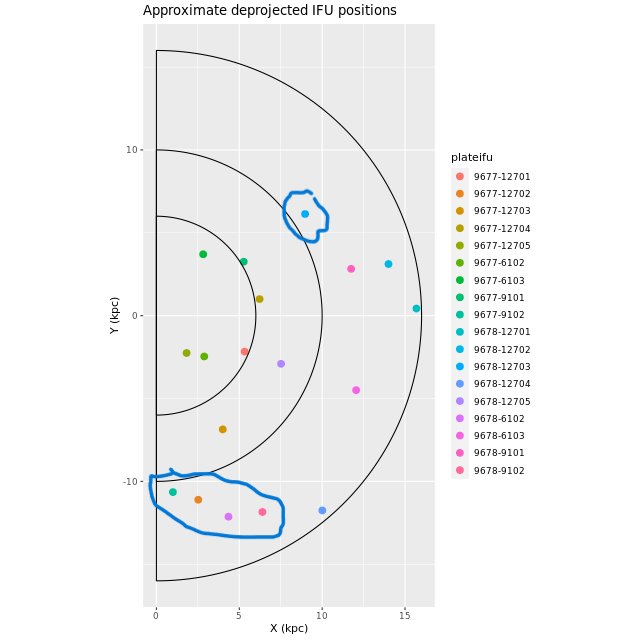
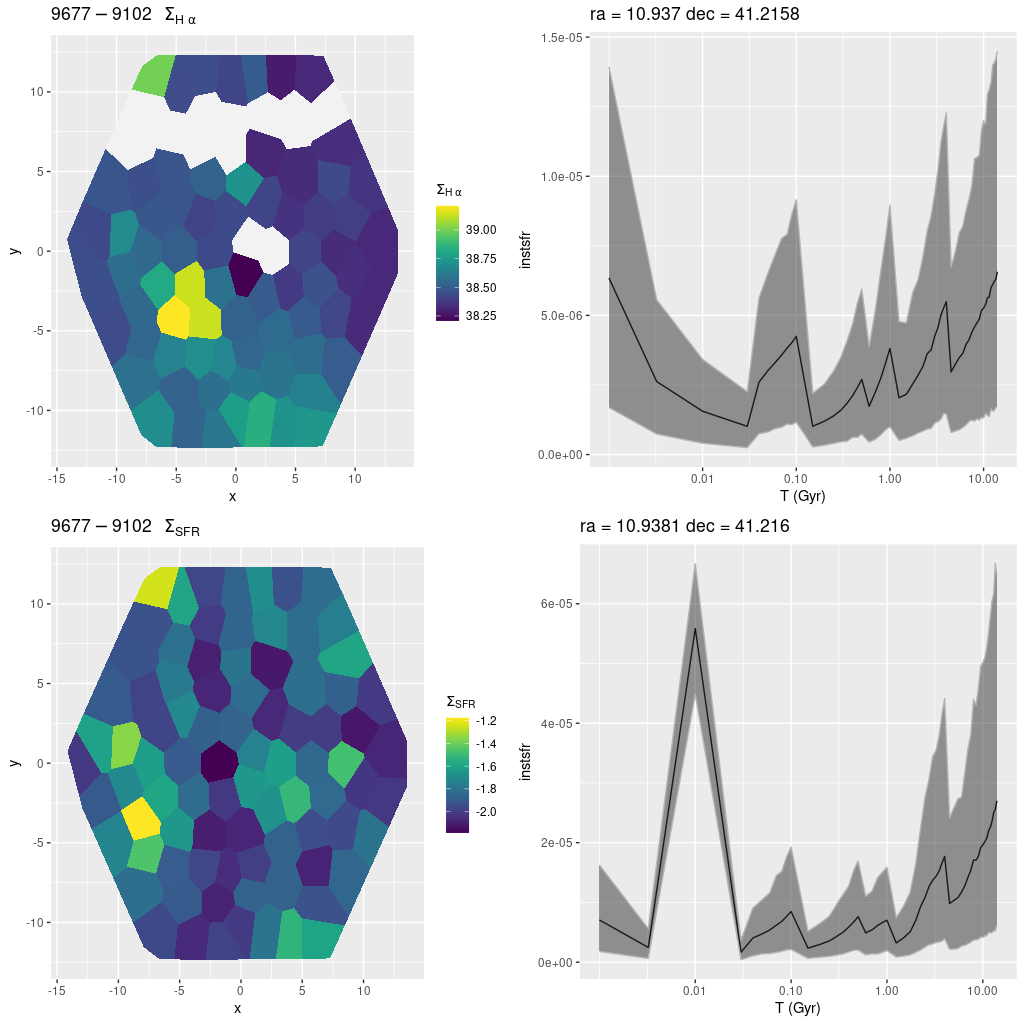
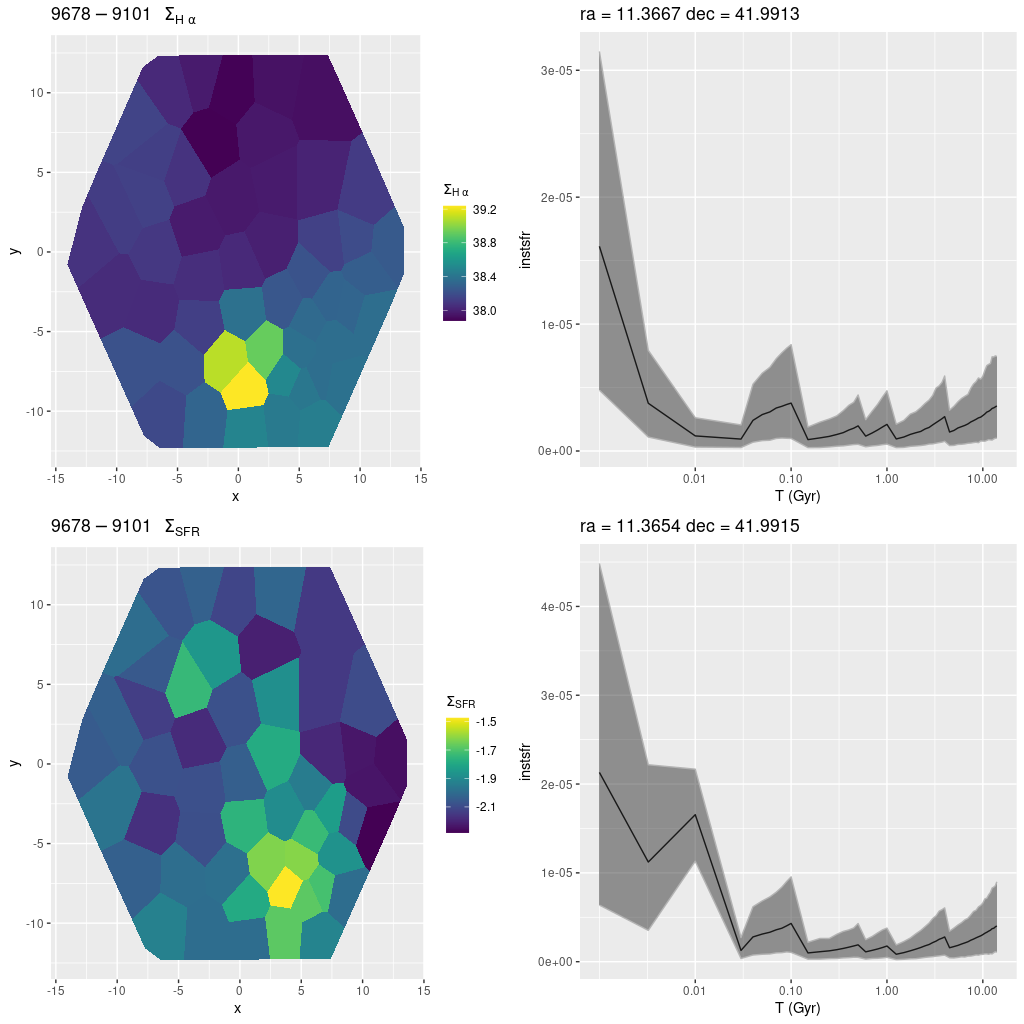
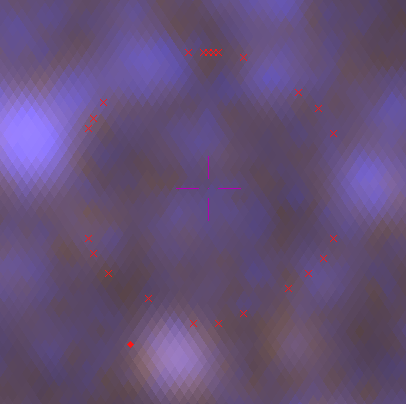
Of course there are hotter bright stars in the study area and these could affect results in different and possibly unexpected ways. For example the outermost IFU contains one bright star that GAIA estimates has a surface temperature of 5500 C, which would make it a G supergiant if it’s in M31. I noted in the last post that the model star formation history for that region looks like a post starburst with an age around 800 Myr. This is, I think, several galactic rotation periods, and stars born that long ago should have dispersed by now unless they’re gravitationally bound. There’s no sign of a star cluster there nor is there a cataloged one nearby, so it seems likely to me that the “starburst” is an artifact. As I noted in the last post though the fit to the data is quite good.
These examples illustrate an issue that’s fairly well known, which is that using simple stellar populations as building blocks of low mass stellar systems are potentially affected by so-called “stochastic” effects, which simply means that the distribution of stellar masses can vary randomly from what’s assumed in the SSP models. Specifically, in M31 there are individual stars luminous enough to affect spectra. One possible solution might be to add some stellar spectra to the library. I might give that a try some day.
I’m going away and won’t be writing for a while. I’m hoping to acquire or build a SSP model library based on SDSS MaStar spectra yet this year. This is a much larger collection of stellar spectra than has been previously available and it has the advantage of having the same flux calibration and (approximately) spectral resolution as the SDSS galaxy spectra. I also plan to return to my study of post-starburst galaxies.

