In this post I’m going to compare IFU wide star formation histories from my models to those of Williams et al. (2017) in the nearest 83″ by 83″ PHAT tile to each MaNGA IFU in the study. I picked the Williams paper for comparison mostly because it’s possible to! They give a complete tabulation of model results for all regions and all 4 sets of isochrones that they used, and these are available through the Vizier service. Specifically I used their Table 2, which provides star formation rate densities summed over all metallicities. Since the SSP model spectra I use are based on BaSTI isochrones I initially compared to their BaSTI based models. One problem with the Williams comparison is the authors had a very wide youngest time bin of 300 Myr, which is where my models should generally have the highest precision (I make no strong claims about accuracy). It would be nice to do a similar comparison to the earlier companion paper on recent star formation by Lewis et al., which gives a much finer grained view of the last ~half Gyr, but unfortunately there is no published tabulation of their results.
At the other end of the timeline the oldest bin is also very wide, from 8 to 14 Gyr lookback time. This isn’t a surprise: the limits for reliable photometry of individual stars were rather shallow, no fainter than m = 28 or Mg ≈ 3.6 according to Lewis. This is brighter than the main sequence turnoff at 8 Gyr, so any information about the truly ancient star formation history is coming from giant branch stars which have very similar evolutionary tracks at old ages1Checked by downloading a few isochrones from the BaSTI website.
At the end of my last post I mentioned the necessity to correct densities for the rather large inclination of M31’s disk. It turns out though that I reproduce Williams’ Table 3 from their Table 2 if the densities are uncorrected. Their tabulated SFR densities are in units of 10-4 M☉arcmin-2/year. One arcminute at their adopted M31 distance is about 0.227 kpc, so to convert to star formation rates per kpc2 the values in table 2 are multiplied by 19.8 × 10⁻⁴. From my models I sum the star formation rates over all modeled spectra in each IFU and divide by the total area in fibers, with each fiber covering a projected area of 42.78 pc2. Note that I do not try to analyze a single composite spectrum summed over the entire IFU since dust attenuation is quite patchy.
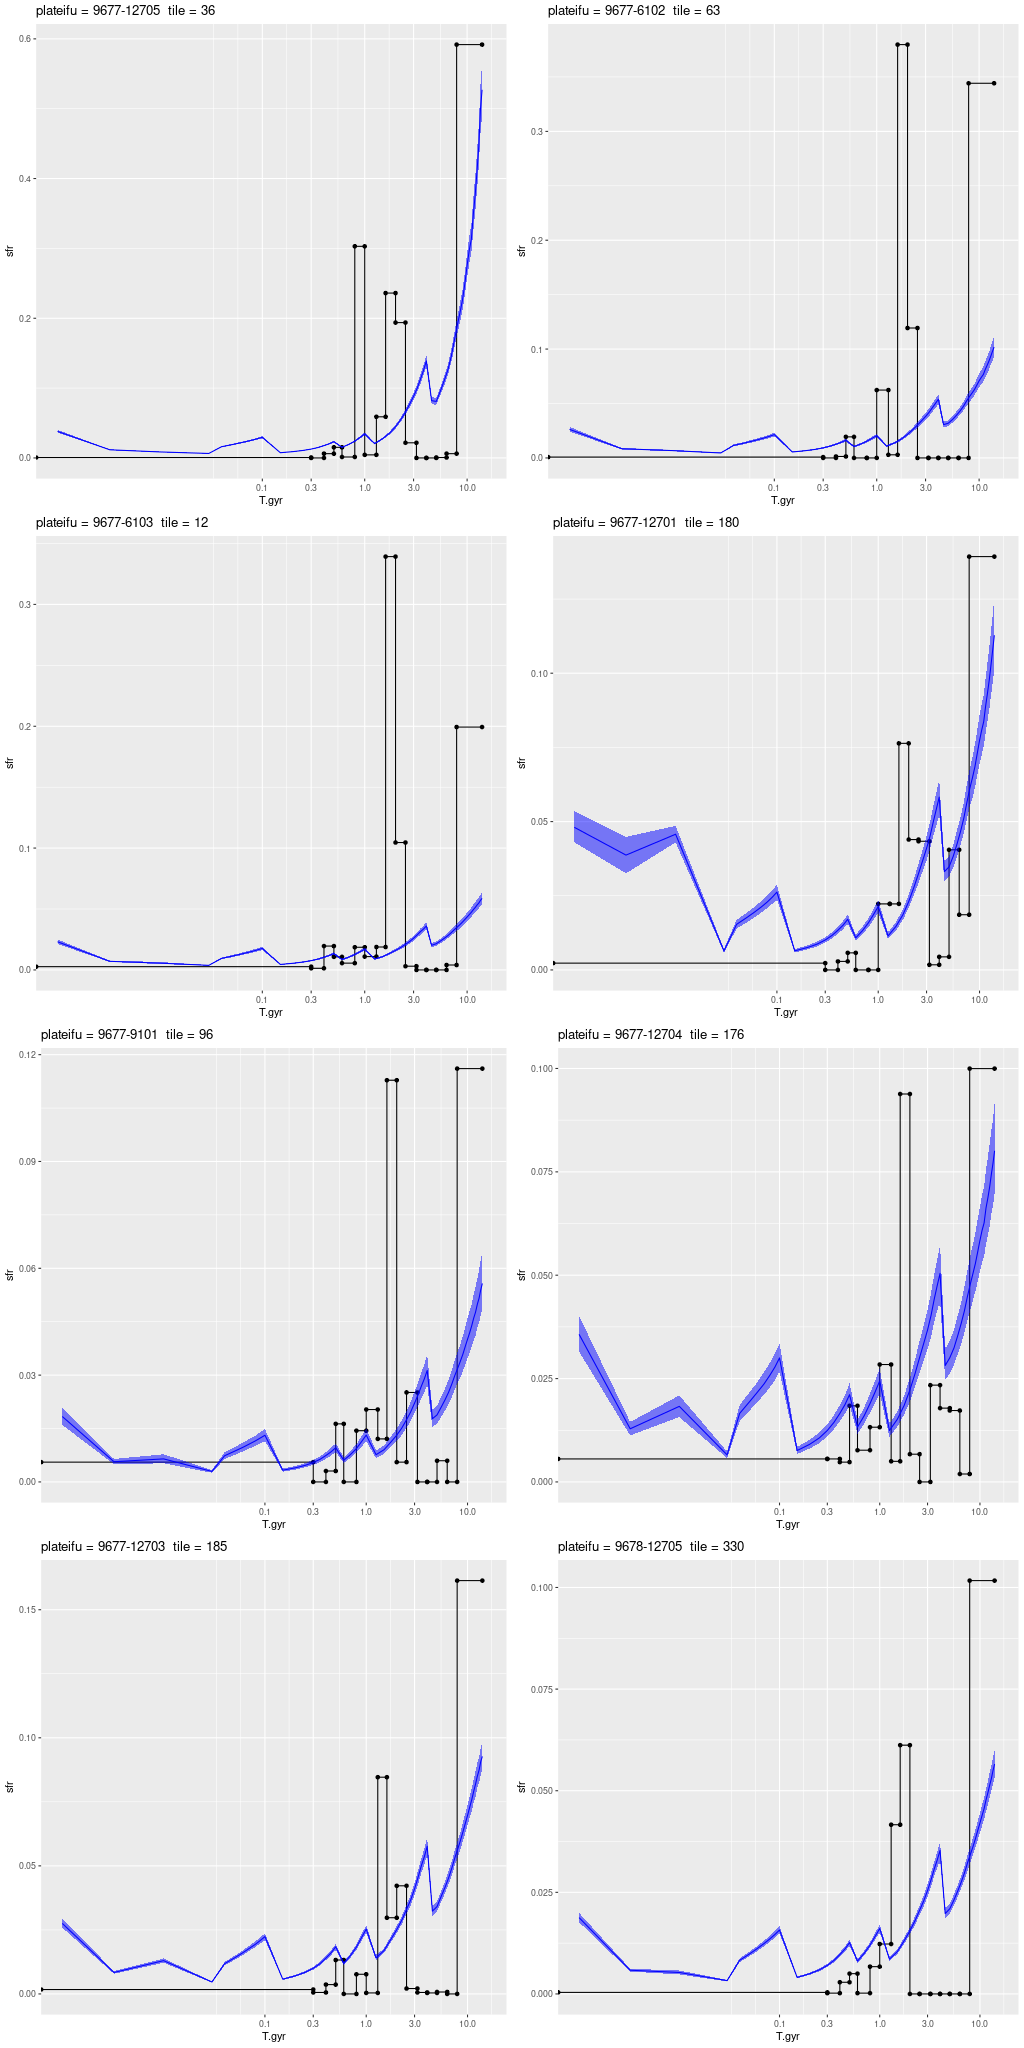
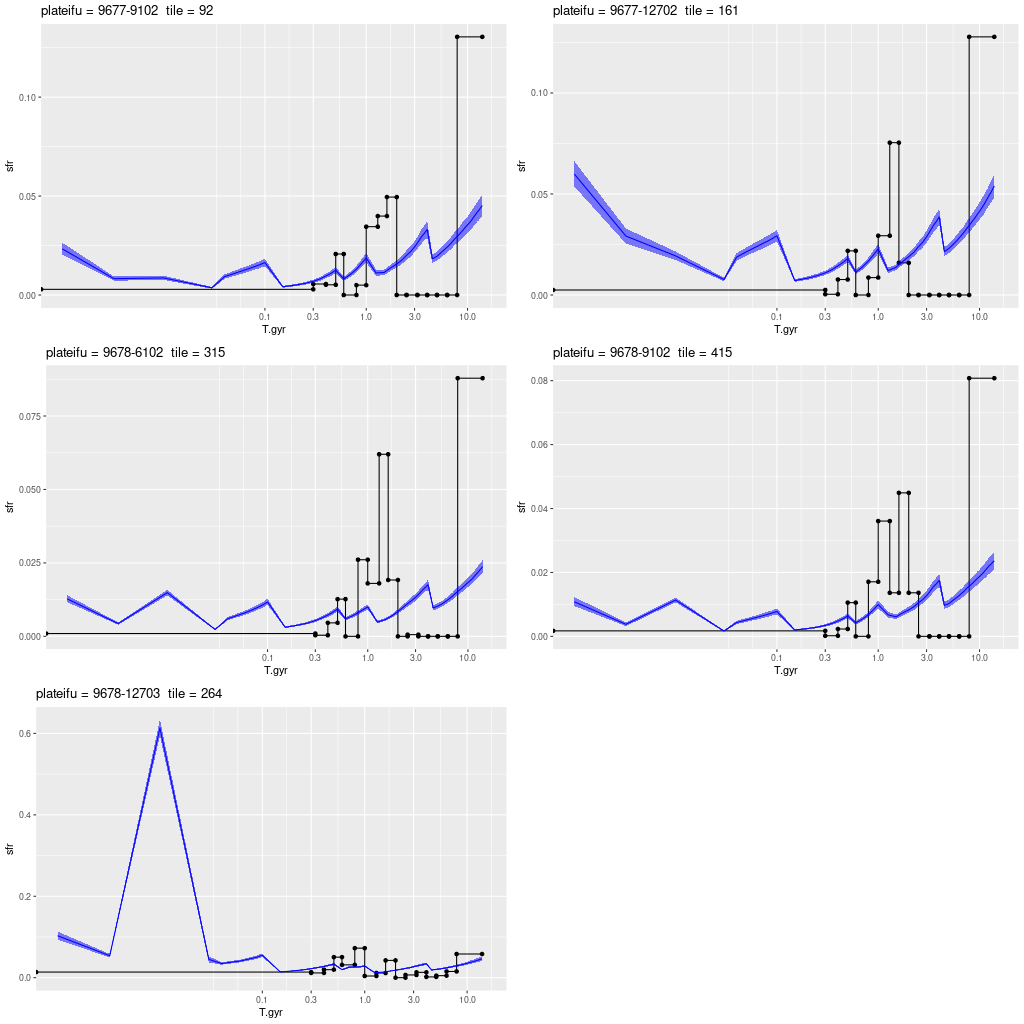
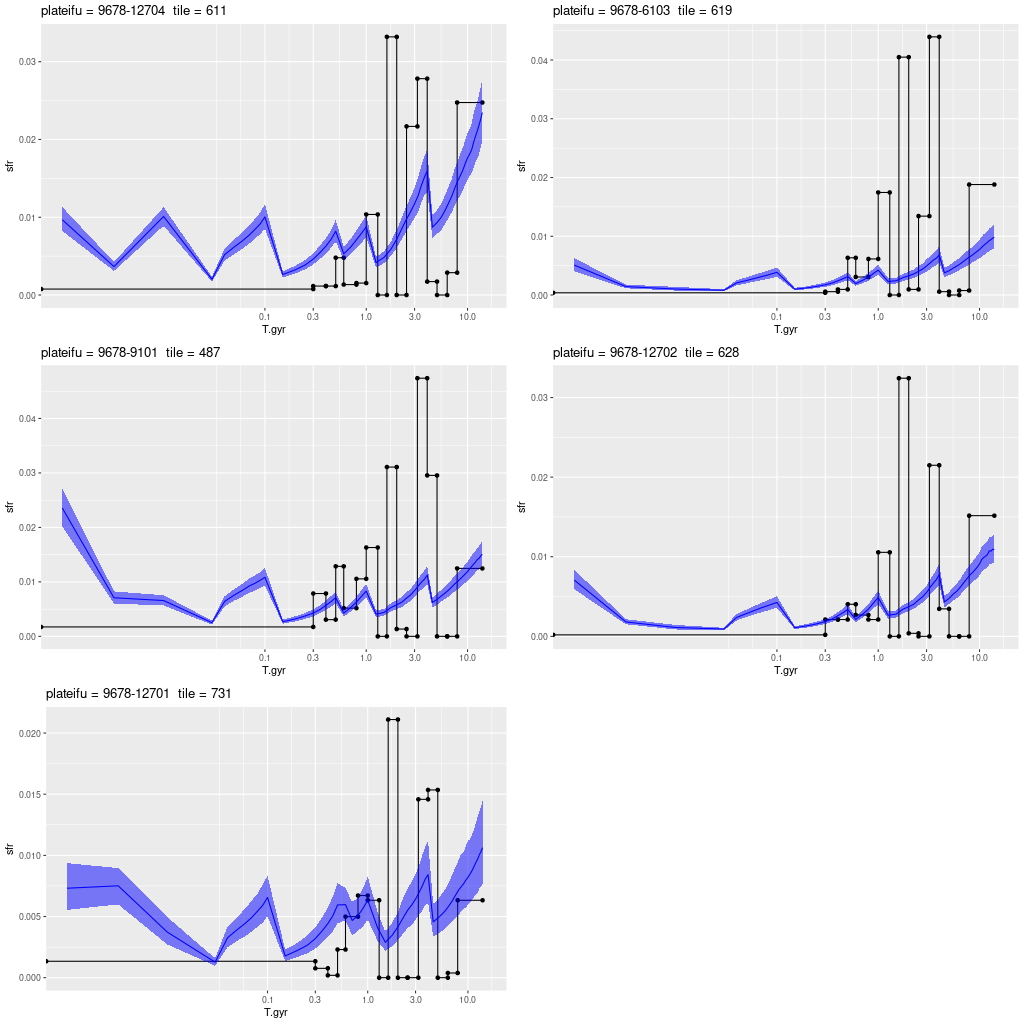
The graphs below overlay my modeled star formation rate densities on those of Williams in the tile with the nearest center to that of each IFU. The ribbons indicate the nominal 95% credible limits of SFR. These are certainly wildly optimistic. Table 2 of the paper includes uncertainty estimates, which I chose not to include. SFR densities are linearly scaled with different limits for each plot. The time scale is logarithmic. Something in between linear and logarithmic would seem more appropriate since this perhaps gives too much space to very recent times, but I haven’t found a suitable scaling.
These are ordered into three groups by location: the inner disk which is everything inside the 10 kpc ring, the 10 kpc ring, and the outer disk which is everything outside the 10 kpc ring. There’s some ambiguity about the locations of the plateifu’s 9678-9101 and 9678-12704. The first of these is about 12 kpc from the nucleus in what could be either a wide section of the 10 kpc ring or a separate structure. 9678-12704 appears in projection to be just outside the 10 kpc ring but it may be considerably farther out in a segment of spiral arm at ~15 kpc.
Commentary will continue after the graphs. I will discuss the individual IFU’s in more detail in later post(s).
Inner Disk
10 Kpc ring
Outer disk
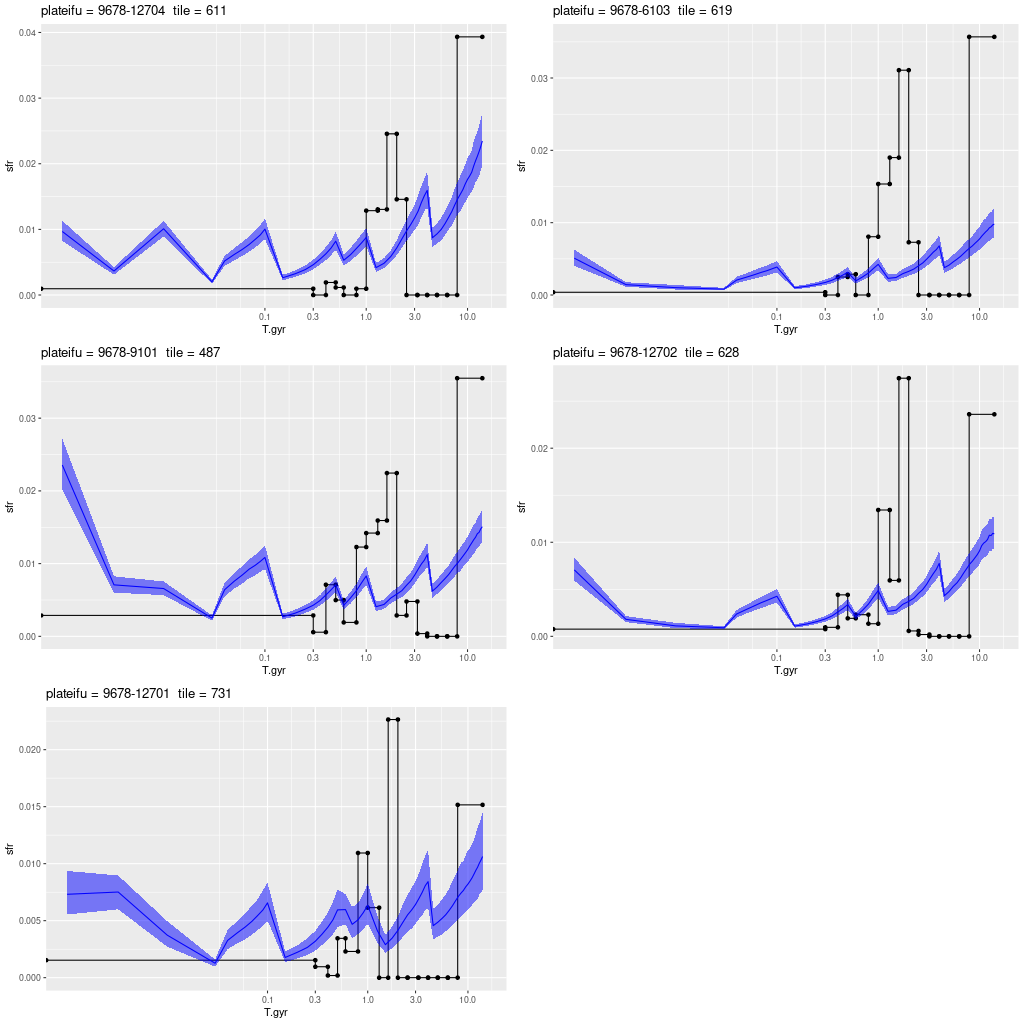
The first two things I noticed were that star formation in every region declines monotonically from very early times to at least 4 Gyr ago. It also starts out lower than in the PHAT team’s models. Because of this early time mass deficit all of my models have smaller current day stellar mass densities by varying amounts. I don’t really have a pat explanation for this. Some authors have posited a “dazzle effect”2I’m going to discuss this a little further at the end of the post where recent star formation obscures the contribution of old populations. It’s certainly likely that this occurs, but if these Bayesian models are behaving as I hoped this lack of information should manifest as larger uncertainties rather than a systematic bias. Well, my hope could be wrong. On the other hand I don’t see strong evidence in these models for such an effect. From my eyeball analysis I don’t see an obvious correlation between present day star formation and the size of the early time deficit.
Another possibility is a systematic difference in the amount or shape of attenuation between my models and theirs. There is another well known “degeneracy” between stellar age and attenuation in SFH modeling, but I haven’t yet investigated whether this could be occurring here.
The PHAT models have a very long interval from 8 to ~2-3 Gyr ago with very little star formation. Some authors find evidence for a large increase from about 2-4 Gyr which is usually attributed to a merger or perhaps close encounter with M33. This isn’t seen in the BaSTI based models but there is a large more recent burst from about 1-2 Gyr lookback time. My models see neither a cessation of star formation nor a particularly large burst at intermediate ages. As I’ve noted before my models “want” to have smoothly time varying light3and therefore mass contributions and this might make a modest burst at moderately large ages difficult to discern. Another confounding factor arises from the abrupt changes in age intervals (at 0.1, 0.5, 1, and 4 Gyr) which results in the sawtooth pattern in SFR that’s obvious in every plot above.
At ages younger than 1 Gyr there’s generally good agreement about the course of star formation up until the youngest age bin of width 300Myr in the PHAT models. My models have anywhere from slightly to dramatically higher SFR densities averaged over the most recent age bin. I suspect this is because many of the IFU positions were chosen to be in regions with active star formation. In particular the plateifu 9678-12703 (mangaid 52-23) is very close to the region in the 10 kpc ring with the highest density of ongoing star formation in the northern half of the disk.
I plan to discuss the individual IFUs in more detail in a later post. Below the fold are some more graphics: mass growth histories and SFR densities compared to the PADOVA isochrone based models.
Mass growth histories
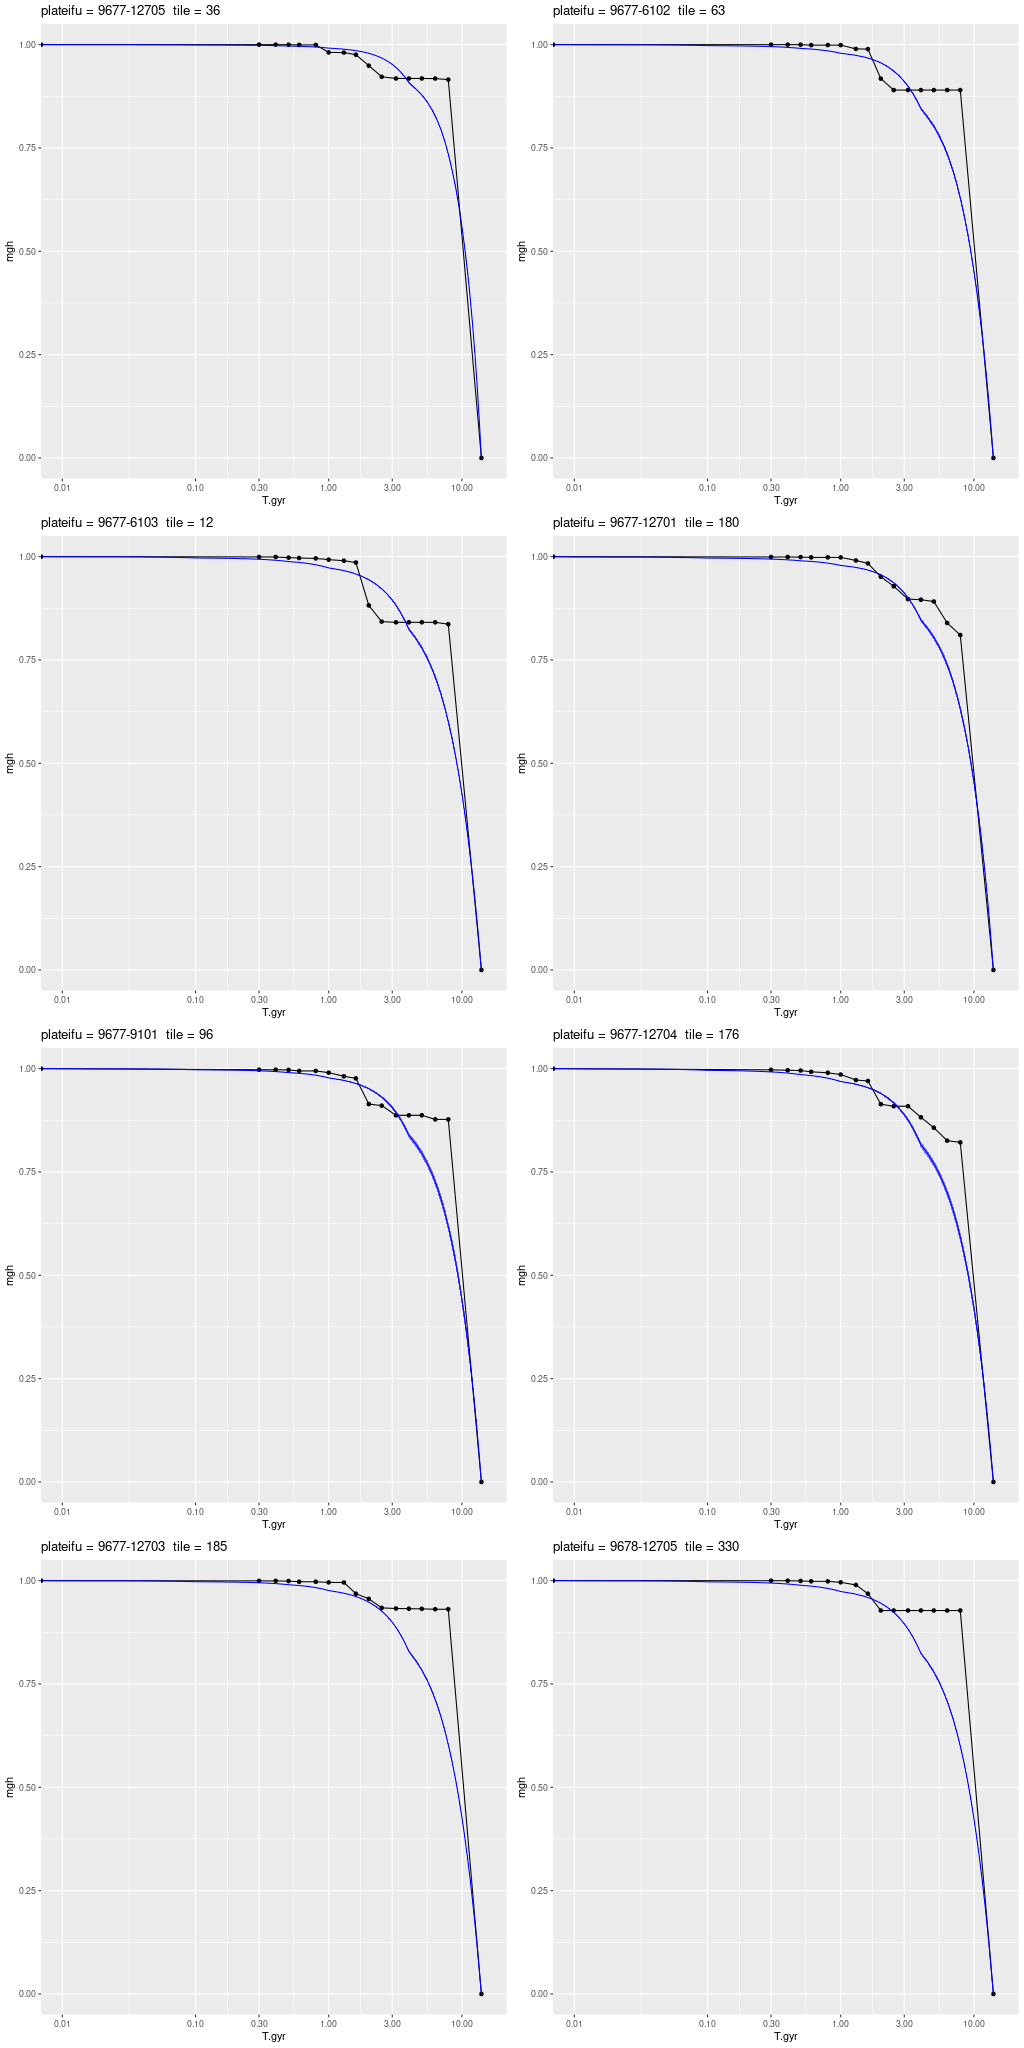
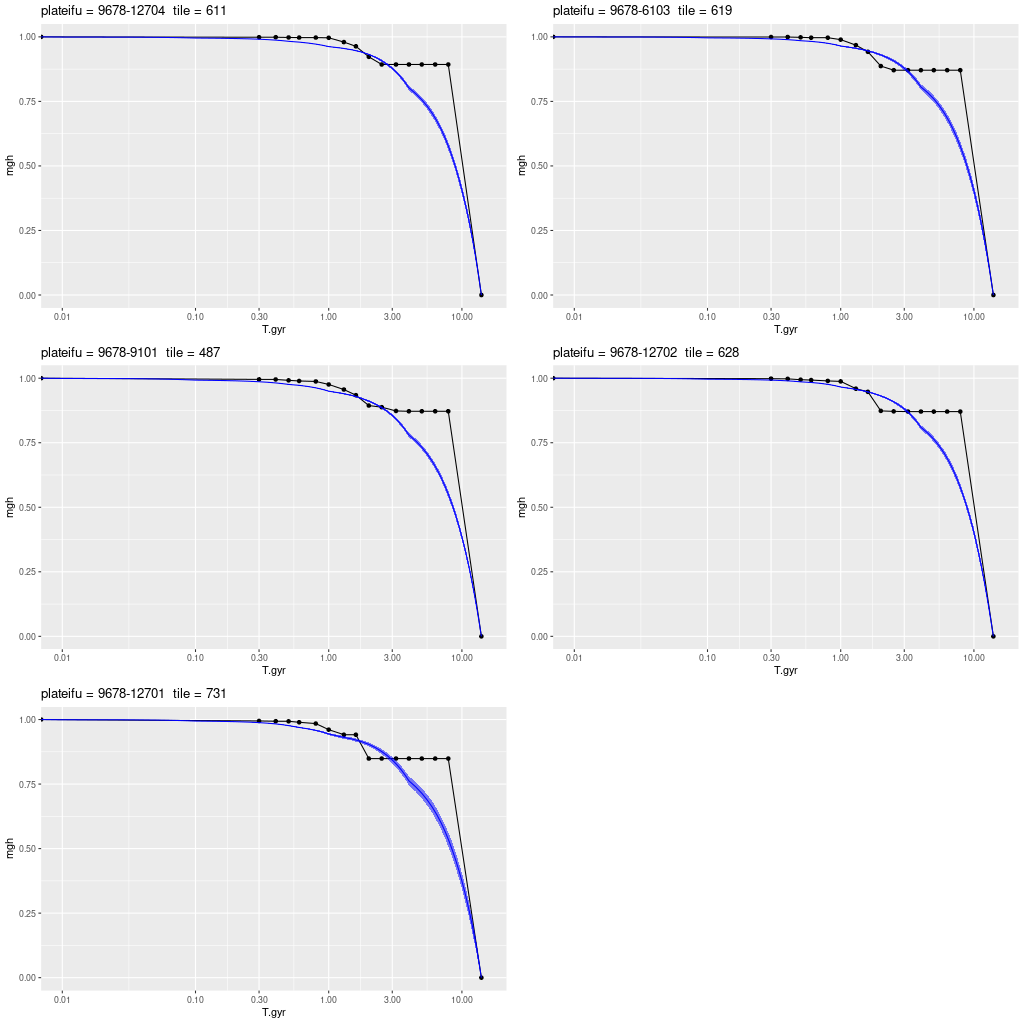
This group of plots compare mass growth histories from my models to those of Williams et al. In contrast to their Figures 8-10 (etc.) these show the fractional growth of present day stellar mass, that is an allowance is made for stellar mass loss. For the PHAT models I estimated the stellar mass remaining at the midpoint of each time bin from the MILES solar metallicity tabulation. The smallish burst of star formation at ~1-2 Gyr that can be seen in a number of the PHAT tiles is absent in mine. Generally the models are in good agreement for recent star formation, although mine have slightly more mass added in the last Gyr. Again, this could be a selection effect.
Inner disk
10 kpc ring
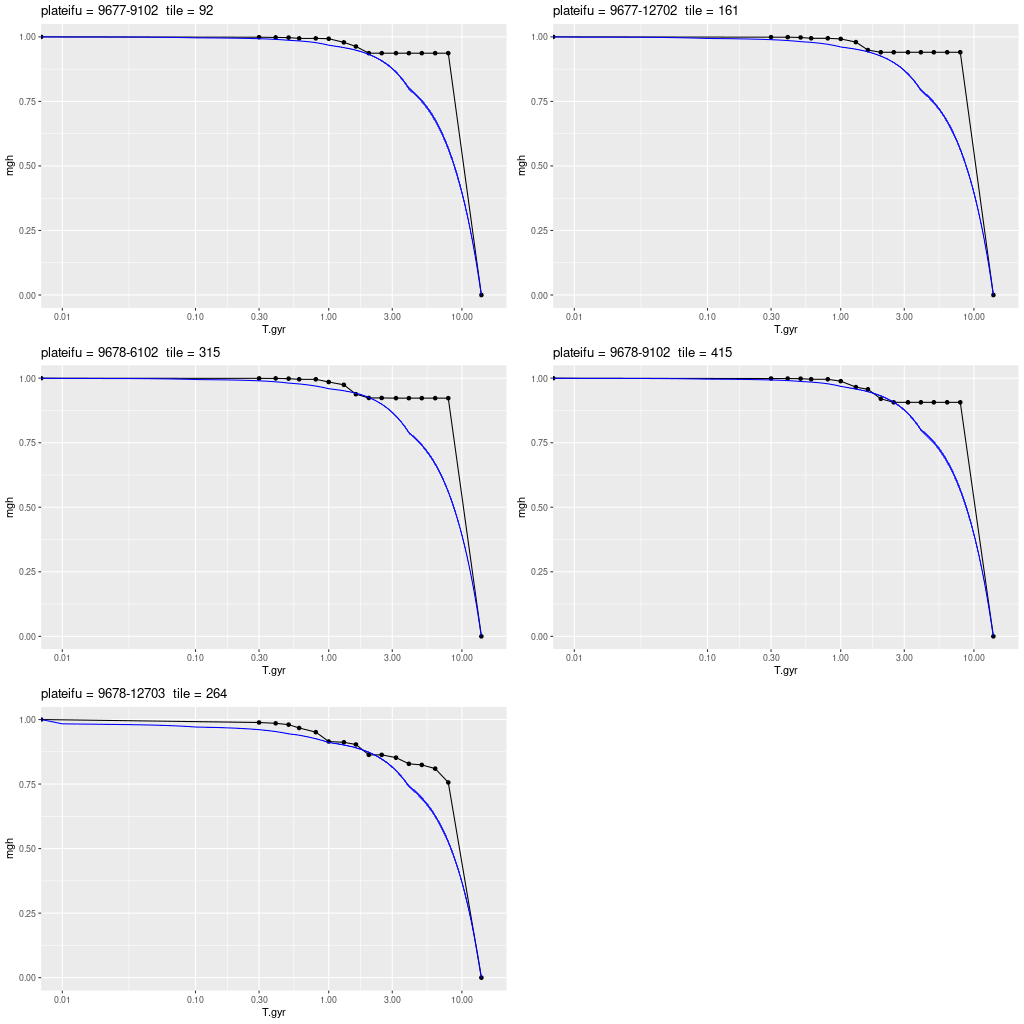
Outer disk
Comparison to Padova based SFH models
Finally, for completeness here are comparisons to the Padova based models. These had a much larger range of early time star formation rates than the BaSTI based models, and also had an earlier interval at around 2-4 Gyr of enhanced star formation.
Inner disk
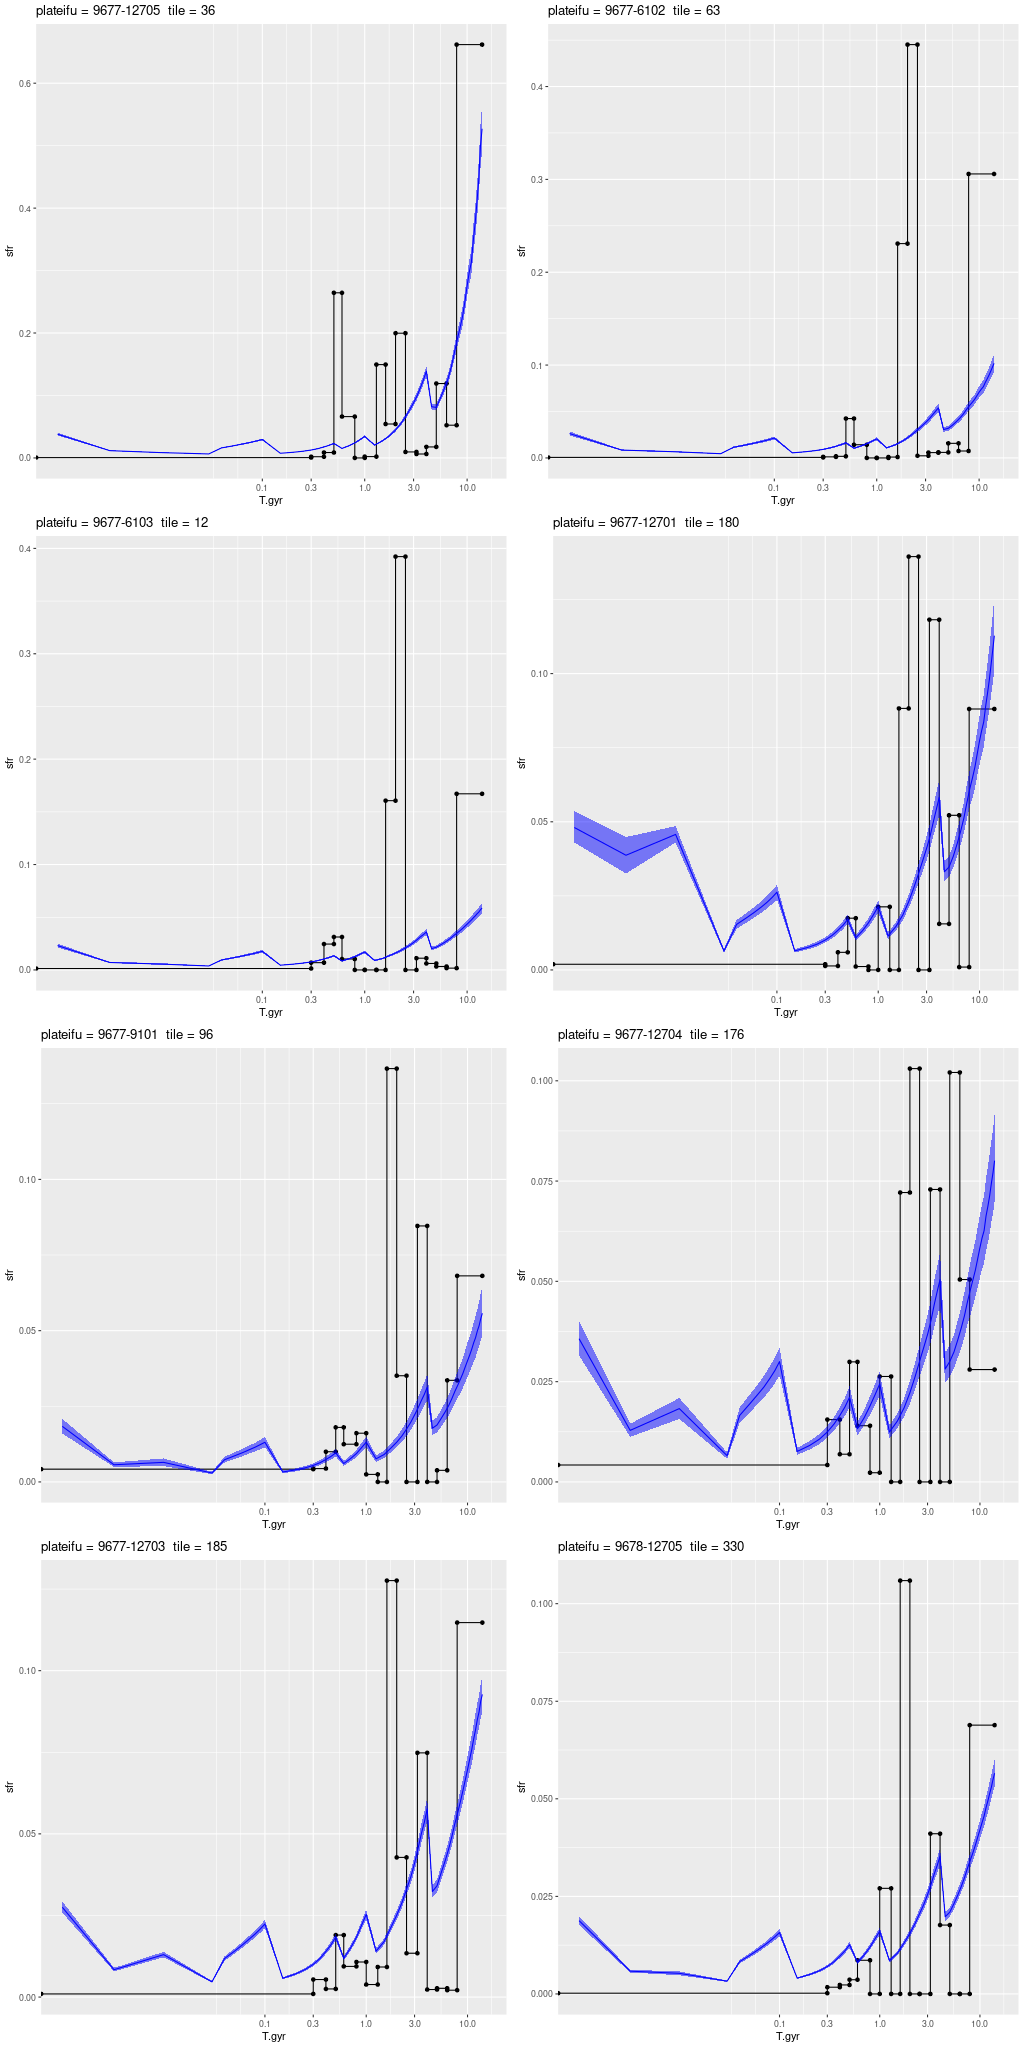
10 kpc ring
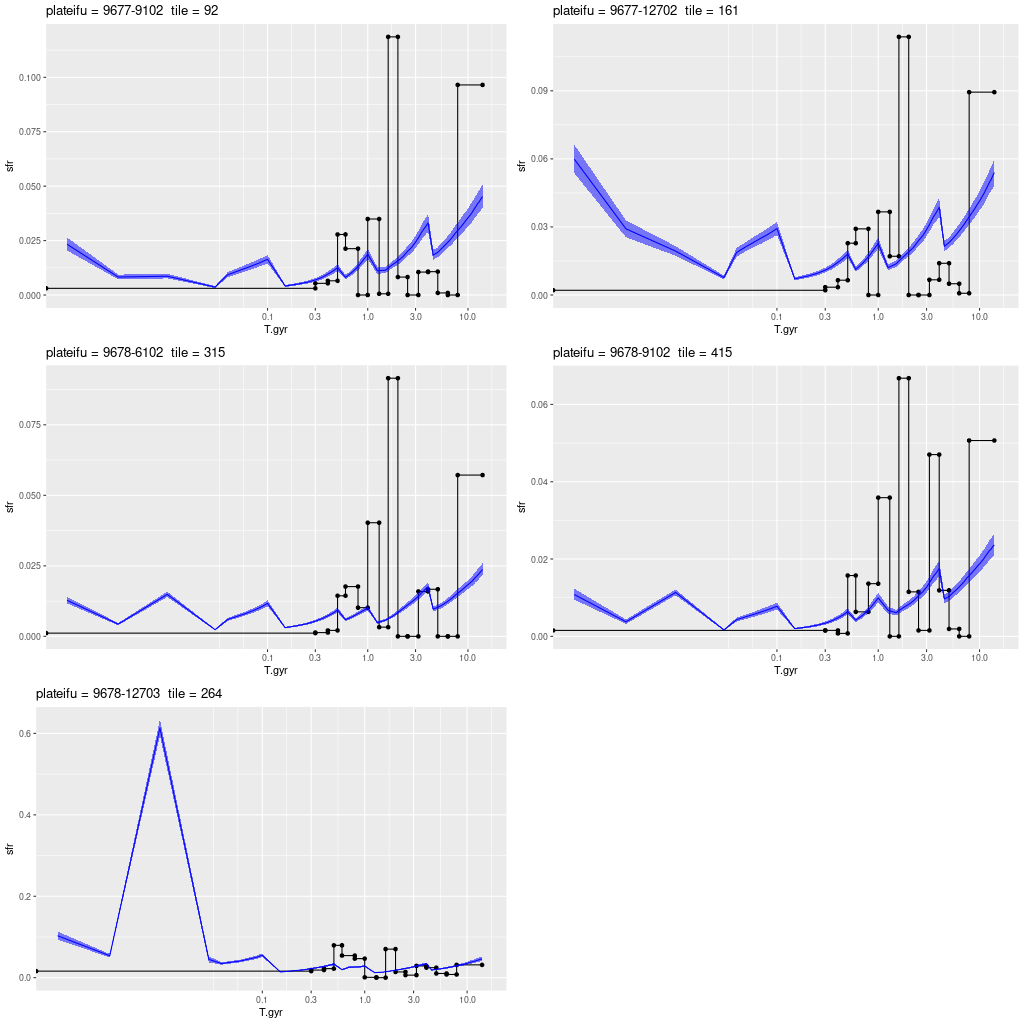
Outer disk
Is the dazzle effect real?
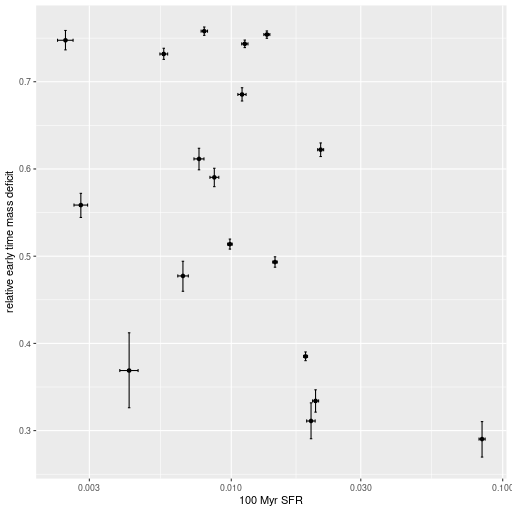
It occurred to me that I can do a little better than an eyeball analysis of this question for this set of models. I calculated the 100Myr average star formation rate density for each IFU and the fractional deficit in the 8-14 Gyr for my models relative to those of the PHAT team. The result is shown below. If there were a “dazzle effect” I would expect to see a positive trend if this effect is real. Instead there’s no trend at all. In fact the region with the highest current star formation also has the smallest deficit, leading to a no doubt spurious impression of a negative trend. So, the issue of why there’s a mass deficit isn’t solved yet.
By the way while I distinctly remember reading at least one paper that posits this effect I can’t actually find the reference. Maybe I’ll stumble upon it again someday.
