
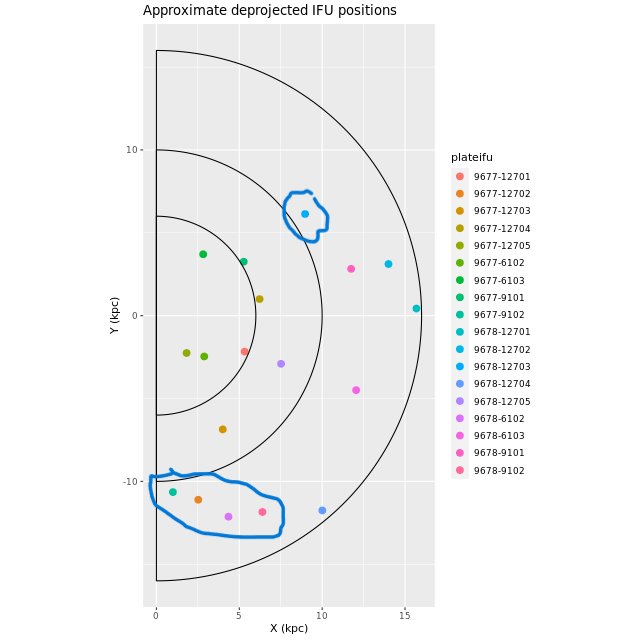
Before I get into details of the individual IFUs here is the result of a little exercise I did to estimate the deprojected positions of the IFU centers using the canonical values of 77° for the inclination and 38° for the major axis position angle, and applying the coordinate conversions I outlined way back in this post with slight modifications. These are fairly rough estimates since Andromeda’s disk is apparently warped and rather thick, but this may help give some perspective on relative positions in the plane of the galaxy. For reference I’ve drawn semcircles at 6, 10, and 16 kpc, and circled the IFUs that I had placed in the 10 kpc ring. Two of the IFUs — plateifus 9678-6102 and 9678-9102 — now appear to be at or beyond its outer edge at radii of 12.9 and 13.5 kpc, while plateifu 9678-9101 which I had assigned to the outer desk is a bit closer at 12.1 kpc. But, no matter. I will discuss them in the same order as I presented the IFU wide star formation histories several posts ago.
plateifu 9677-9102 (mangaid 52-1)
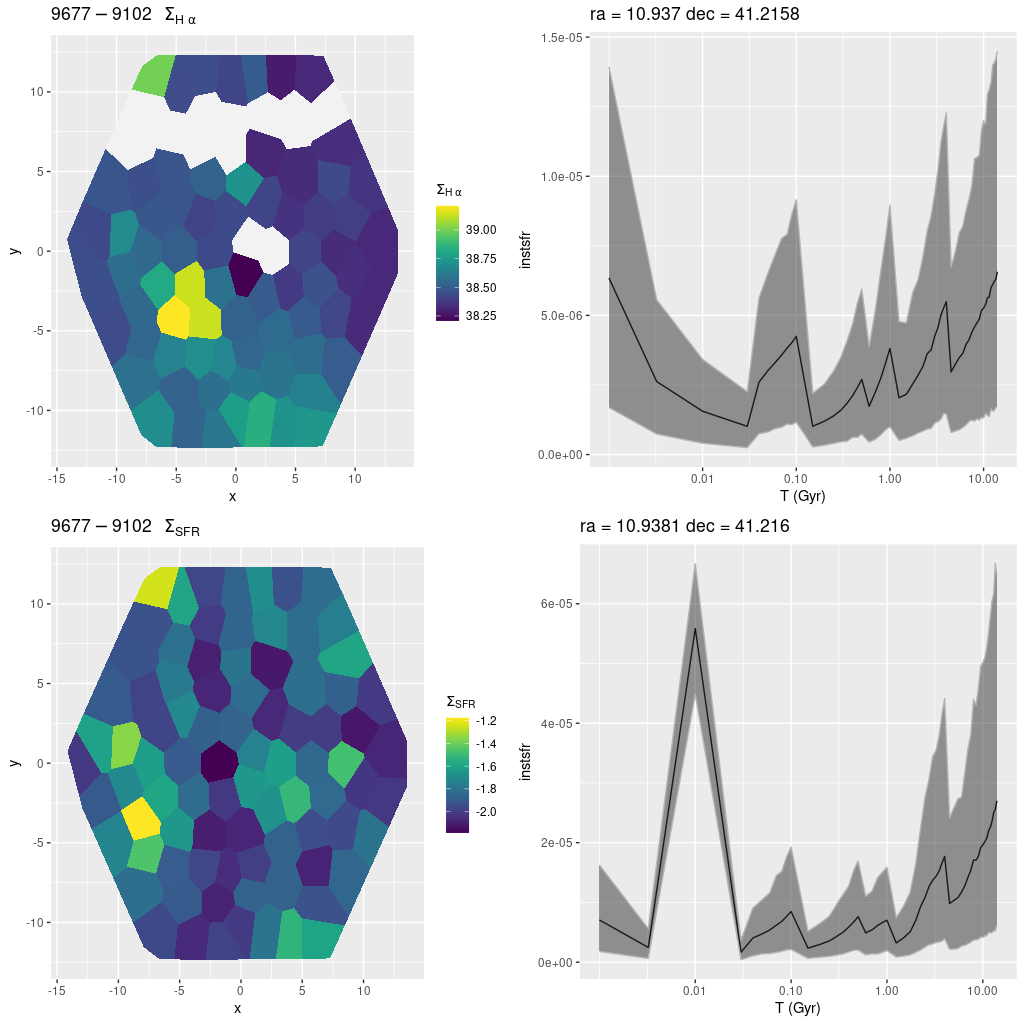
This is already a recurring theme. There is a single cataloged H II region within the IFU footprint that coincides with the highest (uncorrected) Hα luminosity density bin below. The bin with the highest (100 Myr) SFR density is displaced by several parsecs to the northeast. The first region has an increasing star formation rate over the last ~30 Myr, while the second shows a sharp peak and rapid decline over the last 10 Myr. If the models are remotely correct this is clear evidence for propagation of star formation over short distances.
plateifu 9677-12702 (mangaid 52-7)
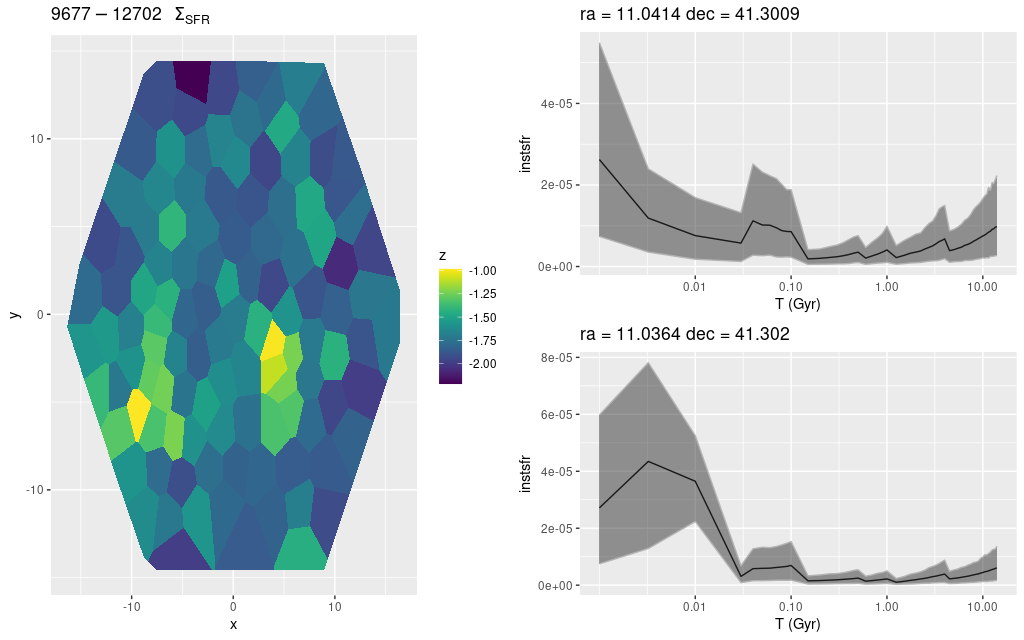
Despite being right in the middle of the 10 kpc ring there’s nothing very interesting in this IFU, with just a single cataloged red supergiant and a small and rather faint H II region that’s at or beyond the edge of the footprint. Only weak diffuse emission is seen in the MaNGA data. Nevertheless there are a few areas with evidence for recent star formation:
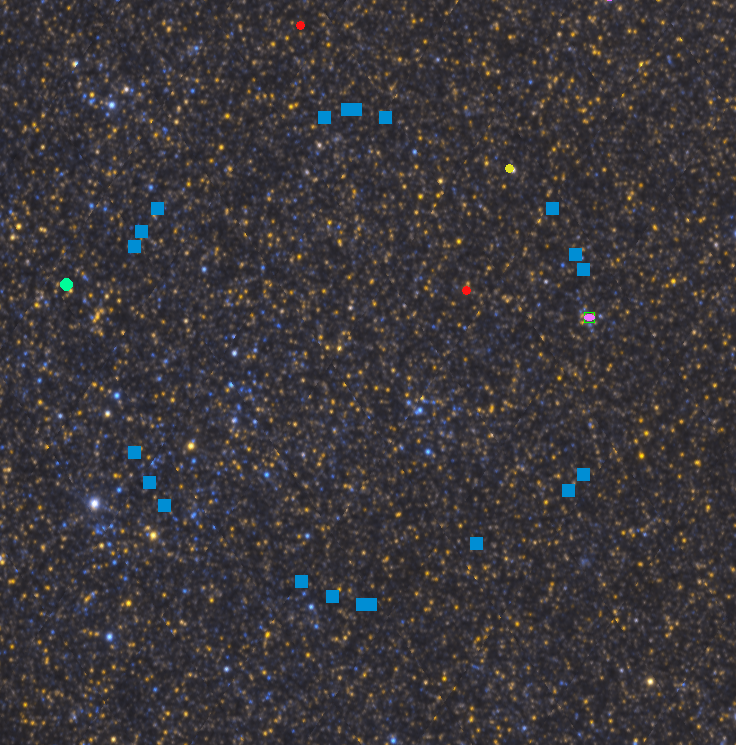
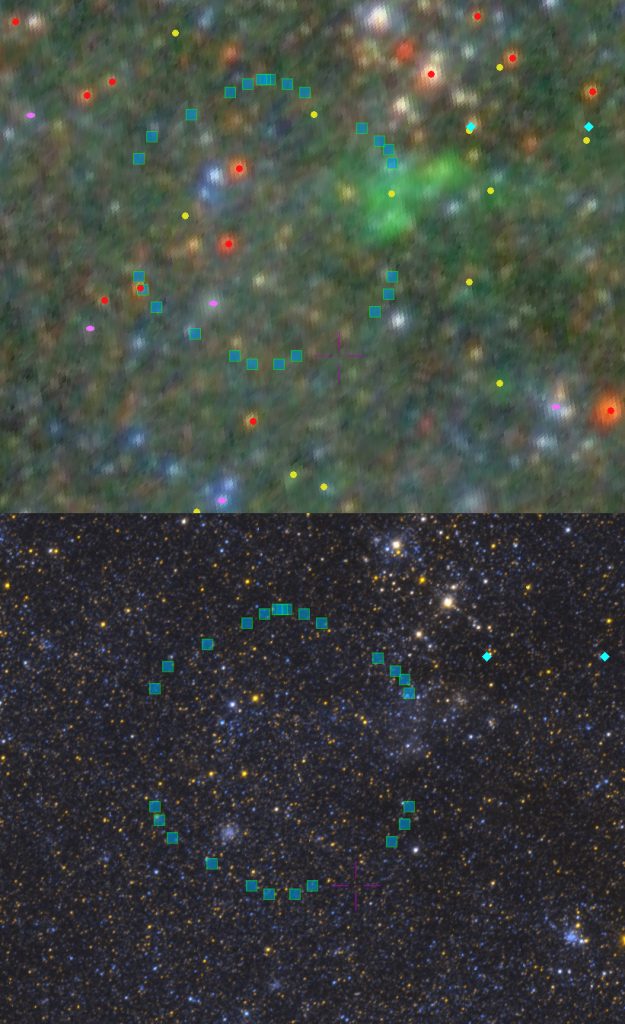
I recently noticed that one of the imaging products available in Aladin is a color composite assembled from the PHAT F475W and F814W ACS/WFC observations. One thing these are good for is they give you a very rough idea of stellar temperatures. To my eyes at least stars appear orange, white, or blue. Bright blue stars must be young; bright orange ones are evolved (or reddened by dust perhaps) and might be young or old. Notice below that the two areas with relatively high star formation have a sprinkling of bright blue stars, while the bulk of the field contains predominantly orange ones.
The other optical wavelength imaging I look at comes from SDSS. Even though the imaging in this area is incomplete and the processing leaves something to be desired it does have the virtue that Hα is, at low redshift, in the r filter, which forms the green channel in their images. M31 H II regions then are identifiable by their green color. Also, red supergiants look distinctly red since their brightness is still increasing into the near IR.
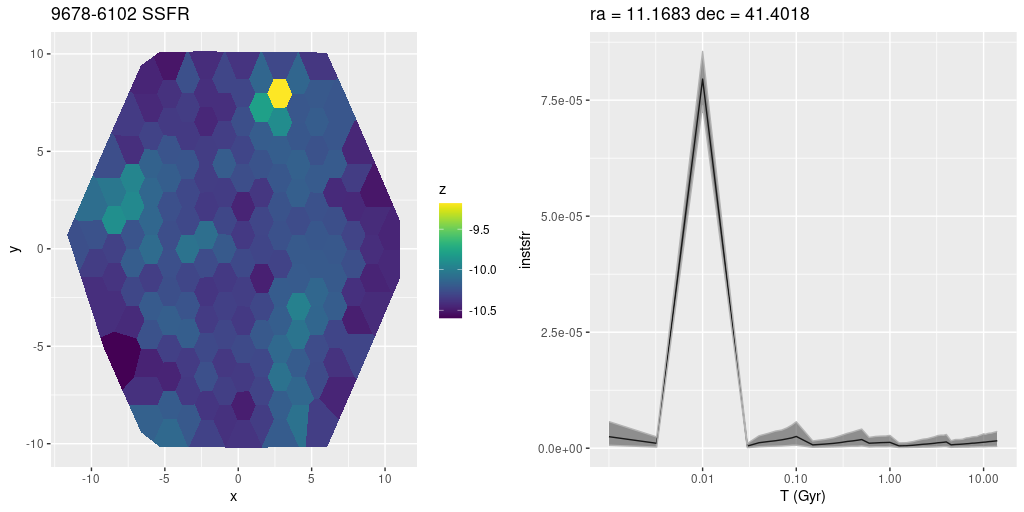
plateifu 9678-6102 (mangaid 52-20)
This lies on the outer edge of the 10 kpc ring, some distance from UV bright sources and H II regions. There is one cataloged planetary nebula and that shows up in my modeling as a region with “AGN” like emission line ratios. One fiber has a much higher modeled specific star formation rate than its surroundings. A map of SSFR and star formation history for that region are shown below. There are bright red and yellow stars in the region which might be (uncatalogued?) red supergiants.
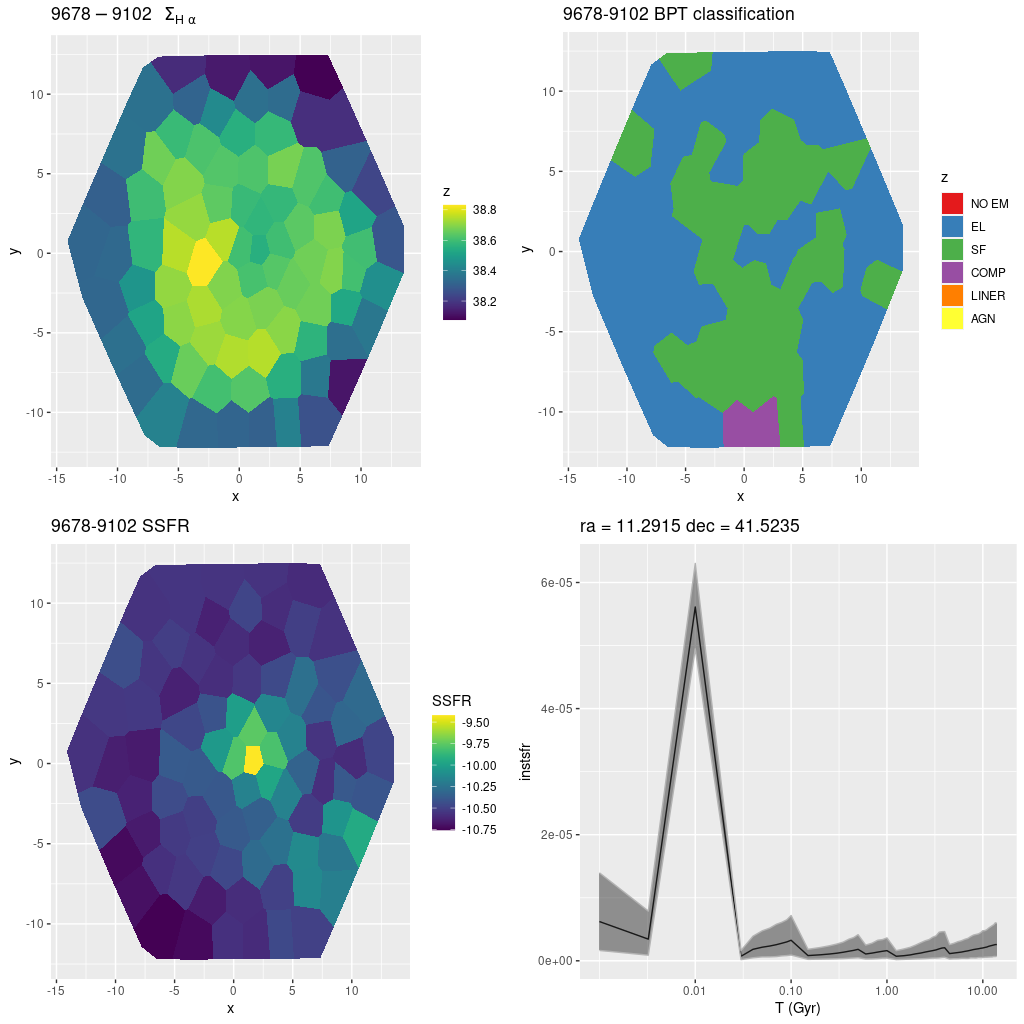
9678-9102 (mangaid 52-18)
This is the final IFU on the eastern side of the 10 kpc ring. Once again it lies at the outer edge, well away from active star forming regions. There is weak emission throughout, with star forming line ratios through much of the IFU footprint despite the lack of evident star forming regions. There’s some unresolved UV emission in the GALEX color image that roughly corresponds in location to the area of brighter Hα.
The region with the greatest recent star formation has some fairly bright blue and yellow stars in the PHAT color image
By the way I do check observational quantities in my models against the SDSS product Marvin now and then. Here’s their rendering of the Hα flux:
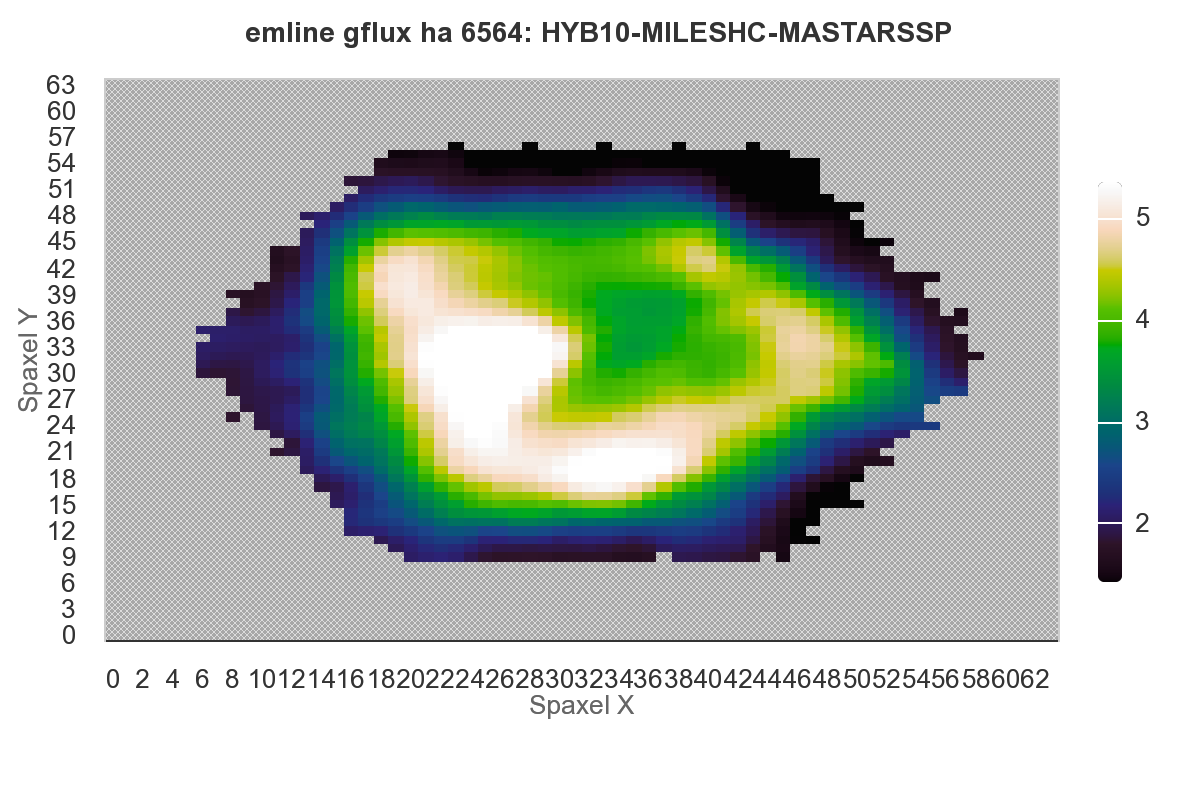
Qualitatively at least the agreement is excellent. I’d have to check if their fluxes are consistent with my log-luminosities.
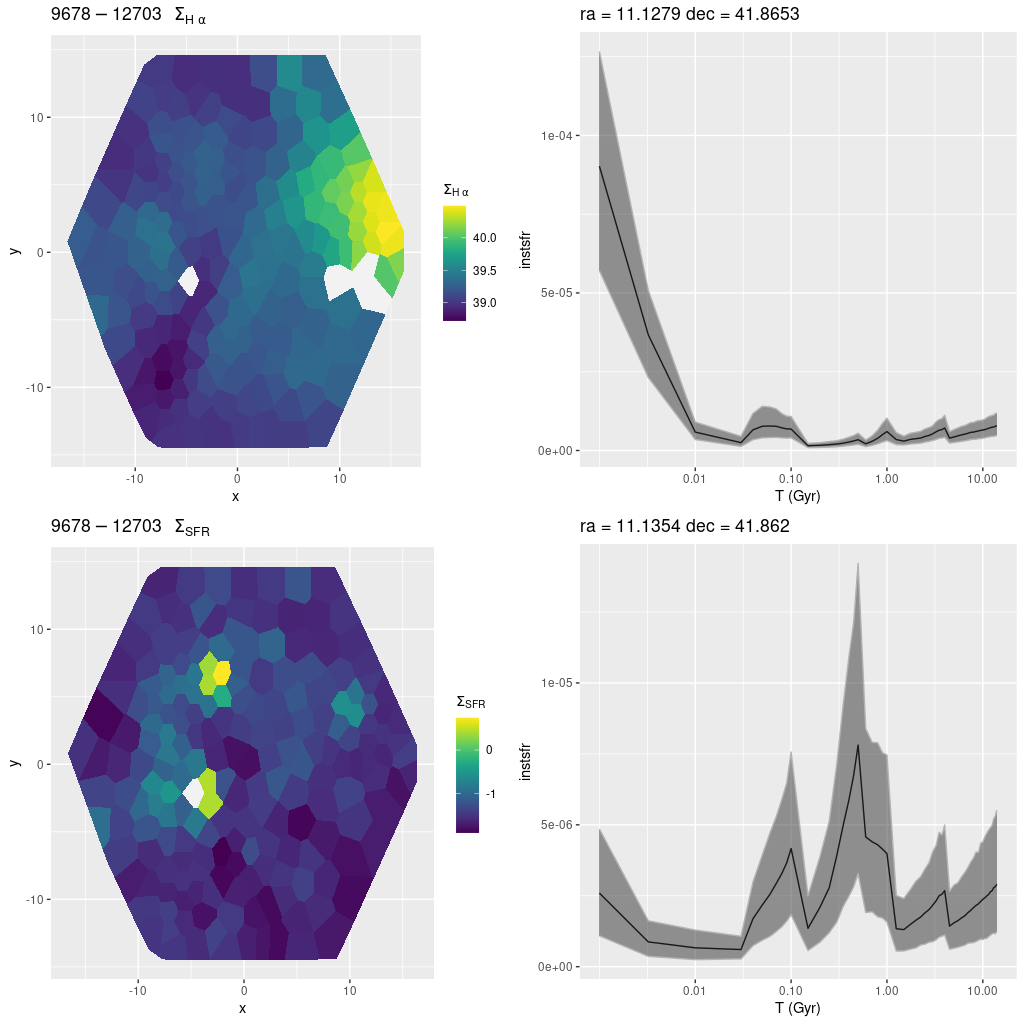
plateifu 9678-12703 (mangaid 52-23)
Finally we get to the most interesting IFU in the project, plateifu 9678-12703, which lies very close to the region with the highest recent star formation in the northeastern half of the galaxy. It also appears to coincide in position with one of the regions that Lewis et al. (2015) highlighted (their Figure 2). As can be seen in the Aladin cutouts (from SDSS and PHAT color images) below there are several young stellar objects within and near the IFU footprint: at least two red supergiants (which are a problem); 3 catalogued H II regions, one of which is bright and extended; some OB associations that are centered outside the footprint; and one open star cluster. There are a number of bright blue stars scattered throughout as can be seen in the color PHAT image.
Plotted below are maps of Hα luminosity density and model star formation rate density, along with model star formation histories for two regions. The first is for the bins in the brightest part of the H II region along the western edge of the IFU. The second is for two bins at the position of a cataloged open cluster (Johnson et al. 2016) that’s fairly obvious in the PHAT cutout. The cataloged (log) age of the cluster is 8.4-0.1+0.3 with a mass around 104 M☉. The peak star formation rate in the model history below (bottom right) is at about 500 Myr lookback time with several hundred Myr of enhanced star formation, so this is pretty good agreement.
When I did my initial fitting runs on this IFU I noticed one fit that was rather poor which I attributed to a foreground star, and therefore I masked it for subsequent analysis. It turned out though the culprit was not a foreground star but instead a local red supergiant that’s been cataloged (for example) by Ren et al. (2021). Their catalog lists its G band magnitude from Gaia DR2 as 19.1 which makes its absolute magnitude around -5.3, a reasonable value for its presumed spectral type.
This raises an issue that’s fairly well known. Simple stellar population models assume the age zero main sequence is fully occupied according to a well defined initial mass function. This is a fairly innocuous assumption (although the choice of IMF is not) when we’re sampling ~billion solar mass regions, but it’s not so innocuous for cluster size agglomerations, which is what we’re sampling here1the typical binned region has a present day stellar mass around 104 M☉ per my models. The particular problem here is that a single red supergiant is making a significant contribution to the spectrum in the red, and that could be biasing the model SFH in as yet unexplored ways.
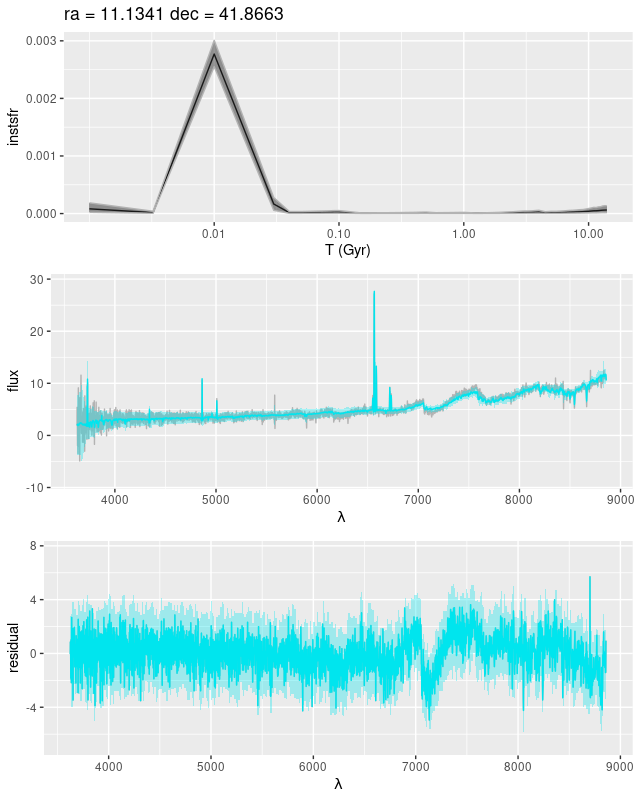
The bin at the position of the other bright supergiant in the footprint was analyzed, so lets take a quick look. In the top pane below is the model star formation history, and in the two below the (posterior predictive) fit to the data and the residuals from same. The fit doesn’t look so bad except for a region around 7200 Å, which often seems to be a problem with EMILES spectra.
Superficially the model star formation history looks not implausible, and similar to others I’ve shown. The presence of an evolved star indicates a stellar age in the right general range, as does the relative lack of H II emission. Despite the strength of the burst it adds only about 7% to the present day stellar mass, with as elsewhere the majority of the stellar mass was in place by 8 Gyr ago (per the model, as always).
But, there’s at least one indicator of a problem: the modeled optical depth of attenuation is extraordinarily high at τV ≈ 4.4, compared to the optical depth estimated from the Balmer decrement of τVbd = 1.47 ± 0.23. I plan to discuss this in more detail in a future post, but for now I’m moving on.
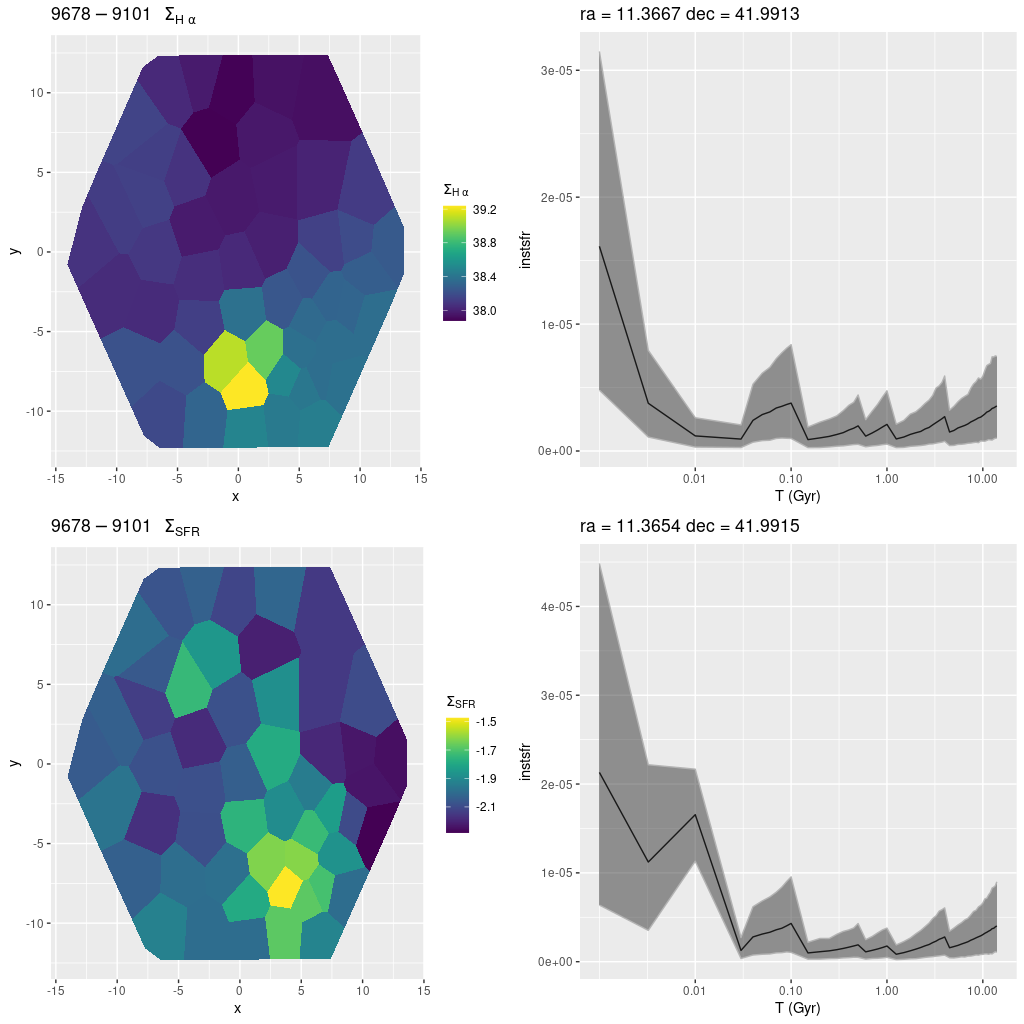
plateifu 9678-9101 (mangaid 52-26)
As mentioned at the top this appears to be in a spur off the 10 kpc ring. There is just one cataloged H II region within the footprint that appears to be compact. Just to the west there is a sprinkling of bright blue stars and an unresolved blob in the Galex color image. The H II region is evident in the map below. Once again the regions with the highest Hα luminosity and highest (100 Myr averaged) star formation rate are slightly offset from each other. The model star formation histories are very similar though.
I’m going to stop for now and cover the last 4 outer disk IFUs in (probably) the next post.