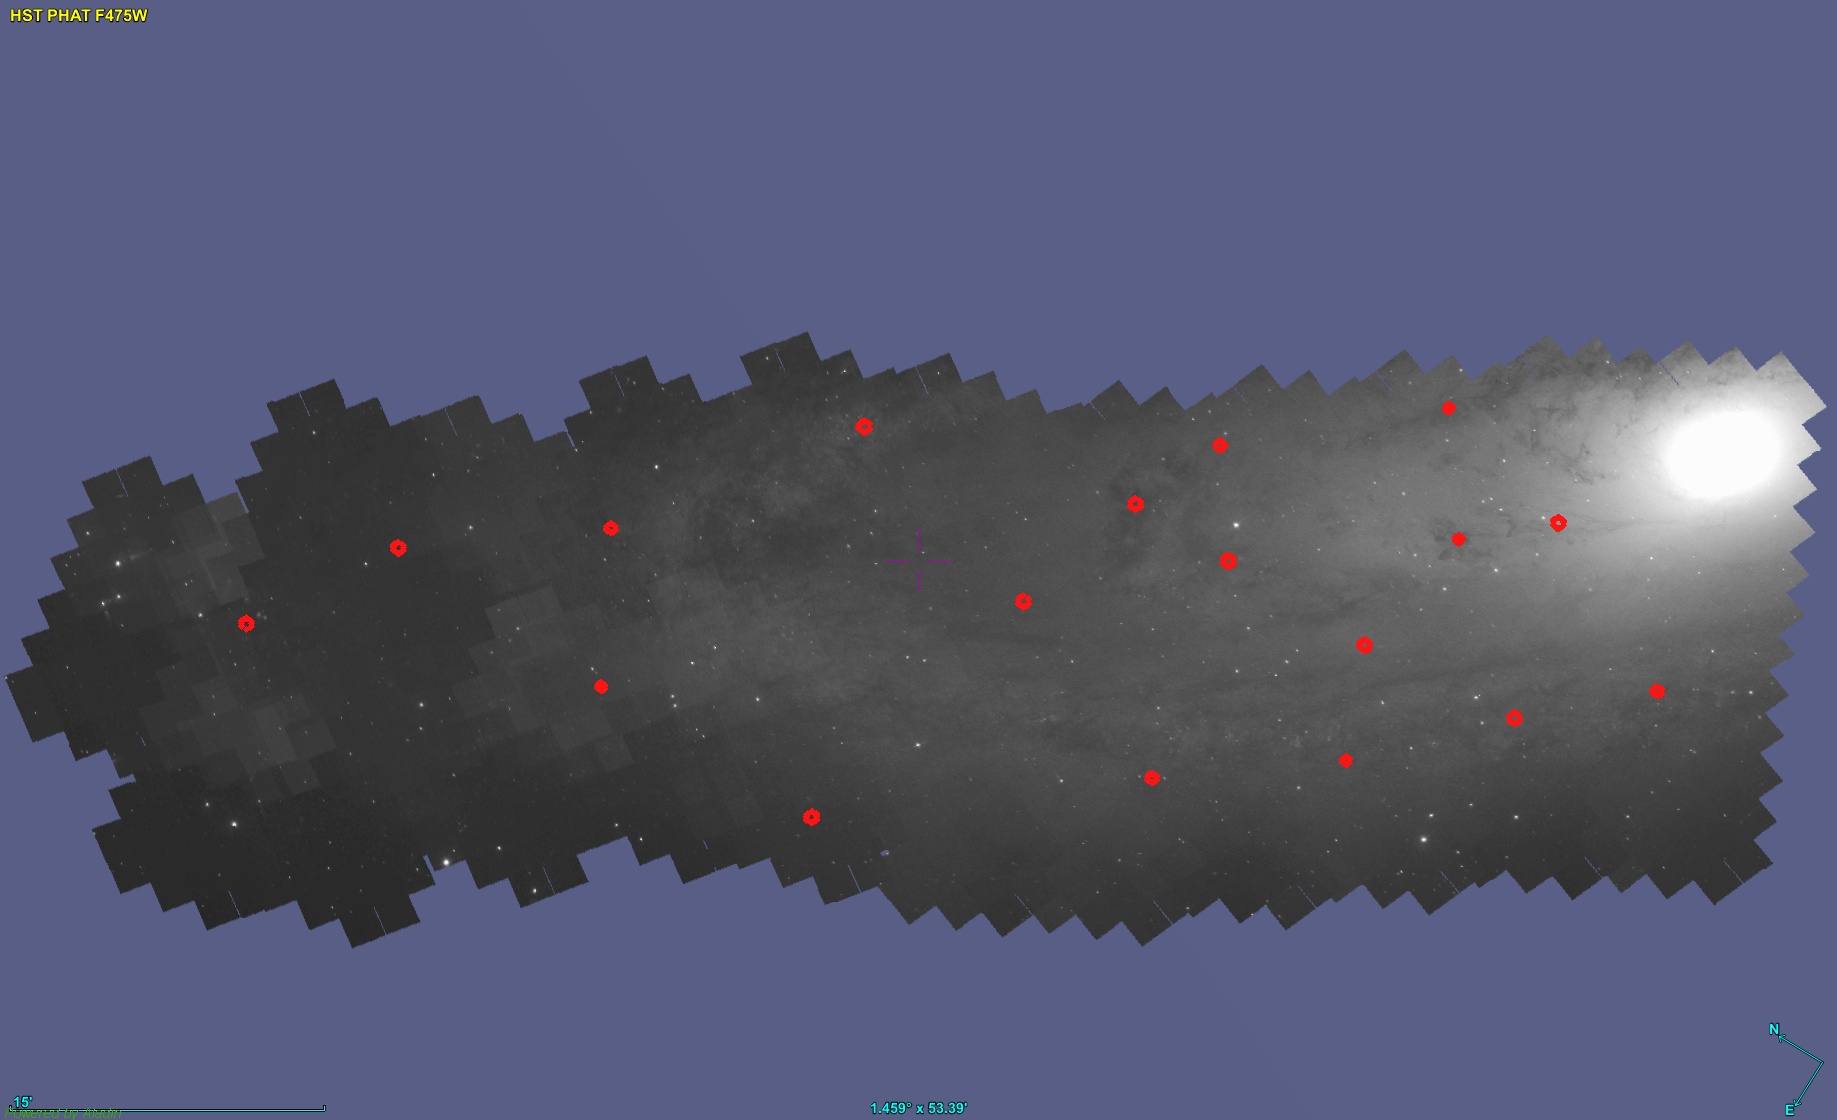
One of the ancillary programs (with principal investigator Julianne Dalcanton) in the final MaNGA release targeted 18 fields in the disk of the Andromeda galaxy M31. The targets were selected from within the footprint of the “Panchromatic Hubble Andromeda Treasury,” aka PHAT1not my coinage., also with PI Dalcanton. The initial PHAT survey description was in Dalcanton et al. (2012) and was followed by a lengthy series of papers. Especially relevant for this discussion are two papers describing estimates of the recent and ancient star formation histories of the disk outside the area dominated by bulge light: Lewis et al. (2015), “The Panchromatic Hubble Andromeda Treasury. XI. The Spatially Resolved Recent Star Formation History of M31” and Williams et al. (2017), “PHAT. XIX. The Ancient Star Formation History of the M31 Disk.” For reference here is a mosaic of HST images in the F475W filter with the IFU locations overlaid:
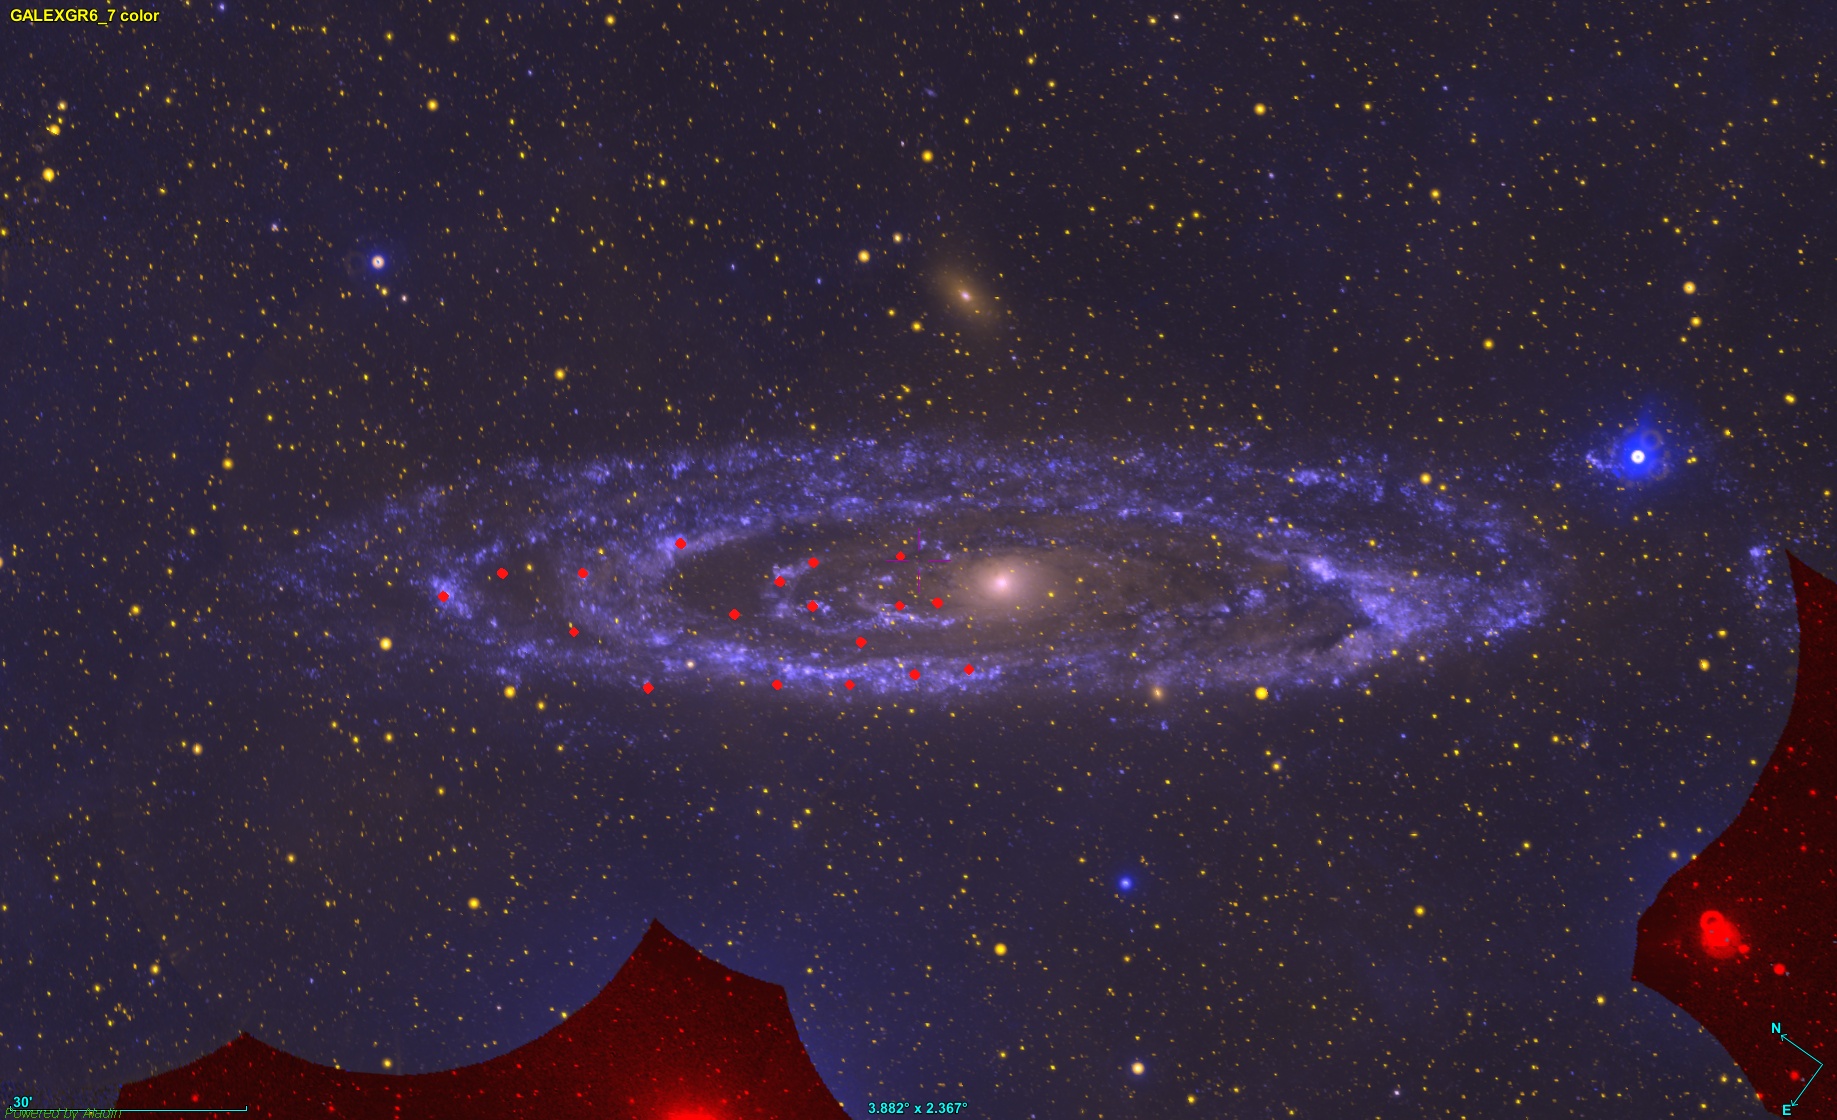
Zooming out to show the whole disk here they are overlaid on a false color FUV+NUV image from GALEX, which gives a pretty good picture of where stars are actually forming:
This data set provides an excellent opportunity to compare my SFH modeling code to a completely different, more direct, method of inferring star formation histories namely counting resolved stars in color magnitude diagrams. I recently completed model runs for all 18 IFU’s with the same Voronoi binning of stacked RSS spectra, the same modeling code and SSP model spectra as I’ve used for a while now.
There’s no redshift listed in the DRP catalog; NED gives a heliocentric redshift of -0.001, but for purposes of calculating intrinsic quantities I need the “Hubble flow” redshift. I adopted a distance of 761 (± 11) kpc or distance modulus of (m-M)0 = 24.407 from Li et al. (2021), which is the most recent and according to the authors most precise determination to date. With my adopted Hubble constant of H0 = 70 km/sec/Mpc this makes the Hubble flow recession velocity 53.27 km/sec or zdist = 0.0001777. The angular scale is 3.69 pc/arc-second. This distance estimate is a few percent smaller than the PHAT team authors and most other recent literature I reviewed, but fortunately most other sources of uncertainty are much larger.
An issue I noticed early on was the modelled values of the optical depth of attenuation were right at 0 for almost all spectra with only a few much larger exceptions. A quick check of the metadata showed that the values adopted for the foreground galactic extinction almost certainly were taken from the SFD dust maps which faithfully capture the intrinsic dust content of M31 albeit at rather low resolution. These hugely overestimate the actual foreground galactic extinction and that has multiple undesirable consequences. So, I assigned a single extinction value of E(B-V) = 0.055 to all IFU’s, consistent with the NED value of AV = 0.17 mag. The preliminary runs were redone with the newly adopted extinction value.
After binning to a minimum mean SNR of 5 there were 2,624 spectra in the 18 IFUs, of which I ran models for 2,621. Three spectra had apparent foreground stars, although one of those might actually be a red supergiant in M31. The fibers are basically sampling star cluster size and stellar mass regions so a single extremely luminous star could potentially affect a spectrum.
I’m only going to show a few summary results for the entire sample in this post. My goal is to do a more detailed quantitative comparison to (at least) the SFH models of Wilson, for which there are extensive results tabulated. There are of course many catalogs of interesting objects within M31, and I plan to look at some of them.
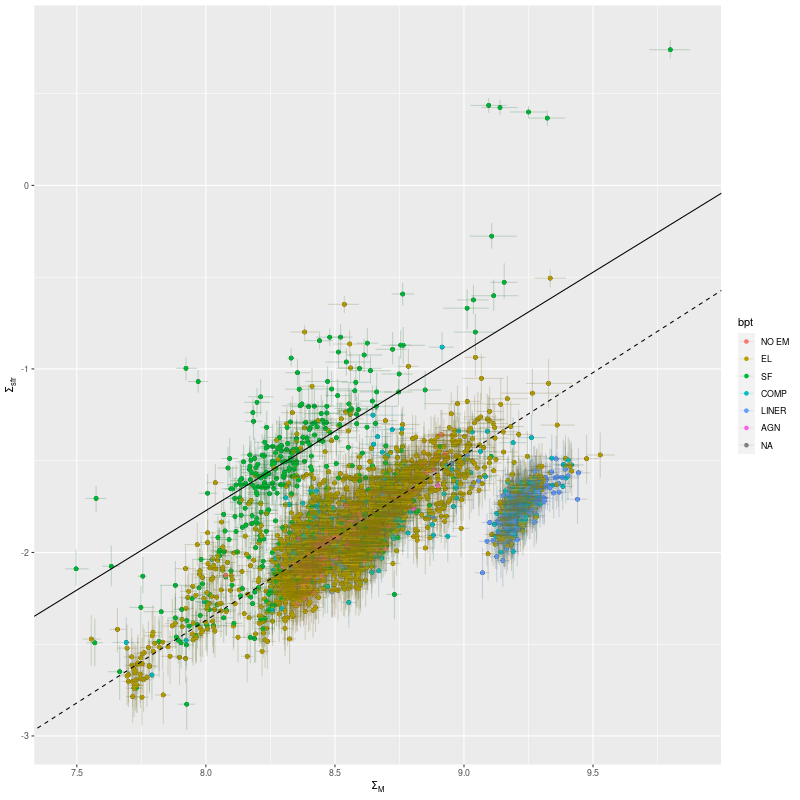
First, here is a plot of the (100 Myr averaged) star formation rate density against stellar mass density, color coded by BPT diagnostic. The solid line is my estimate of the “spatially resolved star forming main sequence” based on a small sample of non-barred spiral galaxies. The dashed line is the estimate of Bluck et al. (2020), which I commented previously appears to mark approximately the location of the green valley at least with regard to my models. A striking feature of this plot is the apparent stratification into at least three distinct groups that can be interpreted as starforming, quiescently evolving, and passively evolving. I suspect this observed stratification is just the result of hand picking a small number of “interesting” regions. Most or perhaps all of the points in the passively evolving group are in the IFU closest to the bulge, while most of those along and above the SFMS lie near the most vigorously star forming regions in the PHAT footprint. Especially noteworthy are 5 outliers that are well above any others in the plot in terms of SFR density. These are all in the same IFU (plateifu 9678-12703) which is located within the largest star forming region in that quadrant of the “10 kpc ring.”
Next are plots of star formation rate density against Hα luminosity density. The left panel is for all spectra color coded by BPT diagnostic, with Hα adjusted by the modeled amount of
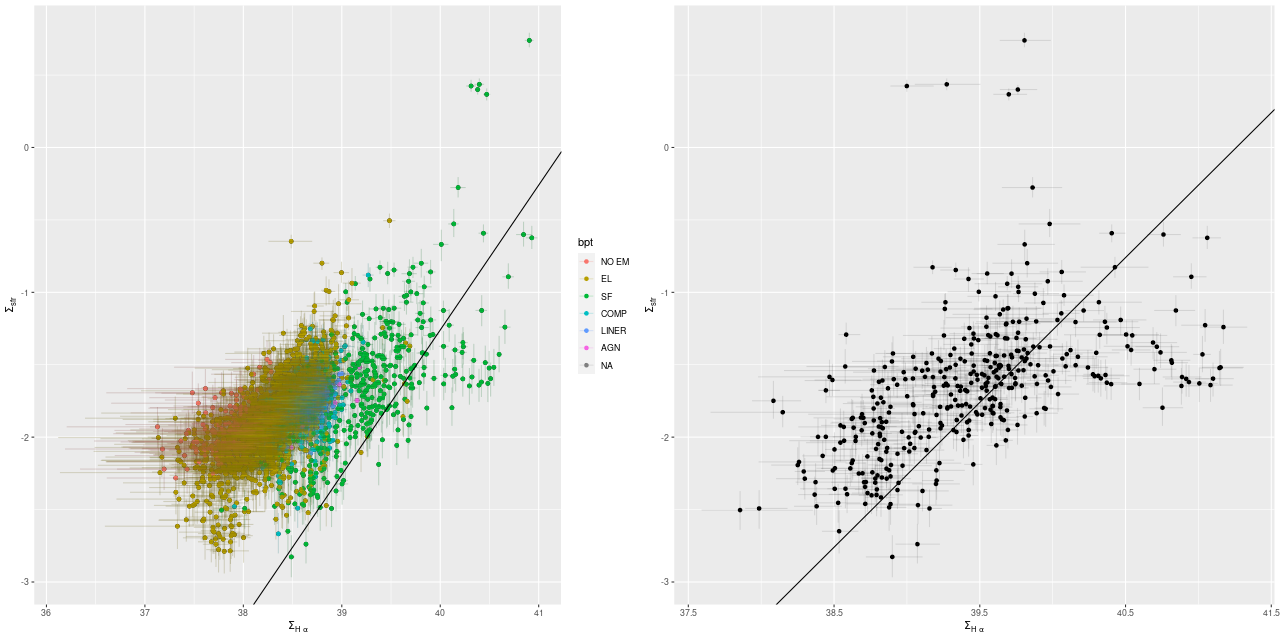
The obvious point of comparison to my models are the detailed star formation histories in the two PHAT papers mentioned at the top. Unfortunately there is no detailed tabulation of model results in the paper by Lewis et al. The paper by Williams et al. has extensive tables, but there are still a few obstacles to detailed comparisons which I will discuss next time.
A few more items from my handwritten notes that I want to get in pixels. I have never previously tried to correct surface densities for inclination in disk galaxies, but for comparison purposes and because of the large inclination of M31’s disk I need to do so here. I adopted an inclination angle of 77°, so a 1″ radius fiber covers a 3.69 x 16.4 pc (semi major and minor axes) elliptical region, or 190 pc2. Densities need to be adjusted downward by a factor 4.45 or -0.648 dex2This adjustment was not made in the plots above. Since these are plots of densities against densities all points would just shift downwards along lines of slope one..
In order to achieve 100% coverage of the IFU footprints the exposures were dithered to three different positions with overlapping fiber positions. Comparing the area in fibers to the area in spaxels in the cubes the overfilling factor averages 0.217 dex or 65%. The total area in all cubes is 10,731 arcsec2, or a deprojected area of 0.65 kpc2. The most distant IFU from the nucleus is at a projected radius of about 16 kpc. A simple extrapolation to the ≈800 kpc2 area of the disk within that radius is probably unsafe.
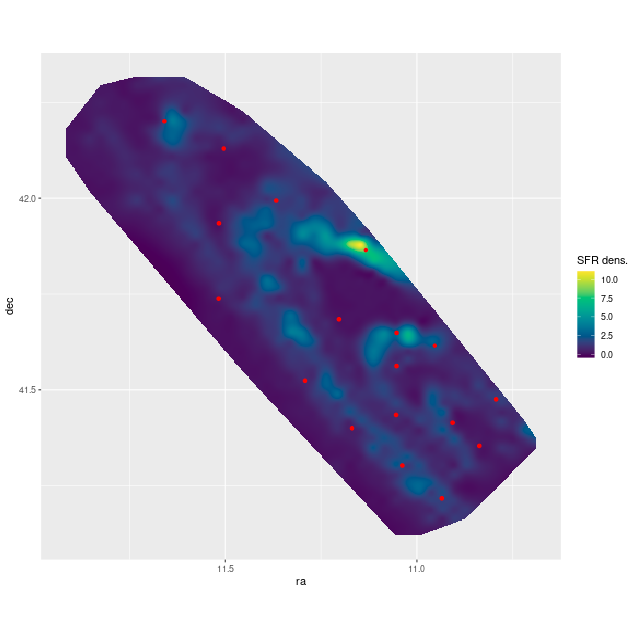
One final map to anticipate the next post(s). Wilson provides tables of model star formation rates for 16 age bins, 826 regions, and 4 different sources of isochrones including the same BASTI isochrones I use. The complete data set is available through Vizier. In the plot below I created a map of the recent star formation rate density interpolated to nominal 10″ resolution from their Table 2 models with BASTI isochrones. This should be compared to their Figure 16 (they use logarithmic scaling).