Modeling Star Formation Histories

As I mentioned in the first post I’ve been doing star formation history (SFH) modeling by full spectrum fitting of galaxy spectra for several years. I’m going to quickly review what I do as a prelude to the next several posts where I plan to look at my proto-K+A galaxy in more detail. I’ll probably return to modeling details in the future. I still haven’t reached the point of having version controlled code let alone “publishing” it, but that’s not far off (I hope).

Full spectrum fitting is actually pretty simple, especially since other people have already done the hard work. The basic observational data is a set of monochromatic fluxes \(g_{\lambda}\) with estimated uncertainty at each point \(\lambda\) (\(\lambda\) is just a discrete valued index here) \(\sigma_{\lambda}\) or precision (inverse variance) \(p_{\lambda} = 1/\sigma^2_{\lambda}\) . For now let’s assume that observed fluxes are independently gaussian distributed with known variances (yes, this is a simplification).

The second main ingredient is a set of template spectra \(T_{\lambda, n}, n = 1, \ldots, N\), which nowadays usually comprises model spectra from a library of simple stellar population (SSP) models. If the physical parameters of the templates span those of the galaxy being modeled its spectrum would be fit with some nonnegative combination of the template spectra:

\(g_{\lambda} = \sum_{n=1}^N \beta_n T_{\lambda, n} + \epsilon_{\lambda}, ~~\beta_n \ge 0~~ \forall n\)


and by assumption the errors \(\epsilon_{\lambda}\) are gaussian distributed with mean 0 and standard deviation \(\sigma_{\lambda}\).

The spectroscopy  we deal with is high enough resolution to be blurred by the constituents of the galaxy, so an additional ingredient is the “line of sight velocity distribution” (LOSVD), which must be convolved with the templates. Finally, it’s common to include additive or multiplicative functions to the model to allow for calibration variations or to model attenuation. I hopefully assume calibrations are well matched between observations and models and only attempt to model attenuation, usually with a Calzetti relation parametrized by optical depth. So, the full model looks like:

\(g_{\lambda} = \sum_{n=1}^N \beta_n  (\mathcal{L}(v_n) \ast T_{\lambda, n}) \exp(-\tau_{V, n} A_{\lambda}) + \epsilon_{\lambda}, ~~\beta_n \ge 0~~ \forall n\)


where the \(v_n\) are (possibly vector valued) parameters of the LOSVD and \(\tau_{V,n}\) is the dust optical depth at V. These are nominally indexed by n to indicate that there may be different values for different model constituents. In practice I only consider a few distinct components.

An important insight of Cappellari and Ensellem (2004) that was dismissed in two sentences is that conditional on the parameters of the LOSVD and any multiplicative factors the subproblem of solving for the coefficients \(\beta_n\) is a linear model in the parameters with nonnegativity constraints, for which there is a fast, deterministic least squares algorithm due originally to Lawson and Hanson (1974). This greatly simplifies the nonlinear optimization problem because whatever algorithm is chosen for that only needs to optimize over the parameters of the LOSVD and optical depth. I currently use the general purpose optimization R package Rsolnp along with nnls for SED fitting. This is all similar to Cappellari’s ppxf but less versatile; my main interest is in star formation histories and I’ve found a better way to estimate them in a fully Bayesian framework. These days I mostly use the maximum likelihood fits as inputs to the Bayesian model implemented in Stan.

I have used several SSP libraries, but the workhorses recently have been subsets of the EMILES library with BaSTI isochrones and Kroupa IMF, supplemented with some unevolved models from BC03. One thing I do that’s not unprecedented but still somewhat unusual is to fit emission lines simultaneously with the stellar library fits. I do this by creating fake emission line spectra, one for each line being fit (usually the lower order Balmer lines and selected forbidden lines).

The models that I’m likely to discuss for the foreseeable future use separate single component gaussian fits to the stellar and emission line velocity distributions. I assume the velocity offsets calculated in the first step of the analysis are accurate, so the mean of the distributions is set to 0. I also use a single component dust model, usually with Calzetti attenuation relation. I don’t try to tie the relative strengths of emission lines, so attenuation is only directly modeled for the stellar component. These assumptions are obviously too simple for galaxies with broad emission line components or interacting galaxies with overlapping stellar components. For now I plan to ignore those.

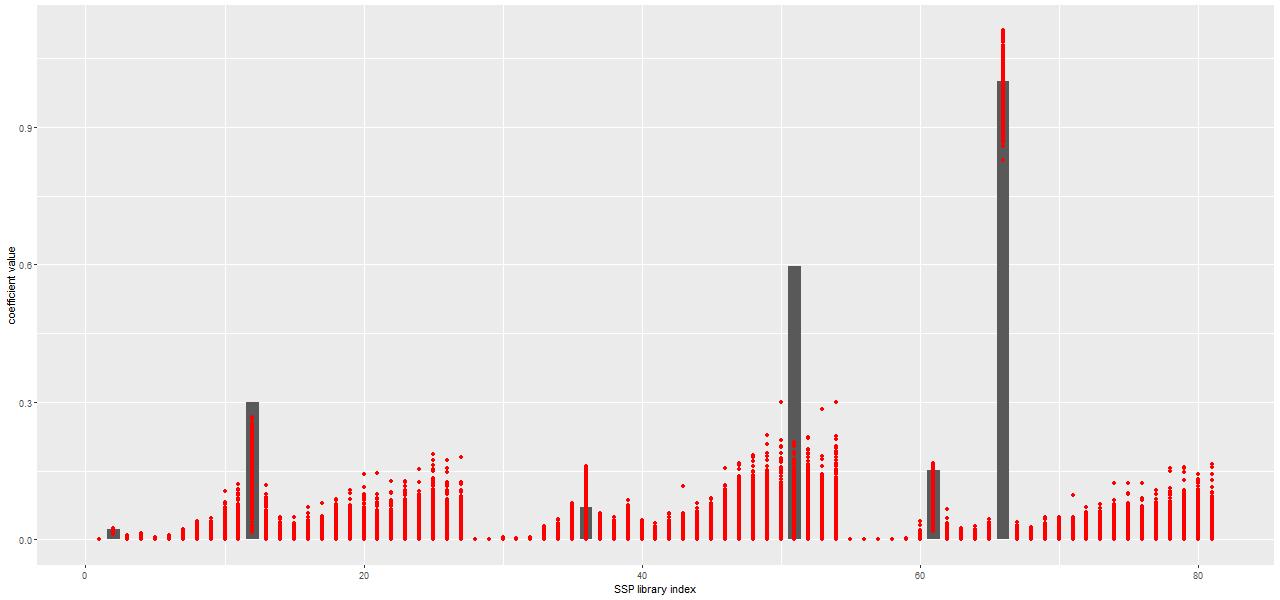
One interesting property of the NNLS algorithm for this application is that it always returns a parsimonious solution for the stellar component, with usually only a handful of contributors. An example of a solution from a fit to the central spectrum of the proto-K+A galaxy I introduced a few posts ago is shown below. The grey bars are the optimal contributions (proportional to the mass born in each age and metallicity bin) from the elements of the SSP library. This particular subset has 3 metallicity bins and 27 age bins ordered from low to high.

Only six (actually a seventh makes a negligible contribution) SSP model components are in the optimal fit, out of 81 in this particular library. Usually in statistics sparsity is considered a highly desirable property, especially in situations like this with a large number of explanatory variables. Considerable effort has been made to derive conditions where non-negative least squares, which has no tuning parameters, automatically produces sparse solutions (see for example Meinshausen 2013). However in this context sparsity is maybe not so desirable since we expect star formation to vary continuously over time in most cases rather than in a few short bursts as would be implied here: as a Bayesian my prior assigns positive probability density to star formation at all times.

But in the absence of a parametric functional form for star formation histories a fully Bayesian treatment of SED modeling is an extremely difficult problem. The main issue is that model spectra are highly correlated; if we could visualize the N dimensional likelihood landscape we’d see a long, curving, steep sided ridge near the maximum. I’ve tried a number of samplers over the years including various forms of Metropolis-Hastings and the astronomers’ favorite EMCEE and none of them are able to  achieve usable acceptance rates. A few years ago I discovered that the version of “Hamiltonian Monte Carlo” (informally called the No U-Turn Sampler, or NUTS) implemented in the Stan modeling language is capable of converging to stationary distributions in a tractable amount of time. In the plot below the red dots indicate the range of values taken by each SSP model contribution in the post-warmup sample from a Stan run. Now all time and metallicity bins are represented in the model in amounts that are at least astrophysically plausible. For example instead of a single old component as in the NNLS fit the pre-burst history indicates continuous, slowly declining star formation, which is reasonable for the likely spiral progenitors.

sspfitexample
Sample non-negative maximum likelihood SSP fit to full spectrum and Stan fit compared

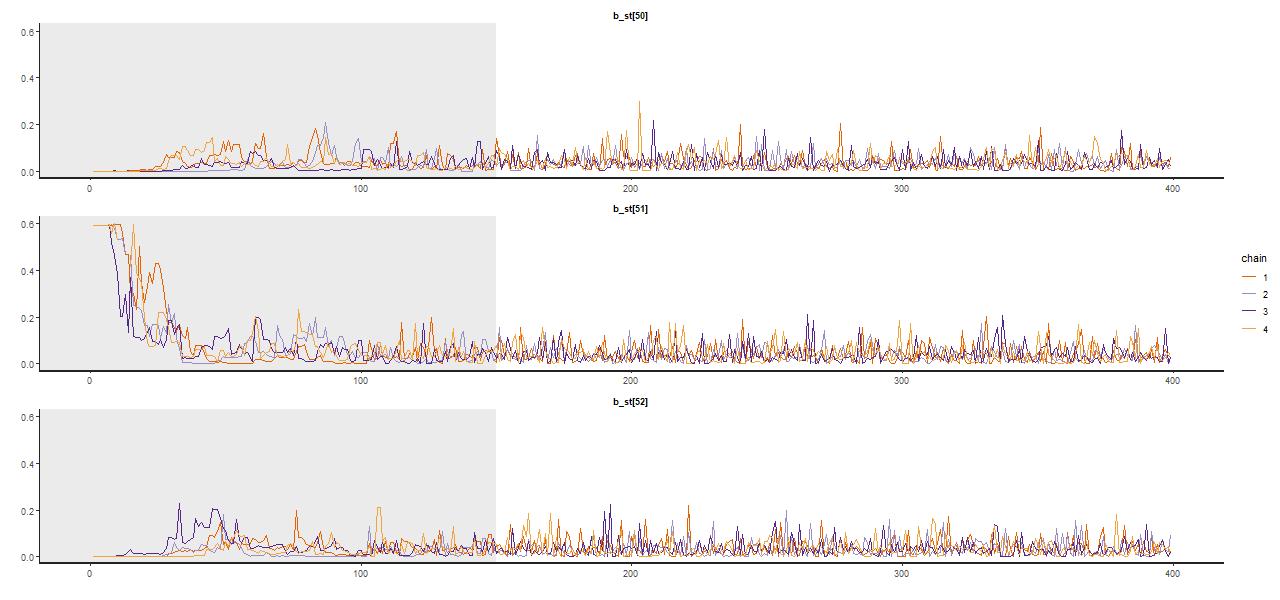
A trace plot, that is a sequential plot of each draw from the sampler, is shown for a few parameters below — these are the single old component in the maximum likelihood fit and the two in the surrounding age bins. Samples spread out rather quickly from the initialized values at the MLE, reaching in this case a stationary distribution about 2/3 of the way through the adaptation interval shown shaded in gray; I used a rather short warmup period of just 150 iterations for this run (the default is 1000, while I generally use 250 which seems adequate). There were 250 post warmup iterations for each of 4 chains in this run. No thinning is needed because the chains show very little autocorrelation, making the final sample size of 1000 adequate for inference. Most physical quantities related to the stellar contributions involve weighted sums of some or all coefficients, and these typically show little variation between runs.

stan_traceexample
Sample traceplot from Stan run

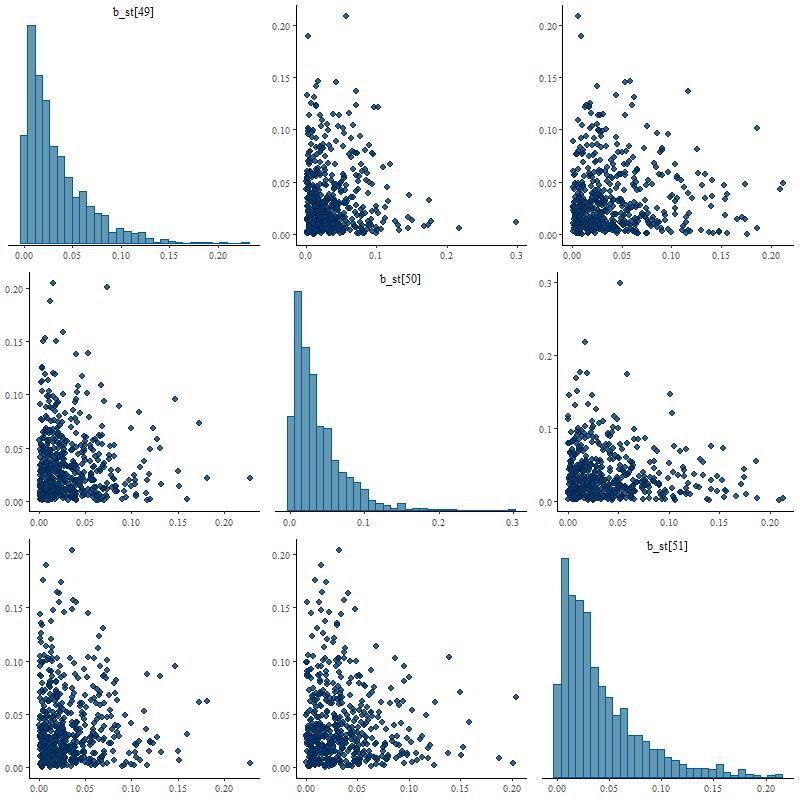
Posterior marginal distributions often have very long tails as shown here. This can be a problem for MCMC samplers and Stan is quite aggressive in warning about potential convergence issues. The quantities that I track tend to have much more symmetrical distributions.

stan_pairsexample
Sample marginal posterior distributions of stellar contributions

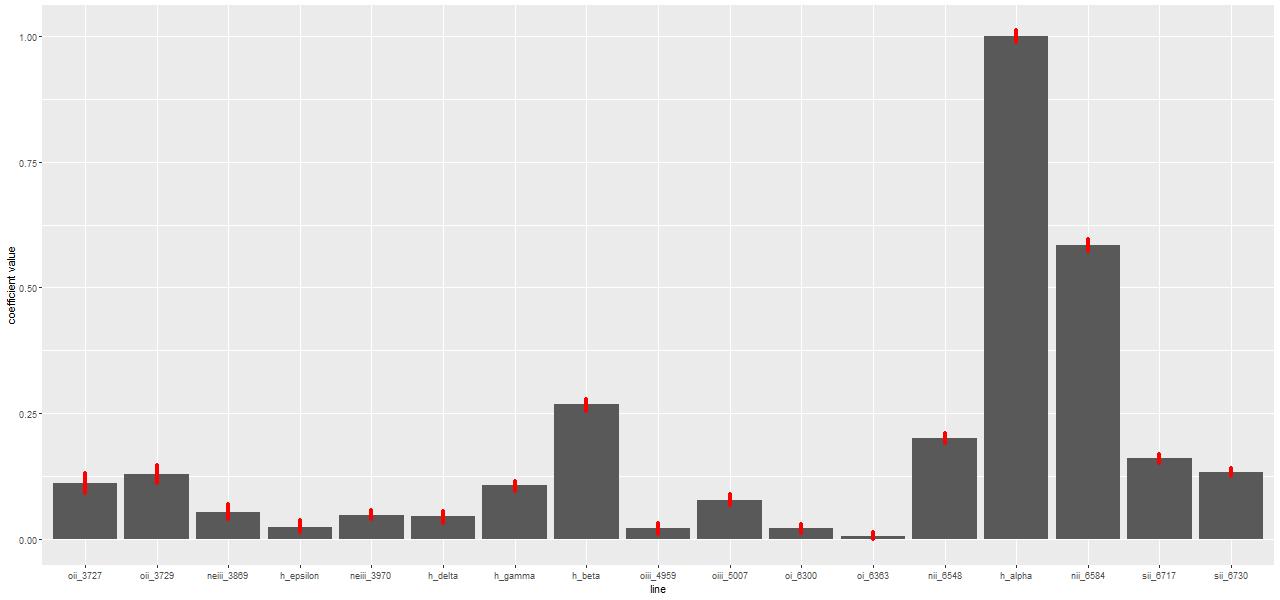
Fits to emission lines tend to behave differently. If they’re actually present the MLE will have positive contributions (the coefficients are proportional to emission line fluxes). On the other hand in a passively evolving galaxy with no emission lines the MLE estimate is typically sparse, that is coefficient estimates will tend to be 0 rather than spuriously small positive values.

emissionlinefitexample
Example maximum likelihood fit of emission lines compared to Stan fit

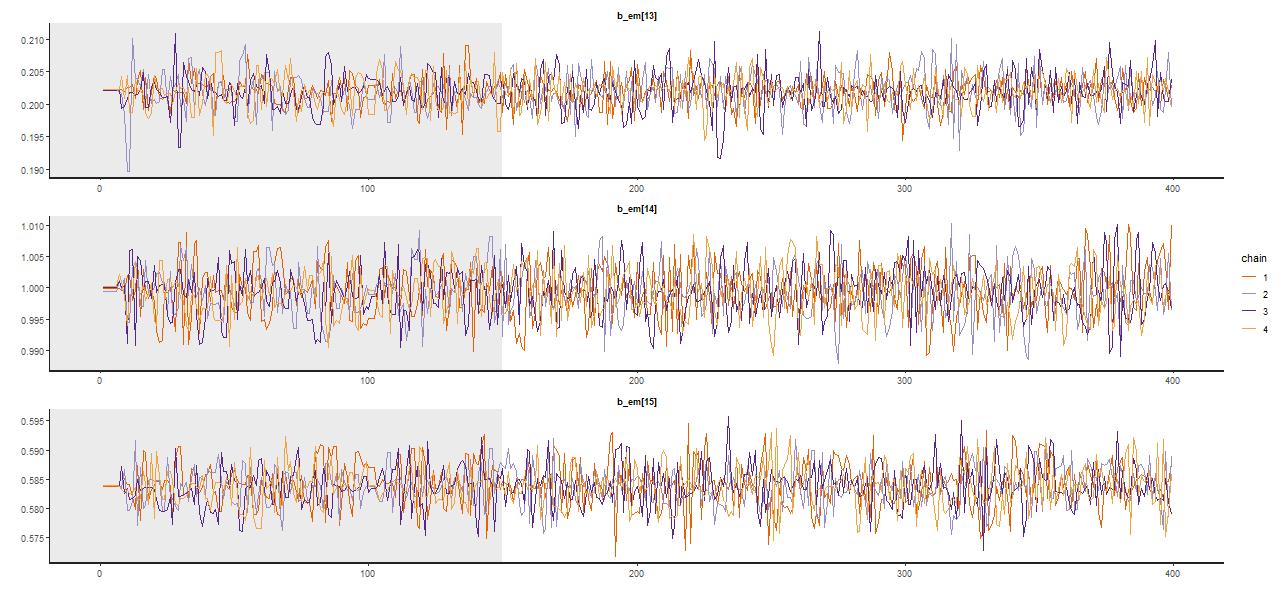
Sample values from Stan tend to stay centered on the ML fits (Hα and the surrounding [N II] lines are shown here):

stan_trace_emlineexample
Sample trace plot of emission line contributions

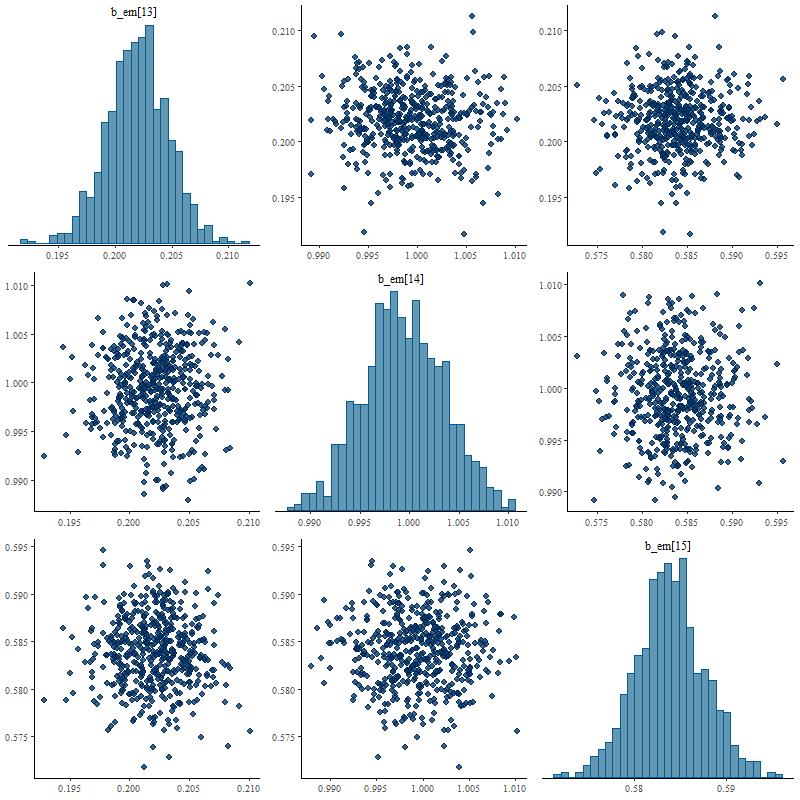
Marginal posterior distributions tend to be symmetrical, close to Gaussian, and uncorrelated with anything else (except for the [O II] 3727-3729Å doublet, which will have negatively correlated contributions).

stan_emlinepairsexample
Sample marginal posterior distributions of emission line contributions

One thing that’s noteworthy that I haven’t discussed yet is that usually all available metallicity bins make contributions at all ages. I haven’t been able to convince myself that this says anything about the actual distribution of stellar metallicities, let alone chemical enrichment histories. In recent months I’ve started looking at strong emission line metallicity indicators. These appear to give more reliable estimates of present day gas phase abundances, at least when emission lines are actually present.


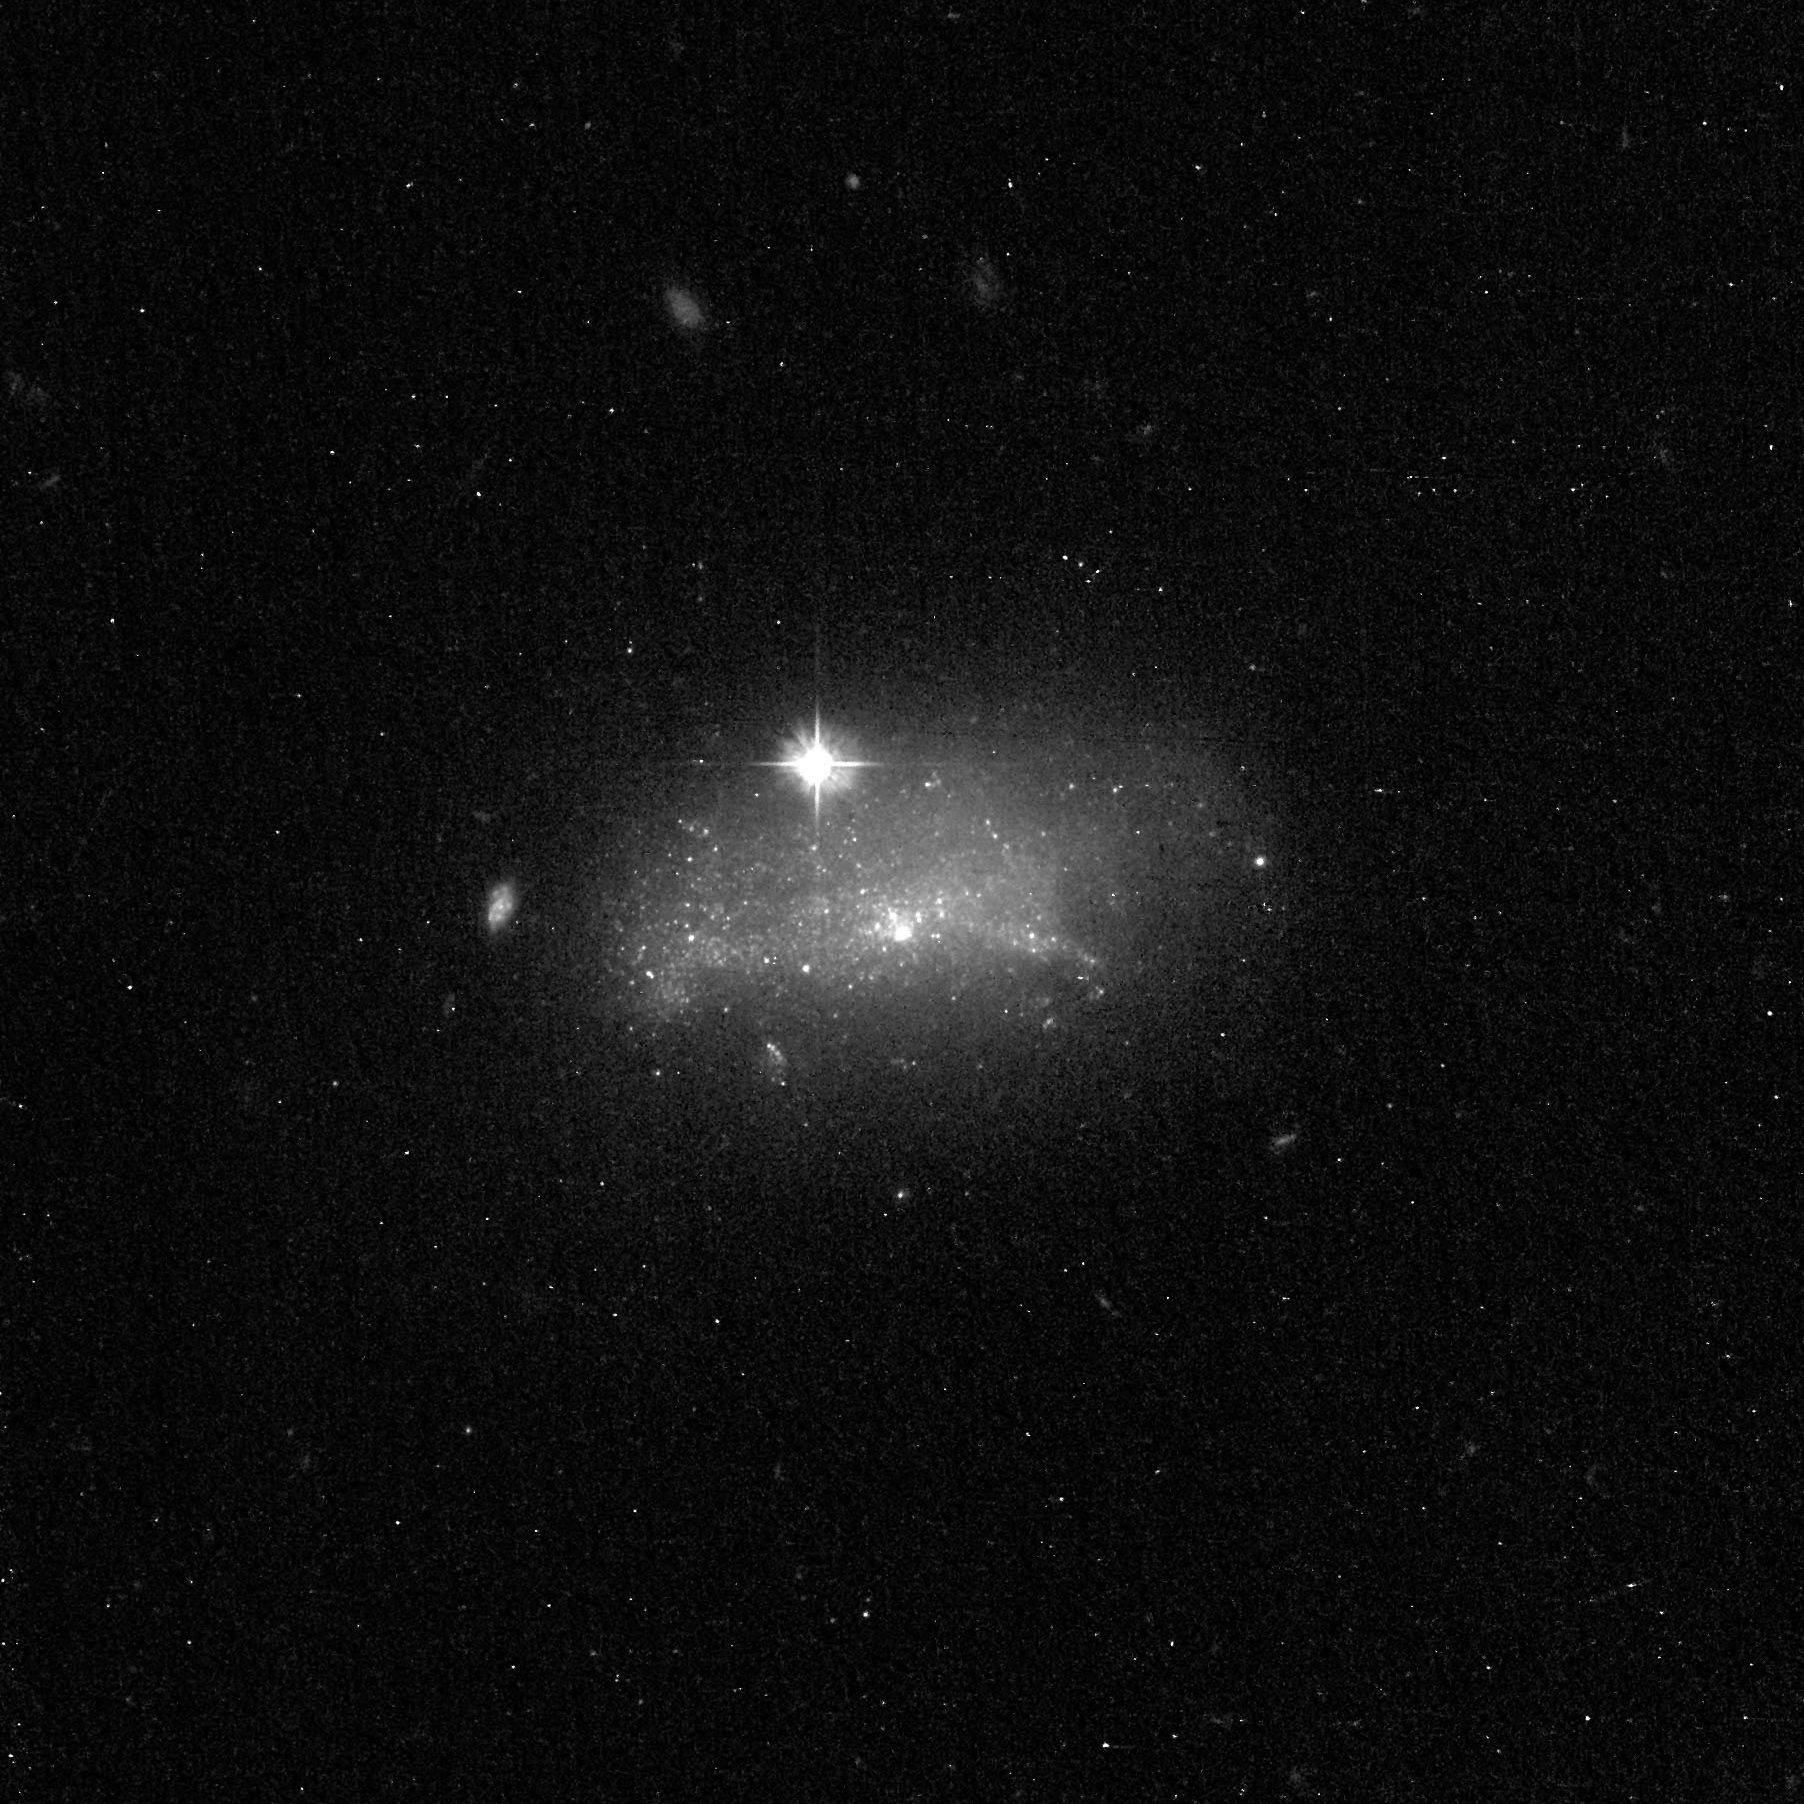
CGCG 292-024

I may as well post this here too. This HST ACS/WFC image was taken as part of SNAP program 15445, “Gems of the Galaxy Zoos,” PI Bill Keel with numerous collaborators associated with Galaxy Zoo (see also this Galaxy Zoo blog post). This is my Q&D processing job on the calibrated/distortion corrected fits file using STIFF and a bit of Photoshop adjustment.

cgcg 292-024
CGCG 292-024 HST/ACS F475W
Proposal ID 15445 “ZOOGEMS”, PI Keel

Comparing that to the finder chart image from SDSS below, which is oriented slightly differently, it appears the area observed spectroscopically was a centrally located star cluster or maybe complex of star clusters.

cgcg 292-024
CGCG 292-024 SDSS finder chart image with spectrum location marked

What interested me about this and a number of other nearby galaxies (which were discussed at some length on the old Galaxy Zoo Talk) is it has a classic K+A spectrum:

sdssspec
SDSS spectrum of central region of CGCG 292-024

that the SDSS spectro pipeline erroneously calls a star with an improbably high radial velocity of ≈1200 km/sec. Well it’s not a foreground star obviously enough, and the SDSS redshift is close but not quite right. I measure it to be z = 0.0043, or cz = 1289 km/sec, which agrees well enough with the NED value of 1282 km/sec (obtained from an HI radial velocity by by Garcia et al. 1994).

Karachentsev, Nasonova, and Curtois (2013) assign this galaxy to the NGC 3838 (which is just NW of our target galaxy) group, which they place in the background of the Ursa Majoris “cloud,” which is in turn a loose conglomerate of 7 groups about 20 Mpc. distant. They adopt a distance modulus to the group of 32.3 mag., which is a little higher than the NED value (with H0 = 70 km/sec/Mpc) for this galaxy of 31.6 mag. SDSS lists the g band psfMag as 18.7 for the spectroscopic target, which makes its absolute magnitude around -12.9.

In contrast to the appearance of the spectrum the galaxy itself doesn’t look like a typical K+A galaxy. In the local universe most field or group K+A’s are disturbed ellipticals, which are thought to be the aftermath of major gas rich mergers. This galaxy, while irregular in morphology, is not particularly disturbed in appearance and shows no sign of having recently merged. Quenching mechanisms that are thought to act in cluster environments aren’t likely to be effective here since the Ursa Majoris complex isn’t especially dense (and according to the above authors also light on dark matter). I think I speculated online that this and galaxies like it might actually be old and metal poor (having the infamous “age-metallicity” degeneracy in mind), but that doesn’t really work. Even the most metal poor galactic globular clusters are considerably redder than the spectroscopic object.

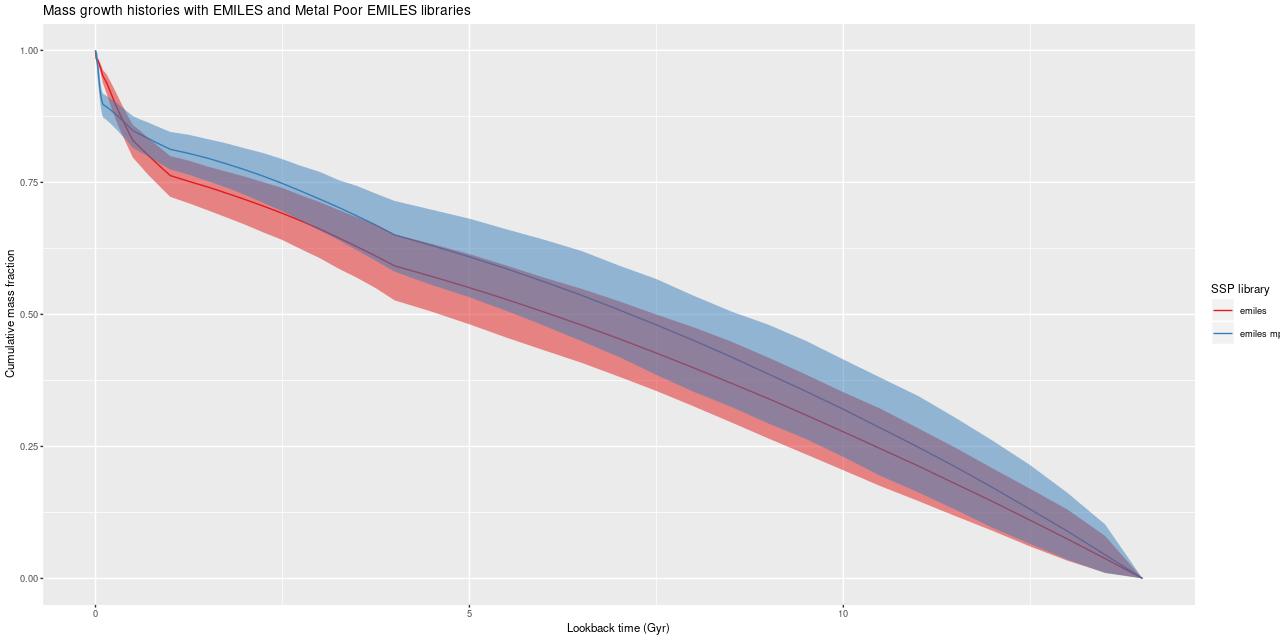
So, I did some SFH modeling, which I will describe in more detail in a future post. I currently mostly use a subset of the EMILES SSP library with Kroupa IMF, BaSTI isochrones and 4 metallicity bins between [Z/Zsun] = -0.66 and +0.40. I supplement these with unevolved models from BC03 matched as nearly as possible in metallicity. For this exercise I also assembled a metal poor library from the Z = -2.27, -1.26, and -0.25 models with all available ages from 30Myr to 14Gyr. Here are estimated mass growth histories:

cgcg292024_mgh
Estimated mass growth histories, EMILES and metal poor EMILES

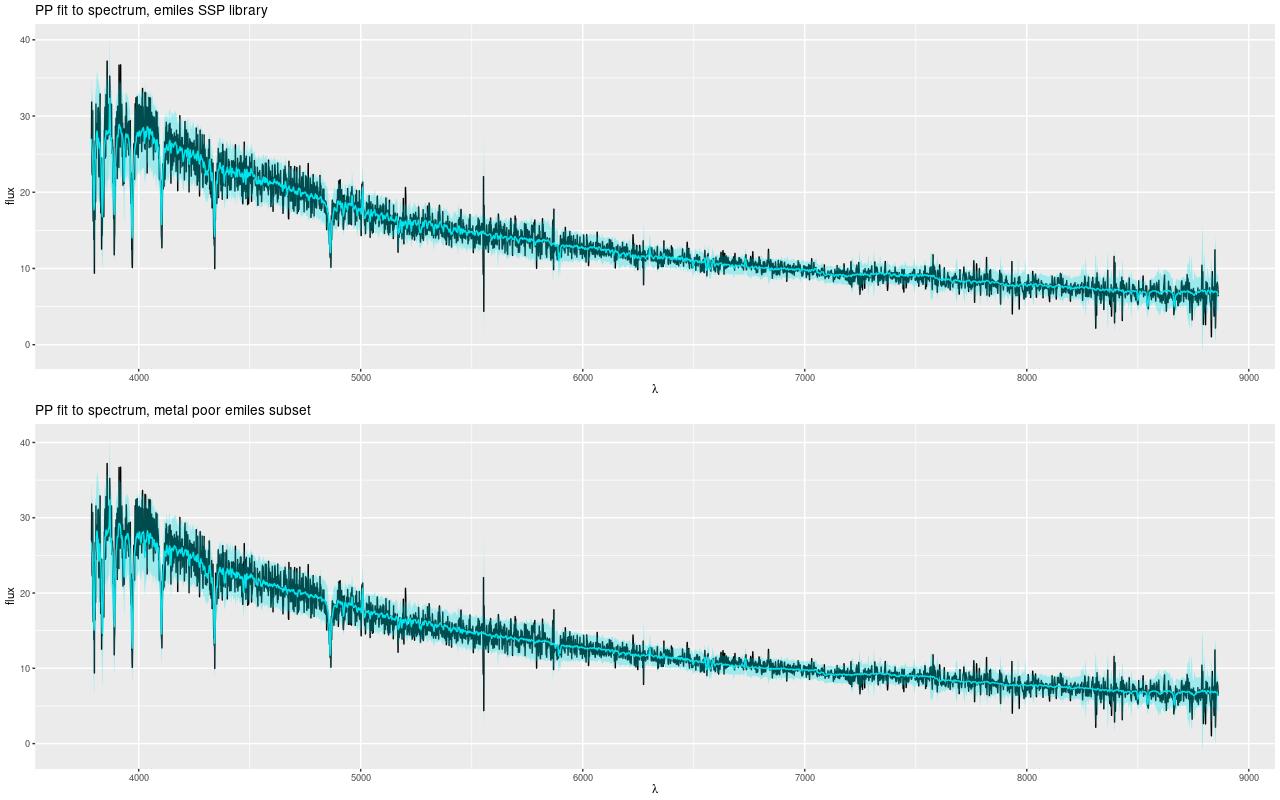
Both models have nearly constant rates of mass growth over cosmic history which implies slowly declining star formation, with the metal poor models having slightly faster early mass growth (and hence slightly older light weighted age). Neither exhibits a starburst, faded or otherwise. The “metal rich” model fits show a slight acceleration beginning about 1Gyr ago, while the “metal poor” fits have a few percent contribution from the youngest, 30Myr, population (which already has quite strong Balmer absorption). So the age-metallicity degeneracy manifests in these full spectrum fitting models as small(ish) variations in detailed star formation histories. The fits to the data are indistinguishable:

cgcg292024_ppfit
Posterior predictive fits to SDSS spectrum of central region of CGCG 292-024

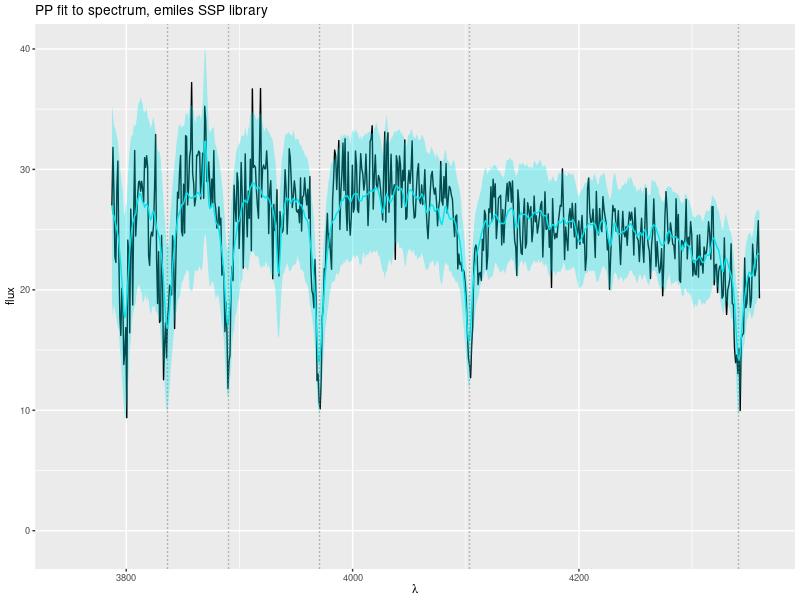
The fits to the Balmer lines appear to be systematically weak but this seems to be an artifact. Zooming in on the blue end of the spectrum the posterior predictive fits match the full depth of the absorption lines (Balmer lines from Hγ to Hη are marked)[1]:

Posterior predictive fit to blue part of spectrum

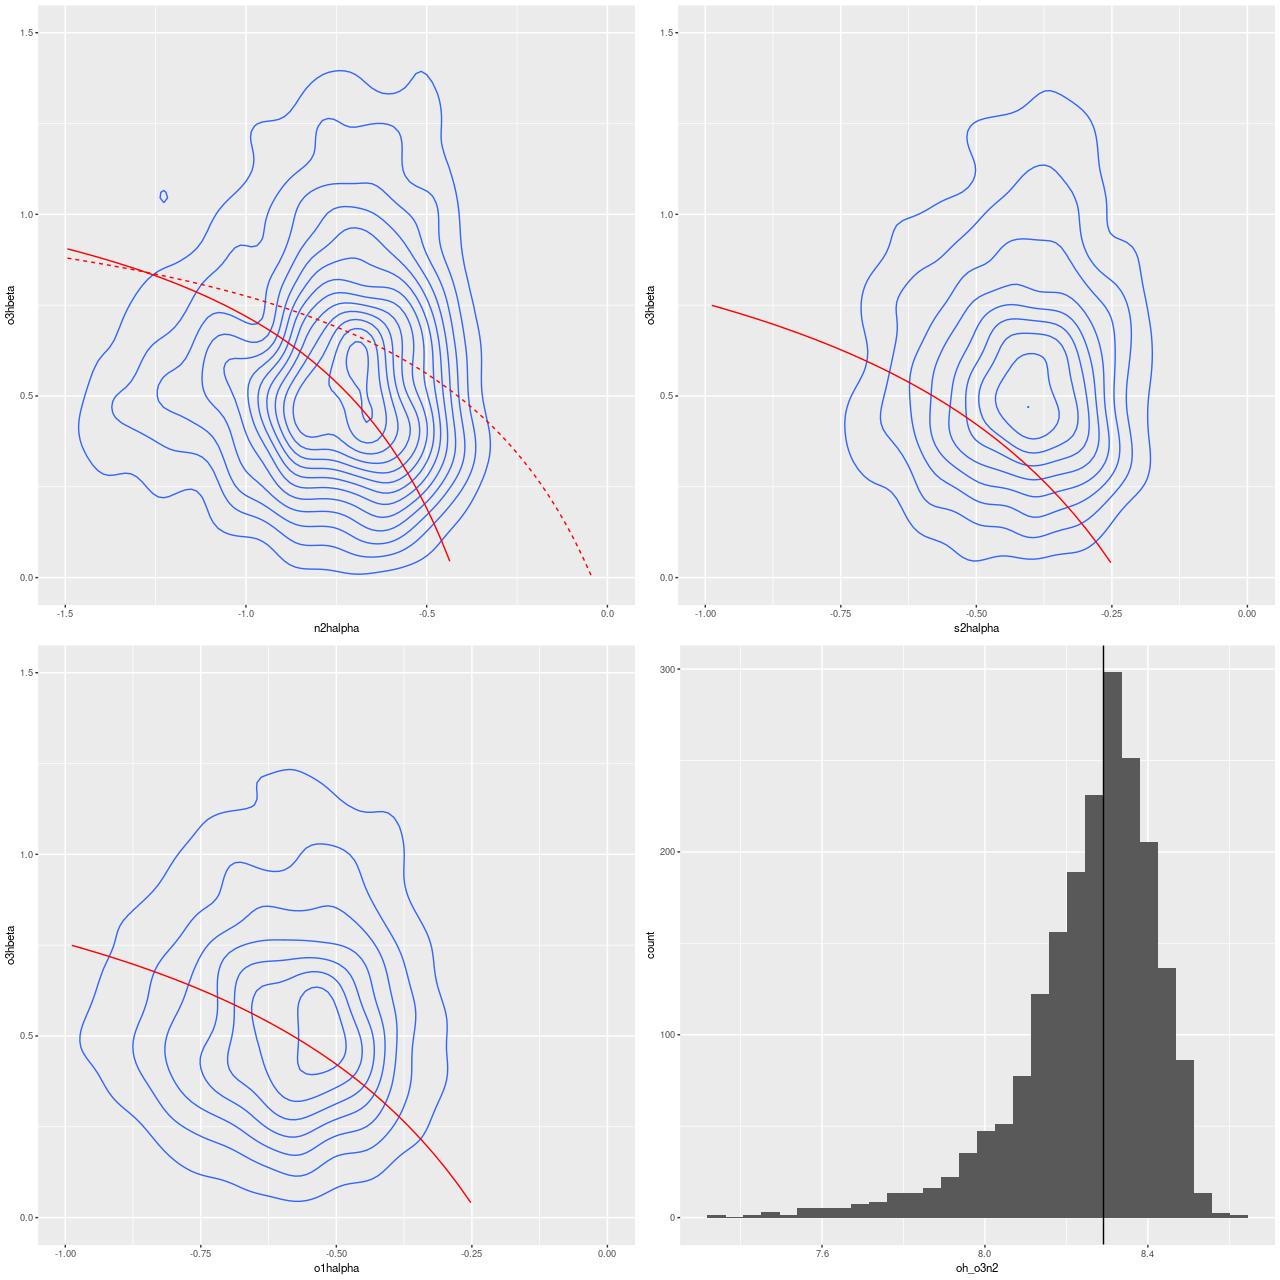
While weak there is some ionized gas emission (note for example that Hα is completely filled in, which implies the emission equivalent width is ~several Å). Here are BPT diagnostic plots for [N II]/Hα, [S II]/Hα, and [O I]/Hα vs [O III]/Hβ. The contours indicate the joint posterior density of the line ratios with arbitrary spacing. The lines are the usual SF/something else demarcation lines from Kewley et al. Although the constraints aren’t very strong most of the probability mass lies outside the starforming region, suggesting that the area sampled by the fiber is at least for now “retired.”

The BR panel of the plot shows the estimated posterior distribution of the “strong line” metallicity indicator O3N2 with the calibration of Pettini & Pagel (2004). This does indicate that the gas-phase metallicity is sub-solar by about 0.6 dex.

cgcg292024_emissionlinediagnostics
BPT diagnostics and strong line metallicity estimate for CGCG 292-024

Conclusion?: I think we’re most likely seeing the effect of stochastic star formation (in time and maybe space as well). The region sampled by the fiber has an estimated (by me) stellar mass slightly lower than \(10^7 M_{\odot}\), which is probably low enough for supernova feedback to at least temporarily suppress star formation. Without more data it’s hard to tell if star formation is globally suppressed at present, but there’s no real reason to think it is. There is a supply of neutral Hydrogen available (see Garcia et al. linked above and Serra et al. 2012), so star formation could well resume any time.

Continue reading “CGCG 292-024”

A proto-K+A elliptical in MaNGA (part 1)

This isn’t quite an accidental “discovery.” There’s been a fair amount of interest in recent years in finding “transitional” galaxies that are rapidly shutting down star formation but that don’t meet the traditional criteria for K+A galaxies (see for example Alatalo et al. 2014, 2016; Wild et al. 2007 among many others). A while back I made my own effort at assembling a sample of post-starburst candidates by looking for spectra in SDSS with strong Hδ absorption and emission line ratios other than starforming in the MPA data tables. This sample had some thousands of candidates, of which there are just 26 in the first two MaNGA data releases. As many as half of those were false positives, which is a little too high, so it’s back to the drawing board. But there were a few interesting hits:

KUG 0859+406
KUG 0859+406 image cutout from legacysurvey.org

This legacysurvey.org cutout (from the MzLS+BASS surveys) shows clearly a pair of tidal tails and some shells, clear signs of a recently consummated merger. The region covered by the IFU footprint on the other hand looks rather featureless:

8440-6104
Plateifu 8440-6104 (mangaid 1-216976) SDSS cutout with IFU footprint

In the remainder of this post I’ll look at a few measured, not too model dependent, properties of the IFU data. In future post(s) I’ll look at the results of star formation history models and other model dependent properties. One thing I’m interested in learning more about is if SFH models of merger remnants tell us anything about the chronology of mergers. We’ll see!

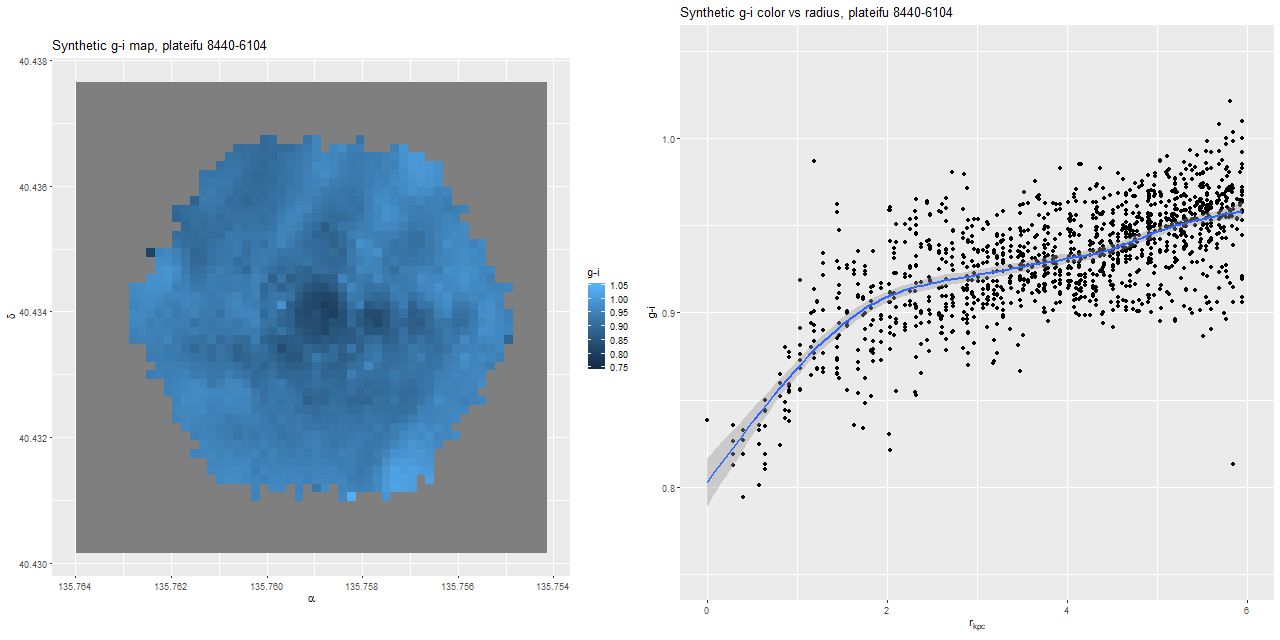
MaNGA data cubes include synthesized griz images created by projecting the spectra onto the filter transmission functions at each spaxel. Below is a g-i color map from these synthetic images, with the color corrected for galactic extinction but not any internal attenuation that might be present. There are hints of structure that indicate the merger remnant hasn’t quite reached equilbrium, but more importantly there is a clear positive color gradient with radius as seen on the right, with a turnover in the slope of the gradient at ≈2 kpc. A positive color gradient is the opposite of what would be seen in a normal disk galaxy, but exactly what we’d expect from the aftermath of a major merger with a centrally concentrated starburst.


colortrend_8440-6104
L: Synthetic g-i map from IFU data cube, plateifu 8440-6104 (mangaid 1-216976)
R: g-i color trend with radius

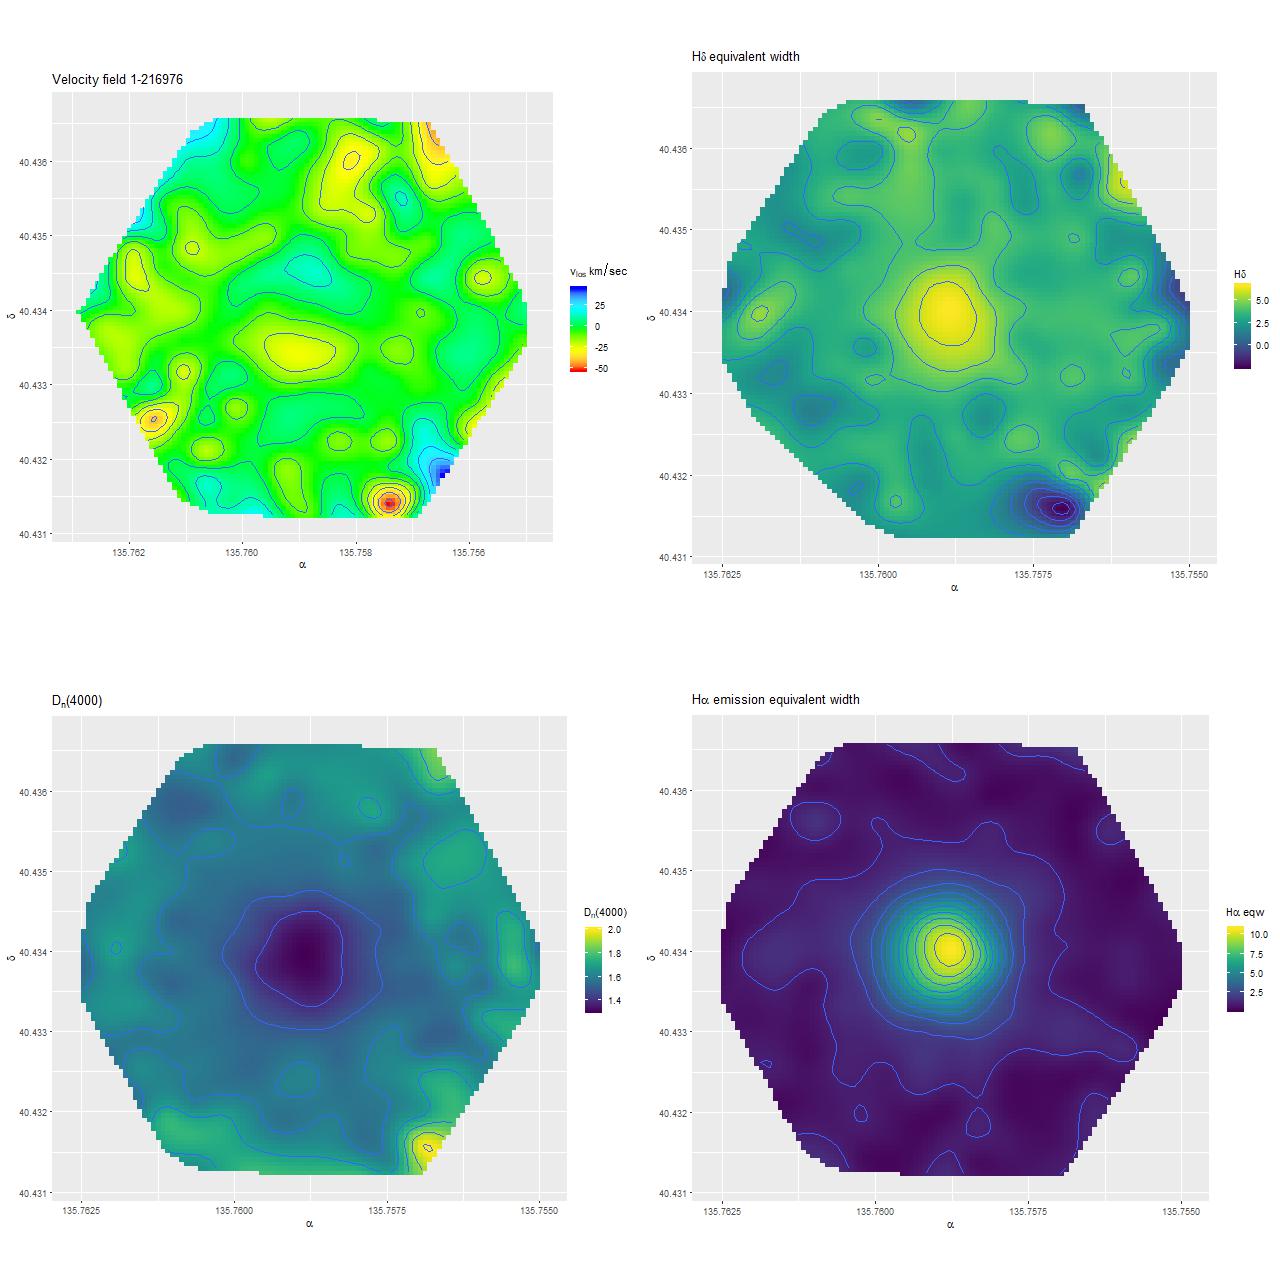
Several measured quantities are shown below. The input data for these were the stacked RSS files, with the measurements interpolated onto a fine grid for visualization. The velocity field (top left) has several interesting features. First, there is no apparent overall rotation, but the symmetrical pair of lobes with opposite velocity signs just outside the nucleus indicate the presence of a rotating disk or torus. These are known as “kinematically distinct cores” and are somewhat common in early type galaxies (for example Krajnovic et al. 2011), and are expected in some cases in major gas rich mergers (eg Bekki et al. 2005).

The other three panes of this plot are the equivalent width in absorption of the Balmer line Hδ (TR), the 4000Å break strength D\(_n\)(4000) (BL), and Hα emission equivalent width (BR). Hδ is a measure of Balmer absorption line strength and is sensitive to the presence of an intermediate age population. A threshold of around 5Å is usually used to select post-starburst galaxies (eg Goto 2005). My measured peak line strength is \(6.5 \pm 0.2 \)Å (the same as the MPA estimated emission corrected value for the SDSS fiber spectrum), and the inner \(\approx 1.5\) kpc. has Hδ > 5Å, with scattered regions at larger radius also exceeding this threshold (although measurement errors are much larger). However emission line strengths are too large in the central region for traditional K+A selection criteria, which usually require Hα equivalent width (in emission) \(\lesssim 3-5\)Å. I estimate the peak Hα equivalent with to be about 11Å (my code for this is still experimental and hasn’t been validated against other measurements. The MPA value for the SDSS fiber was 14Å. My absorption line index measurements and uncertainty estimates on the other hand agree very well with the MPA values, so I consider them well validated).

observables_8440-6104
Velocity field, Hδ equivalent width, 4000Å break strength, Hα emission equivalent width

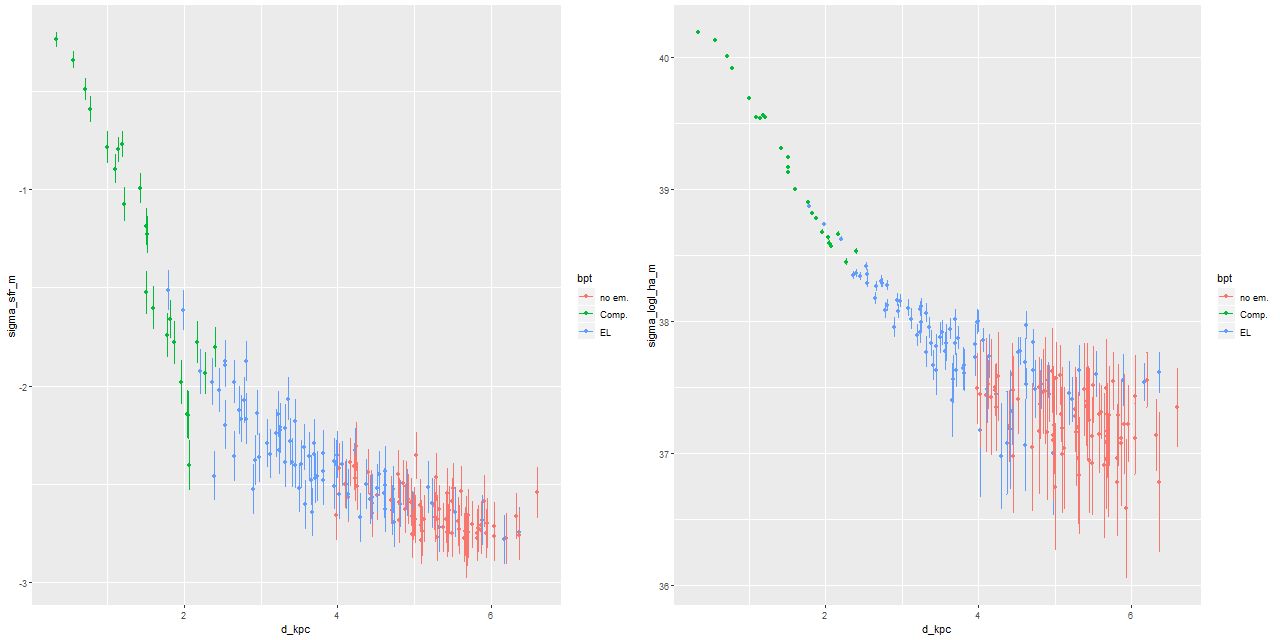
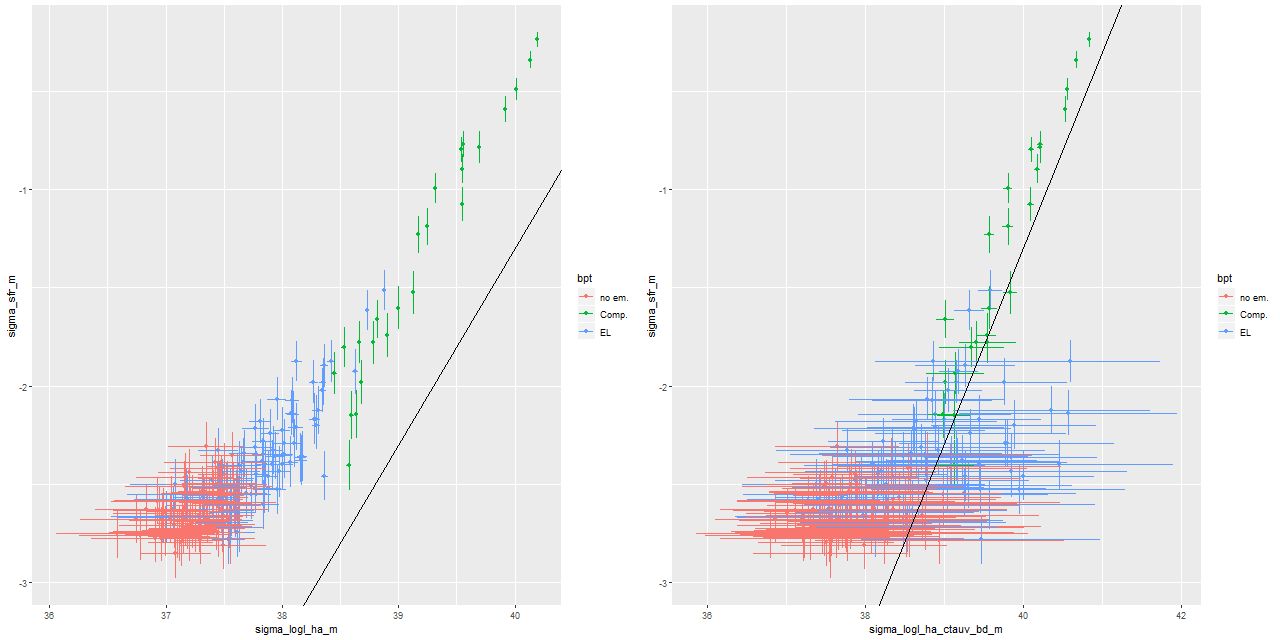
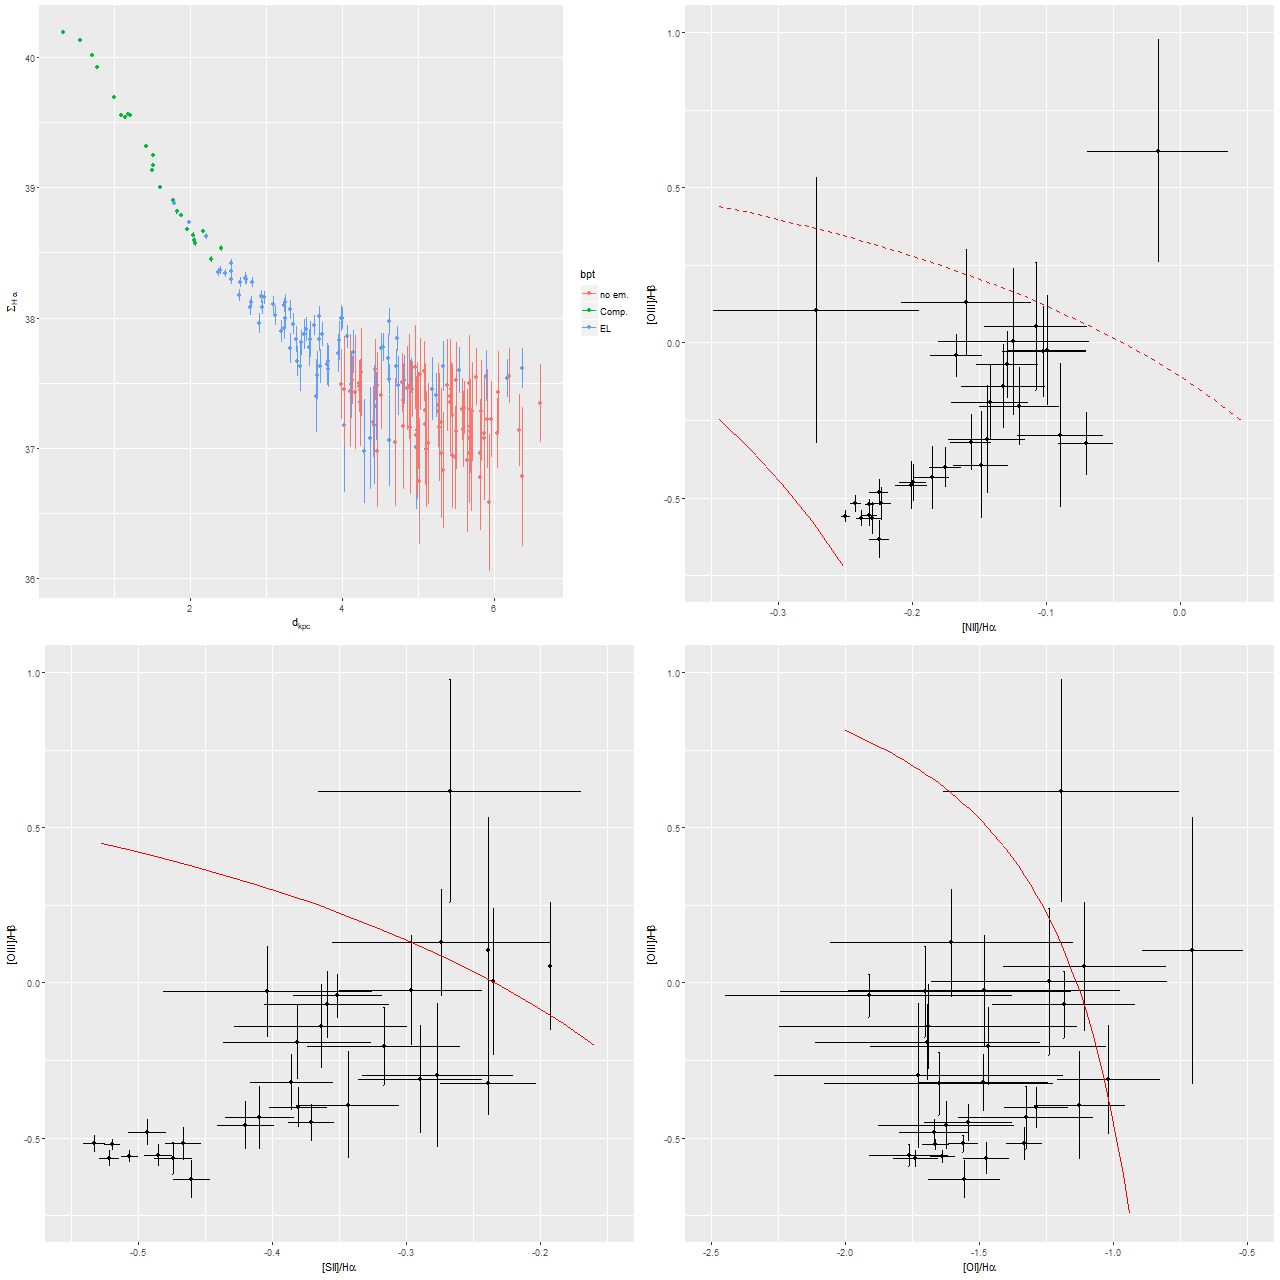
The plot below shows a few properties of the emission lines. Hα luminosity declines monotonically with radius, with a fairly sharp transition at ≈2.5 kpc where Hβ is no longer securely detected. The peak luminosity would indicate a central star formation rate density of  \(\approx 0.1 \mbox{M}_{sun} \)/yr/kpc\(^2\) if the ionizing source is entirely young stars. This is almost certainly as much as 3 orders of magnitude lower than the star formation rate at the peak of the starburst.

Somewhat surprisingly, I don’t find this galaxy in any compilations of “transitional galaxies,” including for example the “SPOGS” sample of Alatalo et al. (2106). This is probably because the emission line ratios don’t quite meet their criteria for shocks as the dominant ionizing mechanism. The remaining 3 panes below show the 3 most popular BPT diagnositic diagrams for fibers within 2.5 kpc of the center (beyond that emission line ratios are too uncertain to display). Most of the points in the [N II]/Hα diagram (TR) fall in the so called “composite” region (Kauffmann et al. 2003), which was originally interpreted as indicating a mix of AGN and star formation as the source of ionization. While there might be a weak AGN present (there is a compact radio source visible in FIRST, which could indicate either an AGN or centrally concentrated star formation) it’s unlikely to be a significant ionizing source here. The other diagnostics mostly lie on the starforming side of the boundaries proposed by Kewley et al. (2006), while the handful of points on the Seyfert/LINER side of the boundaries are far from the nucleus. In fact all three sets of line ratios show a trend with radius that’s opposite of what would be expected if an AGN were a significant ionizing source.

bpt_8440-6104
Hα luminosity with radius and bpt diagnostic diagrams (inner 2.5 kpc only)

To conclude for now, this is a clear case of a galaxy rapidly transitioning in the aftermath of a major merger. Next up, I’ll look at the results of star formation history models, and speculate about how believable they are. Later perhaps I’ll look at other examples, and maybe discuss why the false positives happened.

An application – the Baryonic Tully Fisher relation

Automating the processing of rotation curve models for the sample I described in the previous post was a relatively straightforward exercise. I just wrote a short script to load the galaxy data, estimate the velocity field, and run the Stan model for the entire sample. I use the MaNGA catalog values of nsa_elpetro_ph and nsa_elpetro_ba as proxies for the major axis position angle and cosine of inclination. Recall from a few posts back that these are used both to set priors for the corresponding model parameters and to initialize the sampler. There’s a small problem in that the photometric major axis is defined modulo \(\pi\) while the kinematic position angle is measured modulo \(2 \pi\). A 180o error here just causes the signs of the polynomial coefficients for rotation velocity to flip, which is easily corrected in post-processing.

I also use the catalog value nsa_elpetro_th50_r as the estimate of the effective radius, rescaling the input coordinates by dividing by 1.5reff. To save future processing (and also as insurance against power outages, etc.) all of the relevant input data and model fits are saved to an R binary data file for each galaxy. This all took some days for this sample, with the most time consuming operation being the calculation of the velocity fields.

Not all of the model runs were successful. Foreground stars and galaxy overlaps can cause catastrophic errors in the velocity offset measurements, and just one such error can seriously skew the rotation curve model. For these cases I manually masked the offending spectra and reran the models. There were three other sources of model failure: a single case of a bulge dominated galaxy, galaxies that were too nearly face on to reliably measure rotation, and galaxies with large kinematic misalignments (that is where the direction of maximum recession velocity is significantly offset from the photometric major axis). I will discuss these cases and what I did about them in more detail in a later post. For now it suffices to say I ended up with 331 galaxies with satisfactory rotation curve estimates.

With rotation curves in hand I decided as a simple project to try to replicate the Baryonic Tully Fisher relation. In its original form (Tully and Fisher 1977) the TFR is a relationship between circular velocity measured at some fiducial radius and luminosity, and as such it constitutes a tertiary distance indicator. Since stellar mass follows light (more or less) it makes sense that a similar relationship should hold between circular velocity and mass, and in due course this was found to be the case by McGaugh et al. (2000) who found \(M_b \sim V_c^4\) over a 5 decade range in baryonic (that is stellar plus gas) mass.

I retrieved stellar masses from the MPA-JHU (and also Wisconsin) pipeline using the following query:


select into gz2diskmass
  gz.mangaid,
  gz.plateifu,
  gz.specObjID,
  ge.lgm_tot_p16,
  ge.lgm_tot_p50,
  ge.lgm_tot_p84,
  w.mstellar_median,
  w.mstellar_err
from mydb.gz2disks gz
left outer join galSpecExtra ge on ge.specObjID = gz.specObjID
left outer join stellarMassPCAWiscBC03 w on w.specObjID = gz.specObjID

The MPA stellar mass estimates were from a Bayesian analysis, and several quantiles of the posterior are tabulated. I use the median as the best estimate of the central value and the 16th and 84th percentiles as \(\pm 1\sigma\).

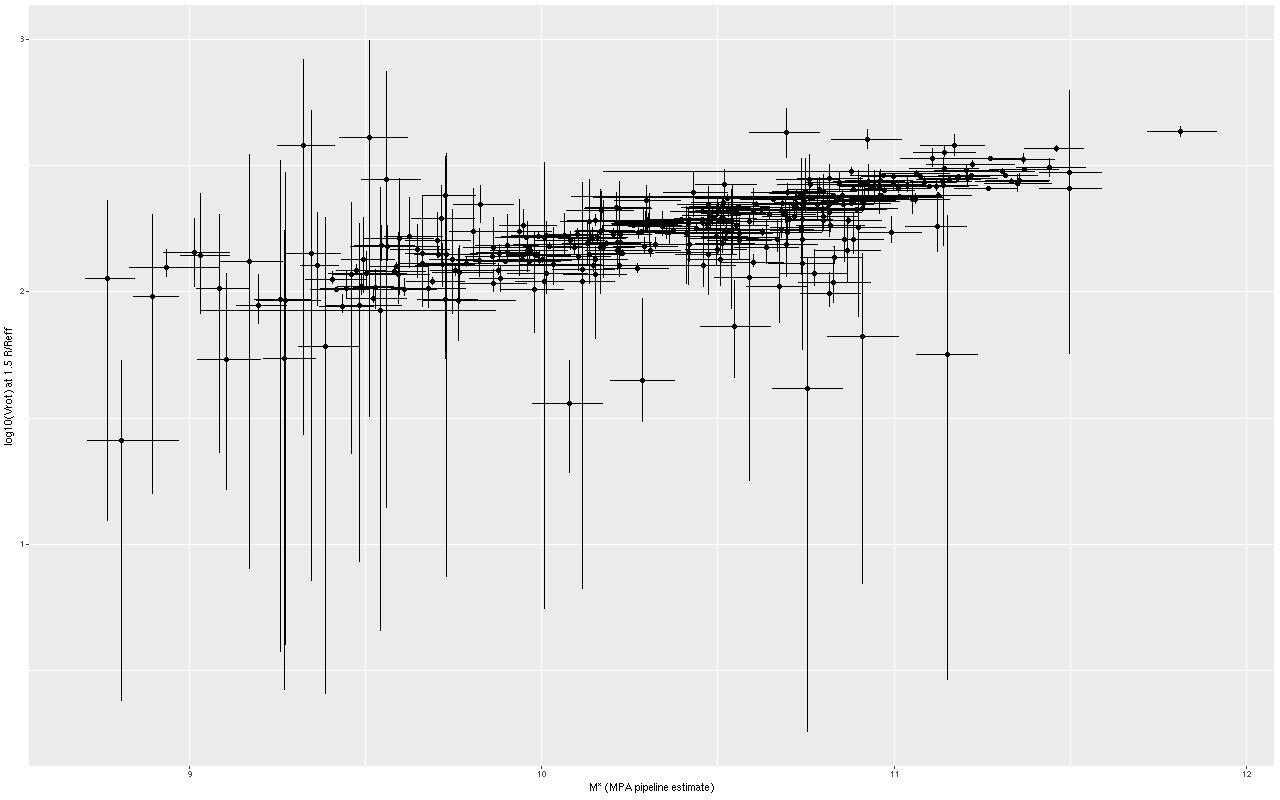
We need a single estimate of circular velocity. Since I scaled the coordinates by 1/(1.5Reff) the sum of the polynomial coefficients conveniently estimates the circular velocity at 1.5Reff, so that’s what I used. And here’s what I got (this is a log-log plot):

tf_mv
Stellar mass vs. rotation velocity at 1.5Reff for 331 disk galaxies

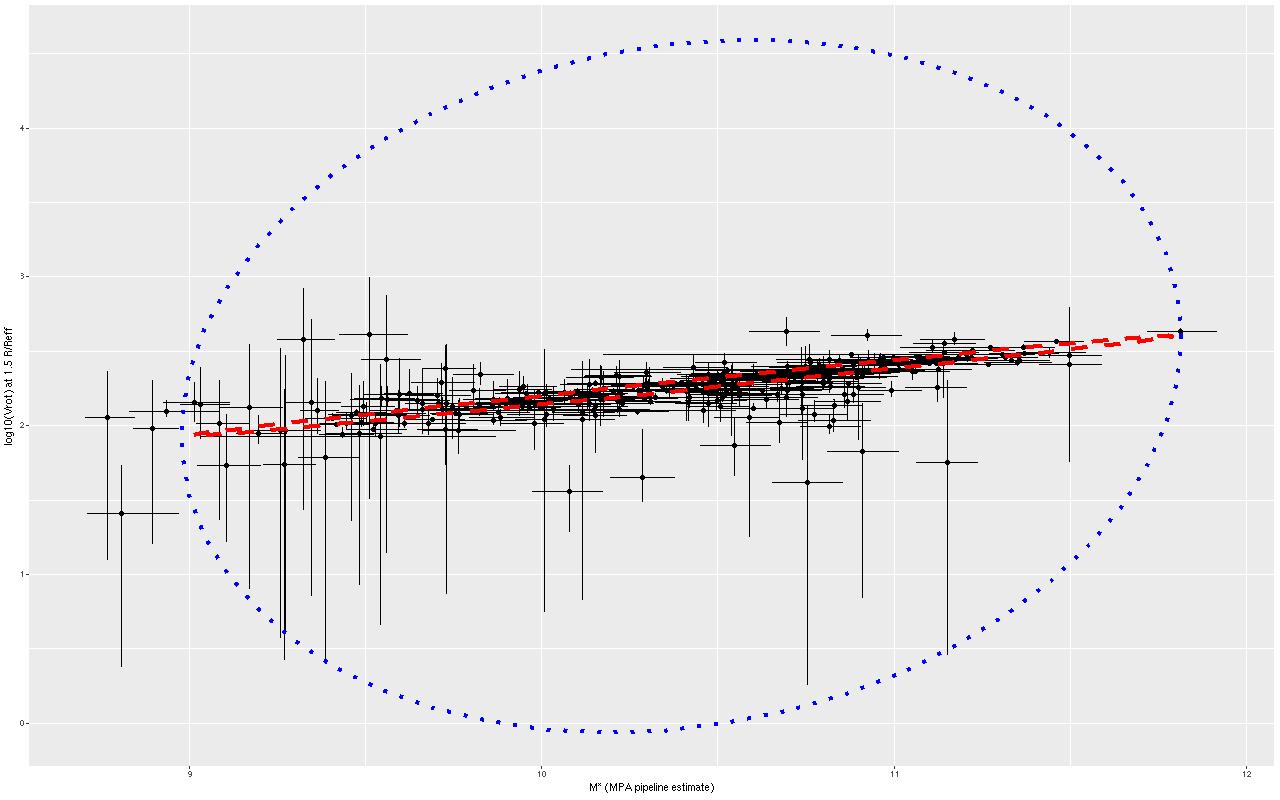
So, most points do follow a fairly tight linear relationship, but some measurements have very large error bars, and there are perhaps some outliers. The obvious choice to quantify the relationship, namely a simple linear regression with measurement error in both variables is also the wrong choice, I think. The reason is it’s not clear what the predictor should be, which suggests that we should be modeling the joint distribution rather than a conditional distribution of one variable given the other. To do that I turn to what astronomers call “extreme deconvolution” (Bovy, Hogg, and Roweis 2009, 2010). This is another latent variable model where the observed values are assumed drawn from some distribution with unknown (latent) mean and known variances, and the latent variables are in turn modeled as being drawn from a joint distribution with mean and variance parameters to be estimated. Bovy et al. allowed the joint distribution to be a multiple component mixture. I wrote my own version in Stan, and for simplicity just allow a single component for now. The full code is listed at the end of this post. Another simplification I make is modeling the measurement errors as Gaussian, which is clearly not the case for at least some measurements since some error bars are asymmetric — the plotted error bars mark the 16th and 84th percentiles of log stellar mass (\(\approx \pm 1 \sigma\)) and 2.5th and 97.5th percentiles of log circular velocity (\(\approx \pm 1.96 \sigma\)). If I had more accurate distribution functions it would be straightforward to adjust the model. This should be feasible for the velocities at least since the rotation model outputs can be recovered and the empirical posteriors examined. The stellar mass estimates would be more difficult with only a few quantiles tabulated. But, forging ahead, here is the important result:

tf_mv_confellipse
Stellar masses vs. rotation velocity with 95% confidence ellipses for “extreme deconvolution” estimate of relationship and pp distribution

The skinny ellipse is a 95% confidence bound for the XD estimate of the intrinsic relationship. The fat ellipse is a 95% confidence ellipse for the posterior predictive distribution, which is obtained by generating new simulated observations from the full model. So there are two interesting results here. First, the inferred intrinsic relationship shows remarkably little “cosmic scatter,” consistent with a nearly perfect correlation between the unobserved true stellar mass and circular velocity. Second, it’s not at all clear that the apparent outliers are actually discrepant given the measurement error model.

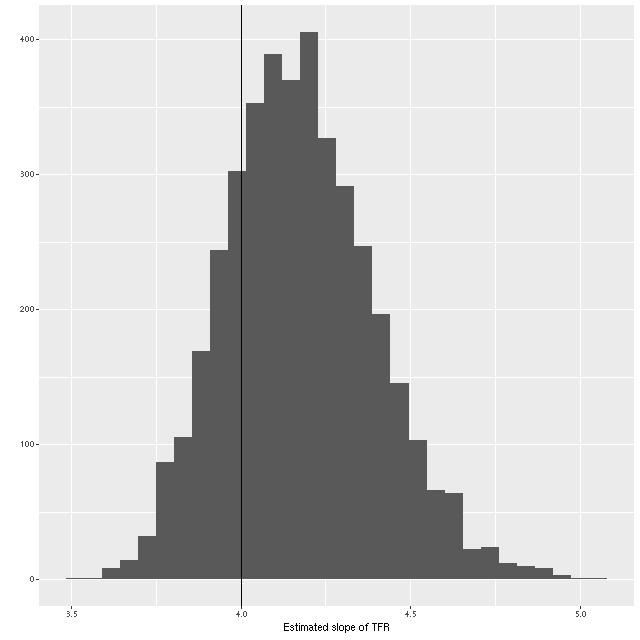
What about the slope of the relation? We can estimate that from the elements of eigenvectors of the eigendecomposition of the variance matrix, which I calculate in the generated quantities block of the Stan model. A histogram of the result is shown below. Although a slightly higher slope is favored, the McGaugh et al. value of 4 is well within the 95% confidence band.

tfr_slope
Estimate of the slope of the TFR

As a check on my model I compared my results to the implementation of the Bovy et al. algorithm in the Python module astroML that accompanies the book “Statistics, Data Mining, and Machine Learning in Astronomy” by Ivezic et al. (2014).

Here is my estimate of the mean of the posterior means of the intrinsic distribution (which isn’t especially interesting) and the posterior variance matrix:

> colMeans(post$mu_unorm)
[1] 10.396068  2.267223
> apply(post$Sigma_unorm, c(2,3), mean)
      
             [,1]       [,2]
  [1,] 0.32363805 0.07767842
  [2,] 0.07767842 0.01876449
 

and the same returned by XDGMM

array([[10.39541753,  2.2668531 ]])
array([[[0.32092995, 0.07733682],
        [0.07733682, 0.01866578] ]])

I also tried multicomponent mixtures in XDGMM and found no evidence that more than one is needed. In particular it doesn’t favor a different relation at the low mass end or any higher variance components to cover the apparent outliers.

I plan to return to this topic later, perhaps after the next data release and perhaps using the GP model for rotation curves (or something else if I find a different modeling approach that works).
Continue reading “An application – the Baryonic Tully Fisher relation”

Sample selection – finding disk galaxies

This post is partially based on a series I wrote on the previous version of Galaxy Zoo Talk. I hope it will be shorter.

The analysis in the previous posts is applicable to galaxies whose stars and/or ionized gas are confined to a thin disk with no net vertical bulk motion. In that case velocities can be treated as two dimensional and, for moderately inclined disks, the full velocity vectors recovered from the observed radial velocities. The thin disk approximation is an idealization of course, but it’s reasonable at least for late type spiral galaxies that lack significant bulges.

I ultimately tried three different ideas to acquire a statistically meaningful sample of disk galaxies without actually visually examining all ∼2700 of them (this is certainly feasible, but somewhat error prone and tedious). The first idea was to use the drpall catalog to select a sample of probable disk galaxies. The catalog contains a single morphology proxy in nsa_sersic_n derived from single component sersic index fits to r-band SDSS imaging. A forgotten paper suggests disk galaxies have n ≤ 2.5, so I adopted that as an upper limit. There are several estimates of the minor to major axis size ratio, which for a disk galaxy is a proxy for the cosine of the inclination. The one recommended by the MaNGA science team is nsa_elpetro_ba. I chose a conservative range of inclinations of between 30 and 60o, or \(0.5 \le \cos i \le 0.866\).

The full MaNGA sample contains several subsamples: the main ones are a primary sample intended to be observed out to ≈1.5 effective radii and a secondary sample observed to ≈2.5Reff. I initially thought the latter would be most suitable for analysis. The subsample an observation belongs to is identified by three sets of bitmasks, with mngtarg1 used for galaxies in the primary and secondary samples. So, the R code to select this sample is:


attach(drpcat)
maybedisks2 <- which((mngtarg1==4 | mngtarg1==32 | (mngtarg1 >= 2048 & mngtarg1 < 4096)) & nsa_sersic_n < 2.5 & nsa_elpetro_ba>=0.5 & nsa_elpetro_ba<=0.866)
detach(drpcat)

This returns a vector of 254 row indexes in drpcat (in the DR14 release). The following short R function takes the indexes and writes out a text file of MaNGA file names suitable for use with wget


writefn <- function(indexes, ftype="rss", cat=drpcat, outfile="fgets.txt") {
  ftype <- toupper(ftype)
  plates <- cat$plate[indexes]
  plateifus <- cat$plateifu[indexes]
  fnames <- paste(plates, "/stack/manga-", plateifus,
                  "-LOG", ftype, ".fits.gz", sep="")
  cat(fnames, file=outfile, sep="\n")
  fnames
}

I soon found out that this sample has problems. The main issue is that although the IFU covers almost the full visible extent of these galaxies the exposures are no deeper than for the primary sample. Even with optimistic S/N thresholds there is little usable data at large radii.

My next idea was to try the very pure sample of spirals of Masters et al. (2010) selected from the original Galaxy Zoo project. A position cross-reference turned up 69 observations of 68 unique galaxies in the first two MaNGA releases. This is a bit small for the purpose I had in mind, and the sample size was further reduced by another 10-12 galaxies that were too nearly face-on to analyze.

In search of a larger sample I again turned to Galaxy Zoo data, this time the main spectroscopic sample of GZ2 (Willett et al. 2013) which is conveniently included in the SDSS databases. A complication here is that although the vast majority of MaNGA galaxies have single fiber spectra from SDSS their id's aren't tabulated in drpall. Although I could probably have done a simple position based cross match of GZ2 galaxies with MaNGA targets I decided instead to look for SDSS specObjID's near to MaNGA target positions, and then join to matching GZ2 targets. This required a command I hadn't used before and a table valued function that was also new to me:


select into gz2disks
  m.mangaid,
  m.plateifu,
  m.objra,
  m.objdec,
  m.ifura,
  m.ifudec,
  m.mngtarg1,
  m.mngtarg3,
  m.nsa_z,
  m.nsa_zdist,
  m.nsa_elpetro_phi,
  m.nsa_elpetro_ba,
  m.nsa_elpetro_th50_r,
  m.nsa_sersic_n,
  z.specObjID
from mangaDrpAll m
cross apply dbo.fGetNearbySpecObjEq(m.objra, m.objdec, 0.05) as n
join zoo2MainSpecz z on z.specobjid=n.specObjID
where
  m.mngtarg2=0 and
  z.t01_smooth_or_features_a02_features_or_disk_weighted_fraction > 0.5 and
  z.t02_edgeon_a05_no_weighted_fraction > 0.5 and
  z.t06_odd_a15_no_weighted_fraction > 0.5 and
  m.nsa_elpetro_ba >= 0.5 and
  m.nsa_elpetro_ba <= 0.866 and
  m.mngtarg1 > 0

The line that starts with cross apply builds a table of position matches of MaNGA objects to spectroscopic primaries, then in the next line joins data from the GZ2 spectroscopic sample. The last lines set some thresholds for weighted vote fractions for a few attributes: yes votes for "features or disk", no votes for "edge on", and no votes for "something odd". I chose, more or less arbitrarily, to set all thresholds to 0.5. The final lines set inclination proxy limits as discussed above. There were also questions about bulge size, spiral structure, and bars in the GZ2 decision tree that I did not consider but certainly might if I return to this subject.

This query run in the DR14 "context" produced 359 hits out of about 2700 galaxy targets in the first two MaNGA public releases, which is certainly an incomplete census of disk galaxies. On the other hand all 359 appeared to me actually to be disk galaxies, so the purity of the sample was quite high. Next time I'll do something with the sample.

Kinematics 3a – Disk galaxy rotation curves: footnotes

A few added notes:

  • One reason to use Gaussian process regression is that it models spatial covariance. Unfortunately the single covariance function currently offered in Stan is isotropic, so it’s not quite what we’d like for these models where correlations sometimes are spatially oriented.
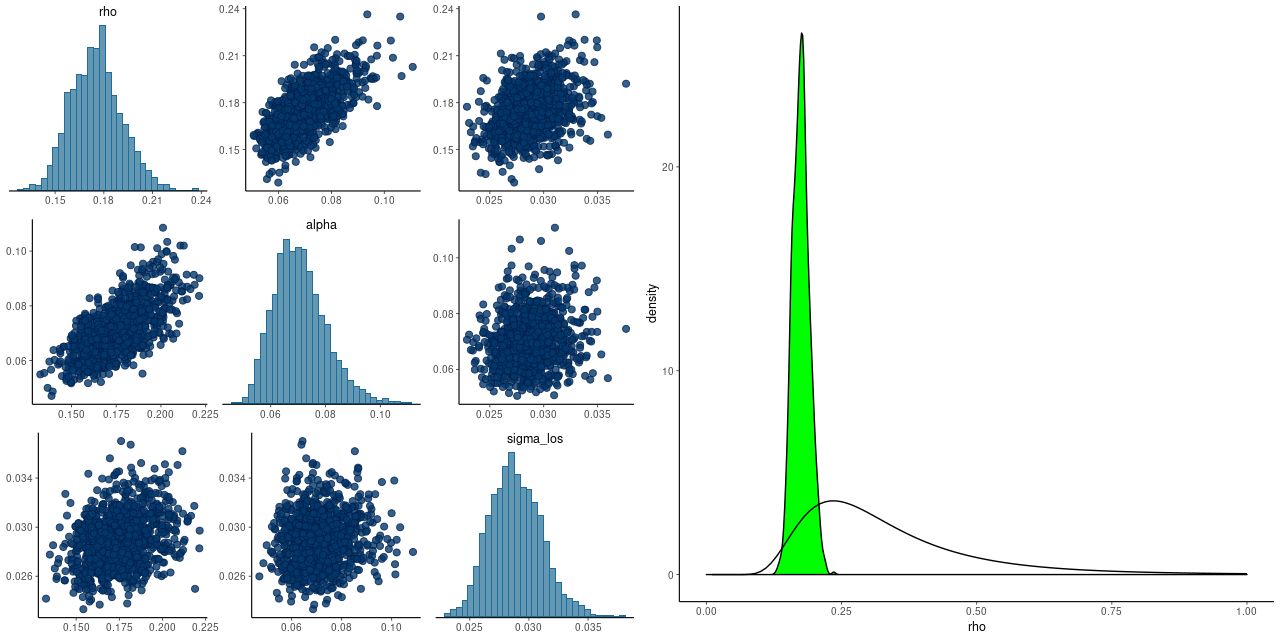
  • The “exponentiated quadratic” covariance offered by Stan has two parameters, one of which is a magnitude and one a scale length. When these are modeled as part of the inference problem they are only weakly identified, which often leads to convergence issues. Betancourt discusses this at some length in his case study and suggests a way to form a principled informative prior for the scale length ρ when meaningful bounds can be placed on its value. That’s definitely the case here: the minimum possible scale length for spatial correlations is the fiber diameter of 2″. The maximum is the scale of the data itself. Since I scale the input positions to have a maximum radius around 1 the maximum rescaled scale length is 1. I adopted his code for estimating the parameters of the inverse gamma prior without modification. As the graph below shows, this works rather well. The posteriors of the scale length rho and magnitude alpha are correlated, but there’s no indication of pathology. There is also an iid component of noise in the variance model and it is uncorrelated with the other two parameters. The right pane shows the kernel smoothed posterior density of rho and the prior density. Evidently the data are informative in this case, since the posterior is considerably tighter than the prior. The unscaled median value of rho is 2.8″, perhaps coincidentally a little larger than the typical MaNGA PSF diameter. If this value continues to hold for more data sets it might be possible to fix rho, which could speed sampling a bit.
covparamscatter
  • I am not the first to use GP models for IFU data — González-Gaitán et al. (2018) applied essentially similar models to a variety of data estimated from CALIFA data cubes. Unfortunately full Bayesian inference on data cubes is quite out of reach with any computing resources I have access to. The model in the last post took 6900 seconds wall time for 1000 iterations for each of 4 chains run in parallel, with just 380 data points. This was on a desktop PC with 4th generation Intel I7. A current generation Intel I9 based PC runs the same model in about half the time.


Kinematics 3 – Disk galaxy rotation curves (Gaussian process version)

The simple polynomial model for rotation velocities that I wrote about in the last two posts seems to work well, but there are some indications of model misspecification. The relatively large expansion velocities imply large scale noncircular motions which are unexpected in an undisturbed disk galaxy (although the bar may play a role in this one), but also may indicate a problem with the model. There is also some spatial structure in the residuals, falsifying the initial assumption that residuals are iid. Since smoothing splines proved to be intractable I turned to Gaussian Process (GP) regression for a more flexible model representation. These are commonly used for interpolation and Stan offers support for them, although it’s somewhat limited in the current version (2.17.x).

I know little about the theory or practical implementation of GP’s, so I will not review the Stan code in detail. The current version of the model code is at <https://github.com/mlpeck/vrot_stanmodels/blob/master/vrot_gp.stan>. Much of the code was borrowed from tutorial introductions by Rob Trangucci and Michael Betancourt. In particular the function gp_pred_rng() was taken directly from the former with minimal modification.

There were several complications I had to deal with. First, given a vector of variates y and predictors x the gaussian process model looks something like

$$\mathbf{y} \sim \mathcal{GP}(\mathsf{m}(\mathbf{x}), \mathsf{\Sigma}(\mathbf{x}))$$

that is the GP is defined in terms of a mean function and a covariance function. Almost every pedagogical introduction to GP’s that I’ve encountered immediately sets the mean function to 0. Now, my prior for the rotation velocity definitely excludes 0 (except at r=0), so I had to retain a mean function. In order to get calculating I again just use a low order polynomial for the rotation velocity. The code for this in the model block is

  v ~ normal(v_los, dv);

  cov = cov_exp_quad(xyhat, alpha, rho);
  for (n in 1:N) {
    cov[n, n] = cov[n, n] + square(sigma_los);
  }
  L_cov = cholesky_decompose(cov);
  v_los ~ multi_normal_cholesky(v_sys + sin_i * (P * c_r) .* yhat, L_cov);

The last line looks like the previous model except that I’ve dropped the expansion velocity term because I do expect it to be small and distributed around 0. Also I replaced the calculation of the polynomial with a matrix multiplication of a basis matrix of polynomial values with the vector of coefficients. For some unknown reason this is slightly more efficient in this model but slightly less efficient in the earlier one.

A second small complication is that just about every pedagogical introduction I’ve seen presents examples in 1D, but the covariates in this problem are 2D. That turned out to be a small issue, but it did take some trial and error to find a usable data representation and there is considerable copying between data types. For example there is an N x 2 matrix Xhat which is defined as the result of a matrix multiplication. Another variable declared as row_vector[2] xyhat[N]; is required for the covariance matrix calculation and contains exactly the same values. All of this is done in the transformed parameters block.

The main objective of a gaussian process regression is to predict values of the variate at new values of the covariates. That is the purpose of the generated quantities block, with most of the work performed by the user defined function gp_pred_rng() that I borrowed. This function can be seen to implement equations 2.23-2.24 in the book “Gaussian Processes for Machine Learning” by Rasmussen and Williams 2006 (the link goes to the book website, and the electronic edition of the book is a free download). Those equations were derived for the case of a 0 mean function, but that’s not what we have here. In an attempt to fit my model into the mathematical framework outlined there I subtract the systematic part of the rotation model from the latent line of sight velocities to feed a quantity with 0 prior mean to the second argument to the posterior predictive function:

  v_gp = gp_pred_rng(xy_pred, v_los-v_sys-sin_i* (P * c_r) .* yhat, xyhat, alpha, rho, sigma_los);

then they are added back to get the predicted, deprojected, velocity field:

  v_pred = (v_gp + sin_i * (poly(r_pred, order) * c_r) .* y_pred) *v_norm/sin_i;

Yet another complication is that the positions in the plane of the disk are effectively parameters too. I don’t know if the posterior predictive part of the model is correctly specified given these complications, but I went ahead with it anyway.

The positions I want predictions for are for equally spaced angles in a set of concentric rings. The R code to set this up is (this could have been done in the transformed data block in Stan):

  n_r <- round(sqrt(N_xy))
  N_xy <- n_r^2
  rho <- seq(1/n_r, 1, length=n_r)
  theta <- seq(0, (n_r-1)*2*pi/n_r, length=n_r)
  rt <- expand.grid(theta, rho)
  x_pred <- rt[,2]*cos(rt[,1])
  y_pred <- rt[,2]*sin(rt[,1])

The reason for this is simple. If the net, deprojected velocity field is given by

$$\frac{v – v_{sys}}{\sin i} = v_{rot}(r) \cos \theta + v_{exp}(r) \sin \theta$$

then, making use of the orthogonality of trigonometric functions

$$v_{rot}(r) = \frac{1}{\pi} \int^{2\pi}_0 (v_{rot} \cos \theta + v_{exp} \sin \theta) \cos \theta \mathrm{d}\theta$$

and

$$v_{exp}(r) = \frac{1}{\pi} \int^{2\pi}_0 (v_{rot} \cos \theta + v_{exp} \sin \theta) \sin \theta \mathrm{d}\theta$$

The next few lines of code just perform a trapezoidal rule approximation to these integrals:


  vrot_pred[1] = 0.;
  vexp_pred[1] = 0.;
  for (n in 1:N_r) {
    vrot_pred[n+1] = dot_product(v_pred[((n-1)*N_r+1):(n*N_r)], cos(theta_pred[((n-1)*N_r+1):(n*N_r)]));
    vexp_pred[n+1] = dot_product(v_pred[((n-1)*N_r+1):(n*N_r)], sin(theta_pred[((n-1)*N_r+1):(n*N_r)]));
  }
  vrot_pred = vrot_pred * 2./N_r;
  vexp_pred = vexp_pred * 2./N_r;

These are then used to reconstruct the model velocity field and the difference between the posterior predictive field and the systematic portion of the model:


  for (n in 1:N_r) {
    v_model[((n-1)*N_r+1):(n*N_r)] = vrot_pred[n+1] * cos(theta_pred[((n-1)*N_r+1):(n*N_r)]) +
                                     vexp_pred[n+1] * sin(theta_pred[((n-1)*N_r+1):(n*N_r)]);
  }
  v_res = v_pred - v_model;

Besides some uncertainty about whether the posterior predictive inference is specified properly there is one very important problem with this model: the gradient computation, which tends to be the most computationally intensive part of HMC, is about 2 orders of magnitude slower than for the simple polynomial model discussed in the previous posts. The wall time isn’t proportionately this much larger because fewer “leapfrog” steps are typically needed per iteration and the target acceptance rate can be set to a lower value. This still makes analysis of data cubes quite out of reach, and as yet I have only analyzed a small number of galaxies’ RSS based data sets.

Here are some results for the sample data set from plateifu 8942-12702. This galaxy is too big for its IFU — the cataloged effective radius is 16.2″, which is about the radius of the IFU footprint. Therefore I set the maximum radius for predicted values to 1reff.

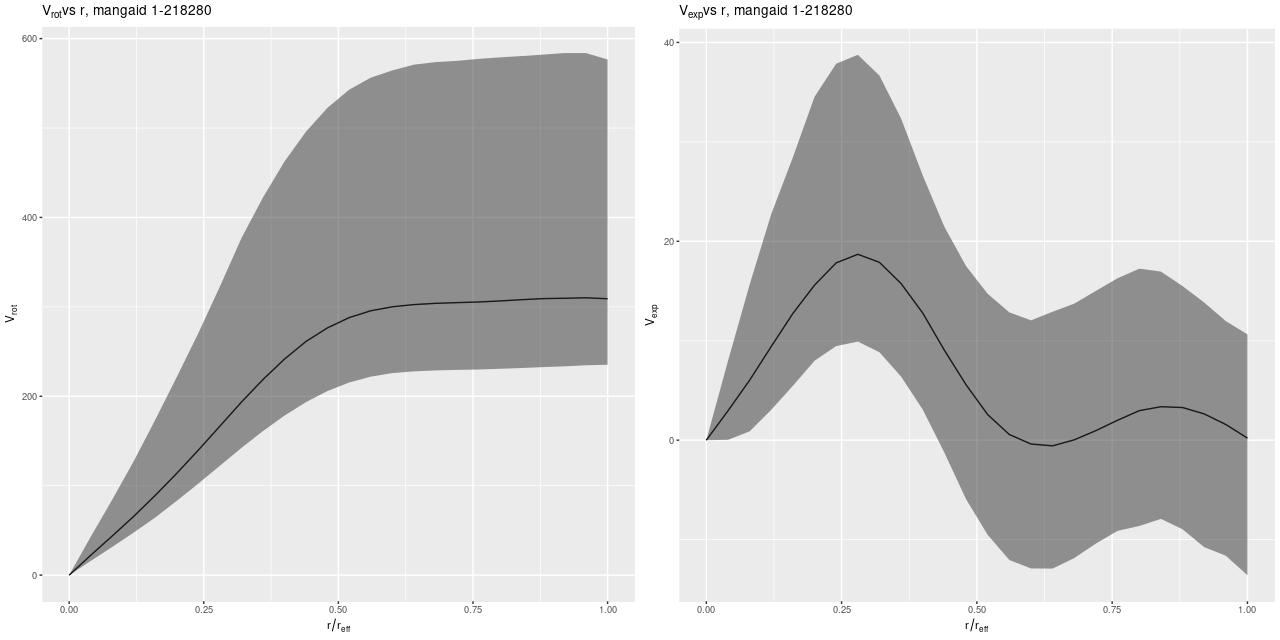
The most important model outputs are the posterior predictive distributions for the rotational and expansion velocities:

vrot_vexp_gp
V_rot, V_exp, Gaussian process model

The rotational velocity is broadly similar to the polynomial model, but it has a very long plateau (the earlier model was beginning to turn over by 1 reff) and much larger uncertainty intervals. The expansion velocity curve displays completely different behavior from the polynomial model (note that the vertical scales of these two graphs are different). The mean predicted value is under 20 km/sec everywhere, and 0 is excluded only out to a radius around 6.5″, which is roughly the half length of the bar.

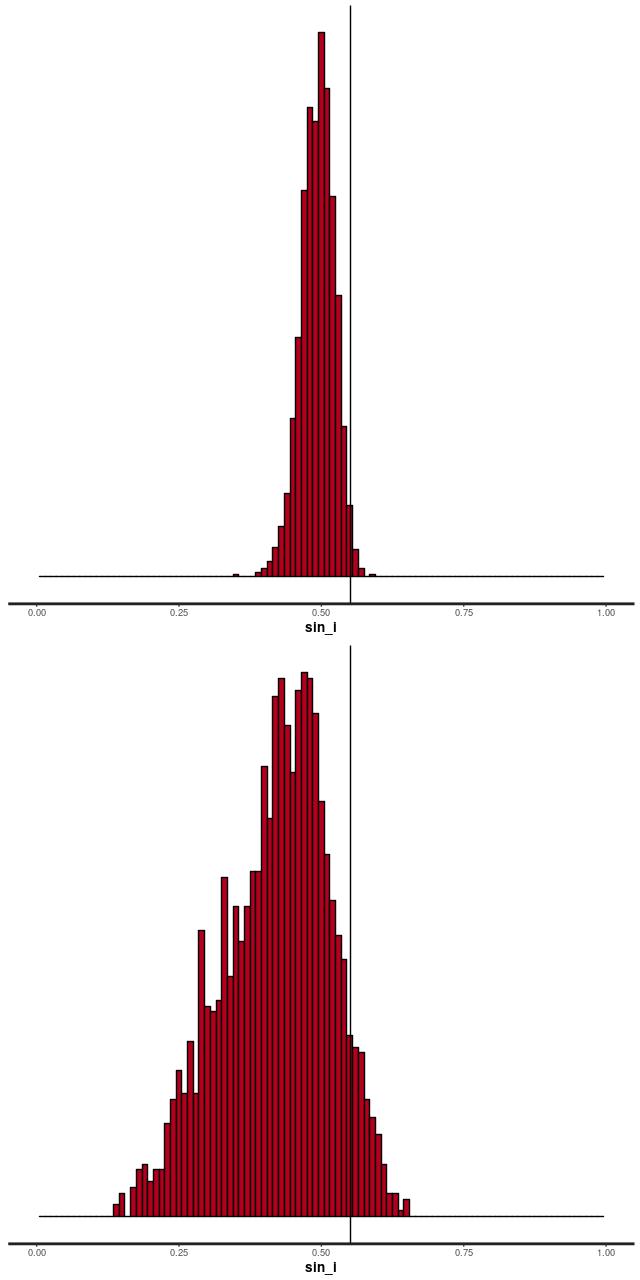
The reason for the broad credible intervals for the rotation velocity in the GP model compared to the polynomial model can be seen by comparing the posteriors of the sine of the inclination angle. The GP model’s is much broader and has a long tail towards very low inclinations. This results in a long tail of very high deprojected rotational velocities. Both models favor lower inclinations than the photometric estimate shown as a vertical line.

sin_i_comp
Posteriors of sin_i for polynomial and GP models

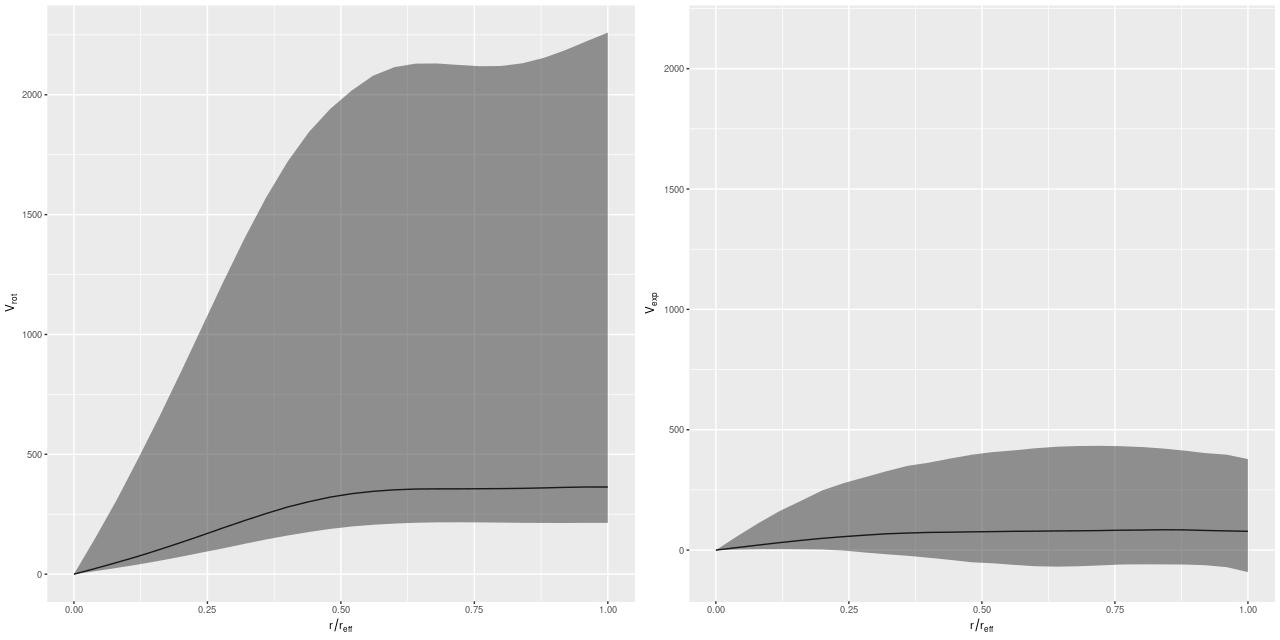
I’m going to leave off with one more graph. I was curious if it was really necessary to have a model for the rotation velocity, so I implemented the common pedagogical case of assuming the prior mean function is 0 (actually a constant to allow for an overall system velocity). Here are the resulting posterior predictive estimates of the rotation and expansion velocities:

vrot_vexp_mean0
V_rot, V_exp for GP model with constant prior mean

Conclusion: it is. There are several other indications of massive model failure, but these are sufficient I think.

In a future post (maybe not the next one) I’ll discuss an application that could actually produce publishable research.

Kinematics 2a – Disk galaxy rotation curves

I’m going to take a selective look at some of the Stan code for this model, then show some results for the RSS derived data set. The complete stan file is at <https://github.com/mlpeck/vrot_stanmodels/blob/master/vrot.stan>. By the way development is far from frozen on this little side project, so this code may change in the future or I may add new models. I’ll try to keep things properly version controlled and my github repository in sync with my local copy.

Stan programs are organized into named blocks that declare and sometimes operate on different types of variables. There are seven distinct blocks that may be present — I use 6 of them in this program. The functions block in this program just defines a function that returns the values of the polynomial representing the rotational and expansion velocities. The data block is also straightforward:

data {
int<lower=1> order; //order for polynomial representation of velocities
int<lower=1> N;
vector[N] x;
vector[N] y;
vector[N] v; //measured los velocity
vector[N] dv; //error estimate on v
real phi0;
real<lower=0.> sd_phi0;
real si0;
real<lower=0.> sd_si0;
real<lower=0.> sd_kc0;
real<lower=0.> r_norm;
real<lower=0.> v_norm;
int<lower=1> N_r; //number of points to fill in
vector[N_r] r_post;
}

The basic data inputs are the cartesian coordinates of the fiber positions as offsets from the IFU center, the measured radial velocities, and the estimated uncertainties of the velocities. I also pass the polynomial order for the velocity representations and sample size as data, along with several quantities that are used for setting priors.

The parameters block is where the model parameters are declared, that is the variables we want to make probabilistic statements about. This should be mostly self documenting given the discussion in the previous post, but I sprinkle in some C++ style comments. I will get to the length N vector parameter v_los shortly.

parameters {
  real phi;
  real<lower=0., upper=1.> sin_i;  // sine disk inclination
  real x_c;  //kinematic centers
  real y_c;
  real v_sys;     //system velocity offset (should be small)
  vector[N] v_los;  //latent "real" los velocity
  vector[order] c_rot;
  vector[order] c_exp;
  real<lower=0.> sigma_los;
}

In this program the transformed parameters block mostly performs the matrix manipulations I wrote about in the last post. These can involve both parameters and data. A few of the declarations here improve efficiency in minor but useful ways recommended in the Stan help forums by members of the development team. For example the statement real sin_phi = sin(phi); saves recalculating the sine further down.

transformed parameters {
  vector[N] xc = x - x_c;
  vector[N] yc = y - y_c;
  real sin_phi = sin(phi);
  real cos_phi = cos(phi);
  matrix[N, 2] X;
  matrix[N, 2] Xhat;
  matrix[2, 2] Rot;
  matrix[2, 2] Stretch;
  vector[N] r;
  vector[N] xhat;
  vector[N] yhat;

  X = append_col(xc, yc);
  Rot = [ [-cos_phi, -sin_phi],
          [-sin_phi, cos_phi]];
  Stretch = diag_matrix([1./sqrt(1.-sin_i^2), 1.]');
  Xhat = X * Rot * Stretch;
  xhat = Xhat[ : , 1];
  yhat = Xhat[ : , 2];
  r = sqrt(yhat .* yhat + xhat .* xhat);
}

The model block is where the log probability is defined, which is what the sampler is sampling from:

model {
  phi ~ normal(phi0, sd_phi0);
  sin_i ~ normal(si0, sd_si0);
  x_c ~ normal(0, sd_kc0/r_norm);
  y_c ~ normal(0, sd_kc0/r_norm);
  v_sys ~ normal(0, 150./v_norm);
  sigma_los ~ normal(0, 50./v_norm);
  c_rot ~ normal(0, 1000./v_norm);                                                                        
  c_exp ~ normal(0, 1000./v_norm);

  v ~ normal(v_los, dv);
  v_los ~ normal(v_sys + sin_i * (
                  sump(c_rot, r, order) .* yhat + sump(c_exp, r, order) .* xhat),
                  sigma_los);
}

I try to be consistent about setting priors first in the model block and using proper priors that are more or less informative depending on what I actually know. In this case some of these are hard coded and some are passed to Stan as data and can be set by the user. I find it necessary to supply fairly informative priors for the orientation and inclination angles. For the latter it’s because of the weak identifiability of the inclination. For the former it’s to prevent mode hopping.

Stan’s developers recommend that parameters should be approximately unit scaled, and this usually entails rescaling the data. In this case we have both natural velocity and length scales. Typical peculiar velocities are on the order of no more than a few hundreds of km/sec., so I scale them to units of 100 km/sec. The MaNGA primary sample is intended to have each galaxy observed out to 1.5Reff, where Reff is the (r band) half light radius, so the maximum observed radius should typically be ∼1.5Reff. Therefore I typically divide all position measurements by that amount with the effective radius taken from nsa_elpetro_th50_r in drpcat. Other catalog values that I use as inputs to the model are nsa_elpetro_phi for the orientation angle and nsa_elpetro_ba for the cosine of the inclination. These are used as the central values of the priors and also to initialize the sampler.

Once I solved the problem of parametrizing angles the next source of pathologies I encountered was a tendency towards multimodal kinematic centers. This usually manifests as one or more chains being displaced from the others rather than mode hopping within a chain, although that can happen too. In the typical case the extra modes would place the center in an adjacent fiber to the one closest to the IFU center, but sometimes much larger jumps happen. Although I wouldn’t necessarily rule out the possibility of actual multimodality when it happens it has a severe effect on convergence diagnostics and on most other model parameters. I therefore found it necessary to place a tighter prior on the kinematic centers than I would have liked based solely on prior knowledge: the default prior puts about 95% of the prior mass within the radius of the central fiber. This could overconstrain the kinematic center in some cases, particularly low mass galaxies with weak central concentration.

A very common situation with astronomical data is to have quantities measured with error with an accompaying uncertainty estimate for each measurement. My code for estimating redshift offsets kicks out an uncertainty estimate, so this is no exception. I take a standard approach to modeling this: the unknown “true” line of sight velocity is treated as a latent variable, with the measured velocity generated from a distribution having mean equal to the latent variable and standard deviation the estimated uncertainty. In this case the distribution is assumed to be Gaussian. The latent variable is then treated as the response variable in the model. Since I had no particular expectations about what the residuals from the model should look like I fell back on the statistician’s standard assumption that they are independent and identically distributed gaussians with standard deviation to be estimated as part of the model.

Having a latent parameter for every measurement seems extravagant, but in fact it causes no issues at all except for a slight performance penalty. With the distributional assumptions I made the latent variables can be marginalized out and posteriors for the remaining parameters will be the same within typical Monte Carlo variability. The main performance difference seems to arise from slower adaptation in the latent variables version.

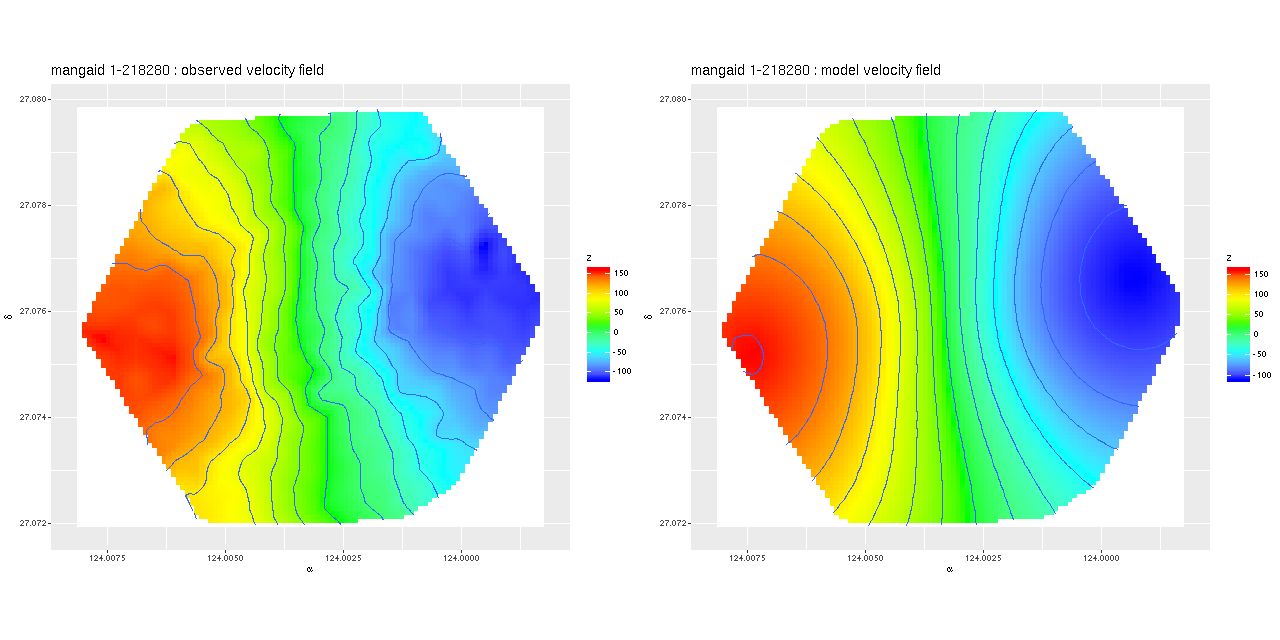
Finally, some results from the observation with plateifu 8942-12702 (mangaid 1-218280). First, the measured velocity field and the posterior mean model. The observations came from the same data shown in the previous post interpolated onto a finer grid.

vf_mvf_1-218280
Measured and model velocity field – mangaid 1-218280

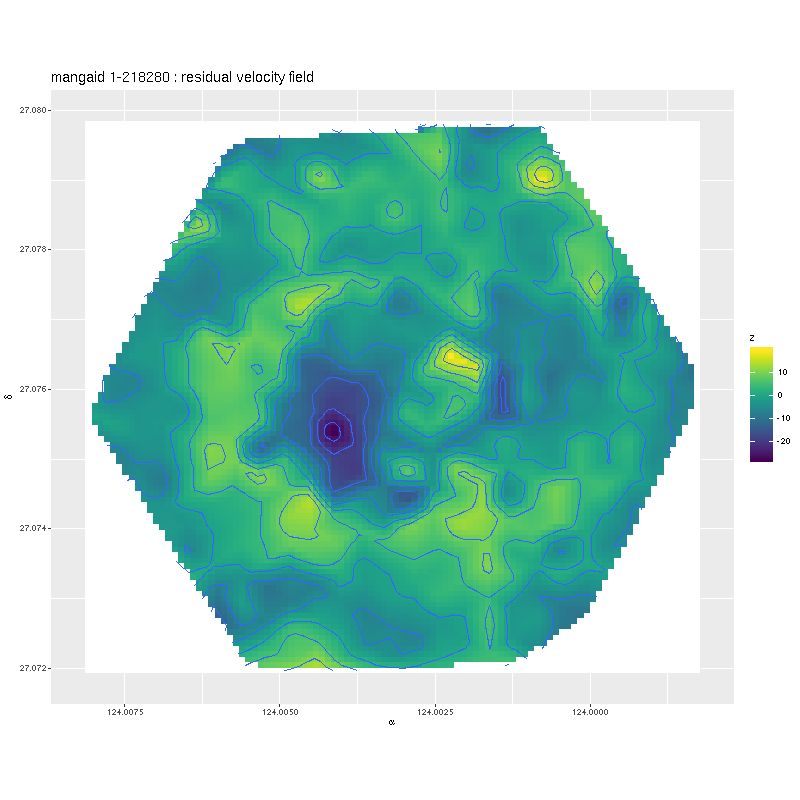
The model seems not too bad except for missing some high spatial frequency details. The residuals may be revealing (again this is the posterior mean difference between observations and model):

vfres_1-218280
residual velocity field

There is a strong hint of structure here, with a ridge of positive residuals that appears to follow the inner spiral arms at least part of the way around. There are also two regions of larger than normal residuals on opposite sides of the nucleus and with opposite signs. In this case they appear to be at or near the ends of the bar. This is a common feature of these maps — I will show another example or two later.

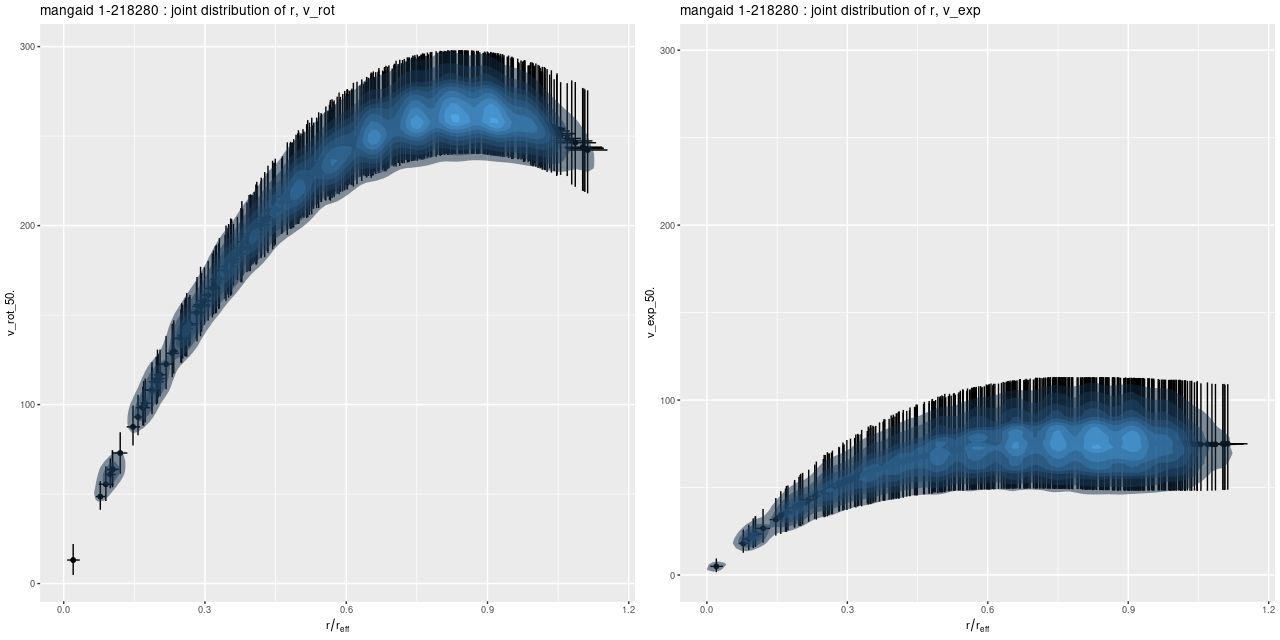
Next are the joint posterior distributions of \(v_{rot}\) with radius r and \(v_{exp}\) with r. Error bars are 95% credible intervals.

vrot_vexp_1-218280
Joint posteriors of v_rot, r and v_exp, r

The rotation curve seems not unrealistic given the limited expressiveness of the polynomial model. The initial rise is slow compared to typical examples in the literature, but this is probably attributable to the limited spatial resolution of the data. The peak value is completely reasonable for a fairly massive spiral. The expansion velocity on the other hand is surprising. It should be small, but it’s not especially so. Nowhere do the error bars include 0.

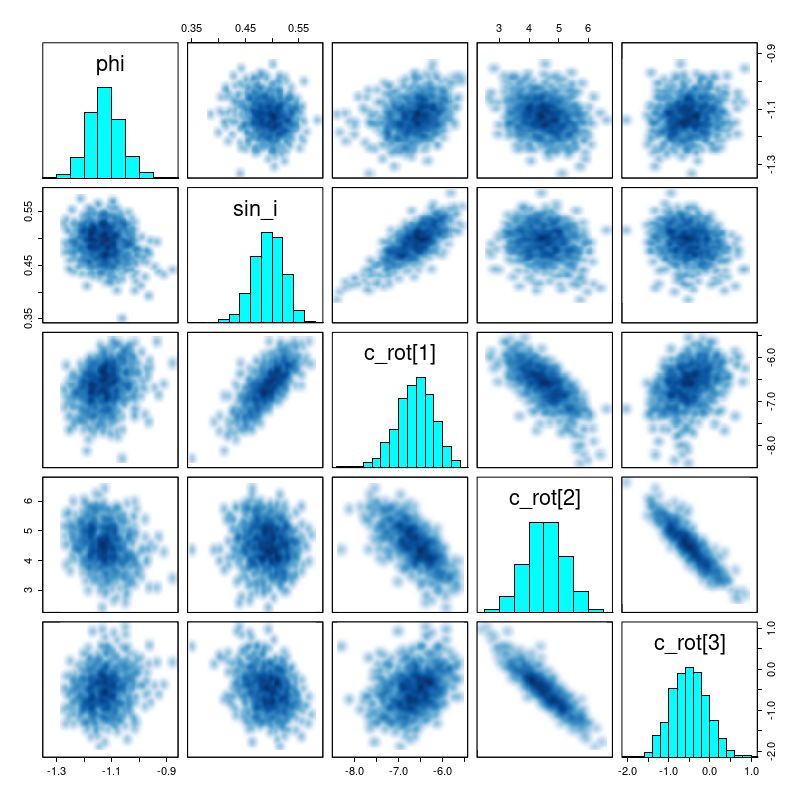
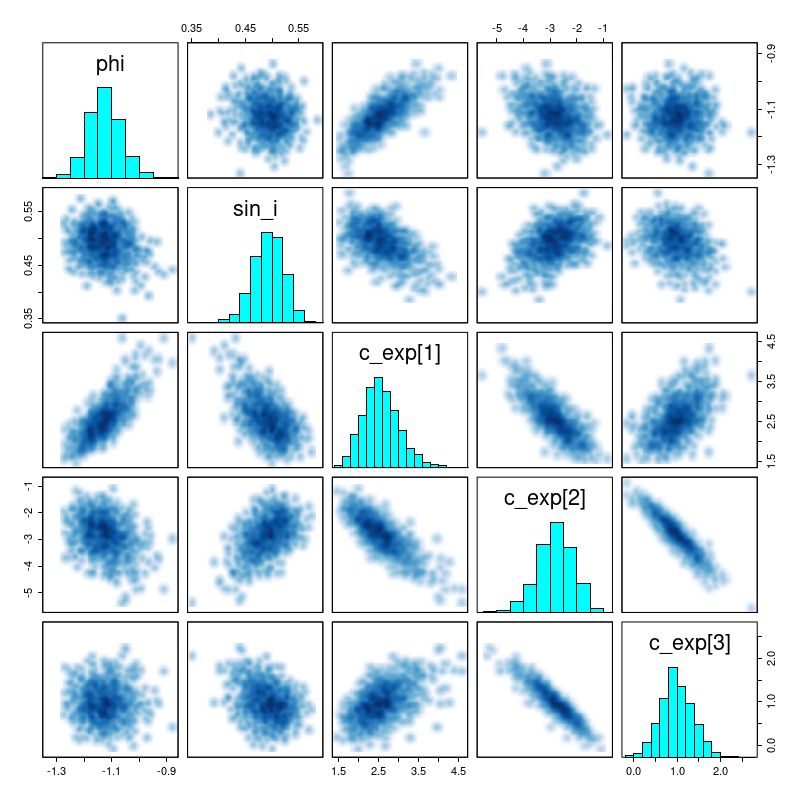
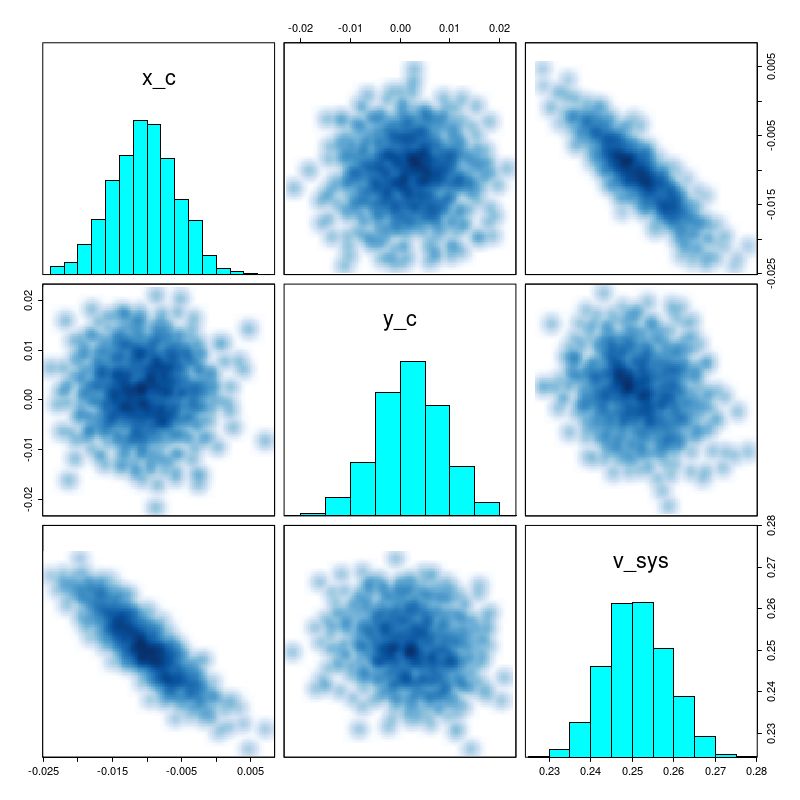
There are a number of graphical tools that are useful for assessing MCMC model performance. Here are some pairs plots of the main model parameters:

phi_sini_crot_1-218280
Pairs plot of posteriors of phi, sin_i, and c_rot
phi_sini_cexp_1-218280
Pairs plot of posteriors of phi, sin_i, and c_exp
xc_yc_vsys_1-218280
Pairs plot of x_c, y_c, v_sys

There are several significant correlations here, none of which are really surprising. The polynomial coefficients are strongly correlated. The inclination angle is strongly correlated with rotation velocity and slightly less, but still significantly correlated with expansion velocity. The orientation angle is slightly correlated with rotation velocity but strongly correlated with expansion. The estimated system velocity is strongly correlated with the x position of the kinematic center but not y — this is because the rotation axis is nearly vertical in this case. The relatively high value of v_sys (posterior mean of 25 km/sec) is a bit of a surprise since the SDSS spectrum appeared to be well centered on the nucleus and with an accurate redshift measurement. Nevertheless the value appears to be robust.

Stan is quite aggressive with warnings about convergence issues, and it reported none for this model run. No graphical or quantitative diagnostics indicated any problems. Nevertheless there are several indicators of possible model misspecification.

  1. Signs of structure in residual maps are interesting because they indicate perturbations of the velocity field as small as ∼10 km/sec by spiral structure or bars may be detectable. But it also indicates the assumption of iid residuals is false.
  2. It’s hard to tell from visual inspection if the symmetrically disposed velocity residuals near the nucleus are due to rotating rings of material or streaming motions, but in any case a low order polynomial can’t be fit to them. I will show more dramatic examples of this in a future post.
  3. Large scale expansion (or contraction) shouldn’t be seen in a disk galaxy, but the estimated expansion velocity is rather high in this case. Perturbations by the rather prominent bar would indicate that a model with a \(2 \theta\) angular dependence should be explored.

Next up, a possible partial solution.


Kinematics 2 – Disk galaxy rotation curves (simple version)

In the course of studying star formation histories I’ve accumulated lots of velocity fields similar to the ones I just posted about. For purposes of SFH modeling their only use is to reduce wavelengths to the galaxy rest frame. It’s not sufficient just to use the system redshift because peculiar velocities of a few hundred km/sec (typical for disk galaxies) translate into spectral shifts of 2-3 pixels, enough to seriously impair spectral fits. Naturally however I wanted to do something else with these data, so I decided to see if I could model rotation curves. And, since I’m interested in Bayesian statistics and was using it anyway, I decided to try Stan as a modeling tool. This is hardly a new idea; in fact I was motivated in part by a paper I encountered on arxiv by Oh et al. (2018), who attempt a more general version of essentially the same model.

The basic idea behind these models is that if the stars and/or gas are confined to a thin disk and moving in its plane we can recover their full velocities from the measured radial velocities when the plane of the galaxy is tilted by a moderate amount to our line of sight (inclination angles between about 20o and 70o are generally considered suitable). The equations describing the tilted disk model are given in, among many other places,  Teuben (2002). I reproduce them here with some minor notational changes. The crude sketch below might or might not make the geometry of this a little clearer. The galaxy is inclined to our line of sight by some angle \(i\)  (where 0 is face-on), with the position angle of the receding side \(\phi\), by convention measured counterclockwise from north. The observed radial velocity \(v(x,y)\) at cartesian coordinates \((x,y)\) in the plane of the sky can be written in terms of polar coordinates \((r, \theta)\) in the plane of the galaxy as

$$v(x,y) = v_{sys} +  \sin i  (v_{rot} \cos \theta + v_{exp} \sin \theta) $$

where

$$\sin \theta = \frac{- (x-x_c)  \cos \phi – (y-y_c) \sin \phi}{r \cos i}$$

$$\cos \theta = \frac{ – (x-x_c) \sin \phi + (y-y_c) \cos \phi}{r}$$

and \(v_{sys}, v_{rot}, v_{exp}\) the overall system velocity at the kinematic center \((x_c, y_c)\), rotational (or transverse), and expansion (or radial) components of the measured line of sight velocity.


ellipse
the tilted disk model

The transformation between coordinates on the sky and coordinates in the plane of the galaxy can be written as a sequence of vector and matrix operations consisting of a translation, rotation, and a stretch:

$$[\hat x, \hat y] = [(x – x_c), (y-y_c)] \mathbf{R S}$$

$$ \mathbf{R} = \left( \begin{array}{c} -\cos \phi & -\sin \phi \\ -\sin \phi & \cos \phi \end{array} \right)$$

$$ \mathbf{S} = \left( \begin{array}{c} 1/\cos i & 0\\ 0 & 1 \end{array} \right)$$

and now the first equation above relating the measured line of sight velocity to velocity components in the disk can be rewritten as

$$v(x, y) = v_{sys} + \sin i [v_{rot}(\hat x, \hat y) \hat y/r + v_{exp}(\hat x, \hat y) \hat x/r]$$

Note that I am defining, somewhat confusingly,

$$\cos \theta = \hat y/r \\ \sin \theta = \hat x/r$$

with

$$r = \sqrt{\hat x^2 + \hat y^2}$$

This is just to preserve the usual convention that the Y axis points up, while also preserving the astronomer’s convention that angles are measured counterclockwise from north.

Stan supports a full complement of matrix operations and it turns out to be slightly more efficient to code these coordinate transformations as matrix multiplications, even though it involves some copying between different data types.

So far this is just geometry. What gives the model physical content is that both \(v_{rot}\) and \(v_{exp}\) are assumed to be strictly axisymmetric. This seems like a very strong assumption, but these can be seen as just the lowest order modes of a Fourier expansion of the velocity field. There’s no reason in principle why higher order Fourier terms can’t be incorporated into the model. The appropriateness of this first order model rests on whether it fits the data and its physical interpretability.

How to represent the velocities posed, and continues to pose, a challenge. Smoothing splines have desirable flexibility and there’s even a lengthy case study showing how to implement them in Stan. I tried to adapt that code and found it to be quite intractable, the problem being that coordinates in the disk frame are parameters, not data, so the spline basis has to be rebuilt at each iteration of the sampler.

In order to get started then I just chose a polynomial representation. This isn’t a great choice in general because different orders of the polynomial will be correlated which leads to correlated coefficient estimates. If the polynomial order chosen is too high the matrix of predictors becomes ill conditioned and data can be overfit. This is true for both traditional least squares and Bayesian methods. The minimum order to be included is linear, because both \(v_{rot}\) and \(v_{exp}\) have limiting values of 0 at radius 0. This is both because of continuity and identifiability: a non-zero velocity at 0 is captured in the scalar parameter \(v_{sys}\). It takes at least a 3rd order polynomial to represent the typical shape of a rotation curve; I found that convergence issues started to become a problem at as low as 4th order, so I just picked 3rd order for the models reported here. In the next or a later post I will show a partial solution to a more flexible representation, and I may revisit this topic in the future.

There are two angles in the model, and this presents lots of interesting complications. First, it’s reasonable to ask if these should be treated as data or parameters of the model. There are useful proxies for both in the photometric data provided in the MaNGA catalog, in fact there are several. Some studies do in fact fix their values. I think this is both a conceptual and practical error. First, these are photometric measurements not kinematic ones. They aren’t the same thing. Second, they are subject to uncertainty, possibly a considerable amount. Failing to account for that could lead to seriously underestimated uncertainties in the velocities. In fact I think much of the literature is significantly overoptimistic about how well constrained are rotation velocities.

So, both the inclination and major axis orientation are parameters. And this immediately creates other issues. Hamiltonian Monte Carlo requires gradient evaluation, and the version implemented in Stan requires the gradient to exist everywhere in \(\mathbb{R}^N\). Bounded parameters are automatically transformed to create new, unbounded ones. But this creates an acknowledged problem that circles can’t be mapped to the real line, at least in a way that preserves probability measure everywhere. There are a couple potential ways to avoid this problem, and I chose different ones for the inclination and orientation angles.

The inclination turned out to be the easier to deal with, at least in terms of model specification. First, the inclination angle is constrained to be between 0 and 90o. Instead of the angle itself I make the parameter \(\sin i\) (or \(\cos i\); it turns out to make no difference at all which is used). This is constrained to be between 0 and 1 in its declaration. Stan maps this to the real line with a logistic transform, so the endpoints map to \(\mp \infty\). But that creates no issue in practice because recall this model is only applicable to disk galaxies with moderate inclination. Rotation can’t be measured at all in an exactly face on galaxy. Rotation is all that can be measured in an exactly edge on one, but this model is misspecified for that case. If contrary to expectations the posterior wants to pile up near 0 or 1 it tells us either that something is wrong with the model or data or that the actual inclination is outside the usable range.

Even though the parametrization is straightforward inference about the inclination can be problematic because it is only weakly identified: notice it enters the velocity equation multiplicatively so, for example, halving it’s value and simultaneously doubling both velocity components produces exactly the same likelihood value. Identifiability therefore is only achieved through the stretch operation and through the prior.

There are two possible ways to parametrize the orientation angle, which is determined modulo \(2 \pi\). I chose to make the angle the parameter and to leave it unbounded. This creates a form of what statisticians call a label switching problem: suppose we try an improper uniform prior for this parameter (generally not a good idea), and suppose there’s a mode in the posterior at some angle \(\hat \phi\). Then there will be other modes at \(\hat \phi \pm \pi\) with the signs of the velocities flipped, and at \(\hat \phi \pm \pi/2\) with \(v_{rot}\) taking the role of \(v_{exp}\) and vice versa. Therefore even if there’s a well behaved distribution around \(\hat \phi\) it will be replicated infinitely many times, making the posterior improper. The solution to this is to introduce a proper prior and in practice it has to be informative enough to keep the sampler from hopping between modes.

Since the orientation angle enters the model only through its cosine and sine the other solution available in Stan is to declare the cosine/sine pair as a 2 dimensional unit vector. This solves the potential improper posterior problem, but it doesn’t solve the mode hopping problem; a moderately informative prior is still needed to keep the elements of the vector from flipping signs.

I’ve tried both the direct parameterization and the unit vector version, and both work with appropriate priors. I chose the former mostly because I expect the angle to have a fairly symmetrical posterior, which makes a gaussian prior a reasonable choice.  Choosing a prior for the unit vector that makes the posterior of the angle symmetrical seems a trickier task. It turns out that the data usually has a lot to say about the orientation angle, so as long as mode hopping is avoided its effect on inferences is much less problematic than the inclination.

Well, I’ve been more verbose than expected, so again I’ll stop the post halfway through. Next time I’ll take a selective look at the code and some results from the data set introduced last time.


Kinematics 1b – Velocity offsets finally

Now that I have some data in a form suitable for further analysis my next step is to estimate radial velocity offsets. Part of the metadata is a system redshift z taken from the MaNGA observation catalog, which in turn is derived from the NSA catalog. Most redshifts are from the SDSS legacy survey, and usually but not always the spectroscopic target is close to the system nucleus, which is generally at the IFU center. What I actually measure then are redshift offsets from the cataloged system redshift, and I expect those most of the time to be small. The algorithm I developed uses a straightforward, not quite brute force template matching procedure that I believe, without having seen the code, is similar to that used in the SDSS spectro pipeline. This is a simpler task though because there’s no need to distinguish among stars, galaxies, and QSO’s and the range of redshifts to be probed is much smaller.

The templates I use are a set of 15 eigenspectra from a principal components analysis of ∼16,000 SDSS legacy survey galaxy spectra using an algorithm published by Tsalmantza and Hogg (2012). These are of some independent interest, but I will defer writing about them until a later post. The algorithm returns a single blended estimate for both stars and ionized gas. This differs from the MaNGA science team’s data analysis pipeline which produces separate estimates for stars and gas. From the small number of thumbnail size plots of velocity fields that have been published it’s evident that one or the other of these estimates is usually significantly noisier. Blended estimates should be cleaner provided ionized gas and stars are kinematically tightly coupled. This isn’t always true — in fact there is at least one published paper studying MaNGA galaxies with kinematically decoupled gas and stars (Jin et al. 2016). It also performs poorly if multiple velocity components are present, as in ongoing mergers, or if spectra are contaminated by foreground stars.

For completeness, and because the function is fairly small I reproduce the code here:

getdz <- function(gdat, lib, snrthresh=5, nlthresh=2000, dzlim=0.003, searchinterval=1e-4) {
  dims <- dim(gdat$flux)
  nr <- dims[1]
  nc <- dims[2]
  dz <- matrix(NA, nr, nc)
  dz.err <- matrix(NA, nr, nc)
  z <- gdat$meta$z
  lambda <- gdat$lambda
  fmla <- as.formula(paste("f ~", paste(names(lib)[-1], collapse="+")))
  fn <- function(x) {
    lambda.out <- lambda/(1+z+x)
    lib.out <- regrid(lambda.out, lib)
    lfit <- lm(fmla, data=lib.out, weights=iv)
    deviance(lfit)
  }
  fn_v <- Vectorize(fn)
  z_search <- seq(-dzlim, dzlim, by=searchinterval)

  for (i in 1:nr) {
    for (j in 1:nc) {
      if (is.na(gdat$snr[i,j]) || gdat$snr[i,j]<=snrthresh) next
        f <- gdat$flux[i, j, ]
        if (length(which(!is.na(f))) < nlthresh) next
          iv <- gdat$ivar[i, j, ]
          dev_grid <- fn_v(z_search)
          z0 <- z_search[which.min(dev_grid)]
          bestz <- Rsolnp::solnp(pars=z0, fun=fn, 
                                 LB=z0-searchinterval, UB=z0+searchinterval, 
                                 control=list(trace=0))
          dz[i,j] <- bestz$pars
          dz.err[i,j] <- sqrt(2./bestz$hessian)
    }
  }
  list(dz=dz, dz.err=dz.err)
}

I’ll review a few points about this function. The arguments gdat and lib are the IFU data described in the last post and a data frame with the rest frame template wavelengths and eigenspectra. I’ve found that sometimes large portions of spectra are masked by the DRP; often these are near the edge of the IFU and have very low signal to noise, so I set a minimum threshold for number of unmasked wavelength bins. The other arguments with default values just set reasonable limits for SNR, maximum redshift deltas, and grid size for preliminary search.

The function fn is the key section of code. Given the system redshift and a trial offset given in the function argument it calculates the galaxy restframe wavelengths, regrids the eigenspectra library to that vector of wavelengths, then fits it to the galaxy spectrum by weighted least squares and returns the deviance (weighted sum of squares). This function takes advantage of R’s rather peculiar scoping rules. When R encounters a name it checks the current environment for a value. If it finds one it uses it, otherwise it checks the parent environment, and if necessary the parent of the parent, etc. until it either finds the name or runs out of environments.

Just below the function definition I use the built in R function Vectorize, which takes a function that returns a single value and creates a new function that returns a vector. The brute force part of this code is a search over a uniformly spaced grid to isolate an interval containing the global minimum. This calls the vectorized version fn_v of fn, thus avoiding an explicit loop (which are generally best avoided in R). This also lets me write the grid search portion in two lines of code, which could have been condensed to one. Finally I use a general nonlinear optimization routine to refine the redshift offset estimate. I’ve found the function solnp in the independently developed Rsolnp package to be somewhat more robust than R’s built in options, but for this application it’s somewhat of an overkill. The return value from the function is a list of redshift offsets and uncertainties estimated from the local curvature. Here by the way is another R peculiarity. The value returned by a function is the last expression evaluated, which in this case is just the creation of a named list. Although there is a built in function return() nobody seems to quite know what it actually does and it’s rarely necessary to use it.

This function has considerable room for efficiency improvements. For one thing this task is embarrassingly parallel since each spaxel/fiber is evaluated independently, so this could easily be broken into chunks and fed to multiple cores when available. Also, the built in R function lm() for linear modeling does more than necessary and is somewhat slower than just doing the matrix algebra. So this function may change in the future.

Let’s take a look at a few examples. I modified the code to return the grid of deviance values for a single input spectrum. For this illustration I took the spectra from the eastern-most, central, and western-most fiber/pointing combinations from the stacked RSS data. The spectra are shown in the top row, with the run of deviance values with redshift offset in the bottom. Note there are many local minima in the deviance plots for the two corner spectra, which have very low S/N. This is probably due to accidental alignments of noise spikes with features in the eigenspectra rather than actual overlapping component populations. Somewhat surprisingly though the valleys in the vicinity of the global optima are even more steep sided than that for the central fiber, so the redshift offsets are quite well constrained. The presence of local optima is problematic for most nonlinear optimizers, which is why I use a brute force search to isolate global optima.

dzexamp Deviance vs. delta z for 3 fiber/pointing combinations

Next are the full velocity fields, first from the stacked RSS data and below it from the data cube. I set a signal to noise threshold of 3 for these, which seems optimistic but is usually OK for extracting velocities. The symbols in the first graph aren’t quite to scale — the fiber positions actually overlap somewhat. In the second graph contour lines are separated by 25 km/sec.

Experts in data visualization generally frown on the use of rainbows, but I think they’re OK for this one specific application. In my shared code I define

rainbow <- c("blue", "cyan", "green", "yellow", "red")  

as the set of additive and subtractive primary colors from blue through red. In ggplot2 plots of continuous variables this gets expanded to a fairly perceptually uniform spectrum optimized for display on a monitor.
vf-8942-12702 Example velocity field

vf_8942-12702-cube Example velocity field from data cube

I’m going to take a little closer look at the comparison between the RSS derived velocity field and the one from the cube. First I use the function interp from the package akima to interpolate the RSS data onto the same 74×74 grid as the data cube. The code to do that and display the results is:

> allok <- complete.cases(dv.stack)
> dv.interp <- akima::interp(x=gdat.stack$xpos[allok], y=gdat.stack$ypos[allok], z=dv.stack[allok], xo=-3600*gdat.cube$xpos, yo=3600.*gdat.cube$ypos, linear=FALSE)
> ggimage(dv.interp$z, dv.interp$x, dv.interp$y, col=rainbow, addContour = T, binwidth = 25, legend="dv km/sec")
vf_8942-12702-rss-interp
Interpolated velocity field from RSS data

These look pretty similar. Taking the difference:

vfdiff_8942-12702-rsscube
Velocity difference: interpolated RSS – cube

There’s some possible structure here — there’s an irregular ring of negative velocity differences punctuated with a small area of positive difference. It’s a little hard to relate these to features in the galaxy (and I’d like to develop better tools for this), but comparing to the SDSS supplied thumbnail with superposed IFU footprint the ring might correspond to the inner arms and perhaps where the bar meets the arms:

thumbnail for MaNGA plateifu 8942-12702

We’ll see later that arms and bars do measurably perturb velocities, and this suggests that different interpolation schemes might affect the fine details. But this is a higher order problem. Overall the velocity differences are symmetrically distributed around 0, with a standard deviation of just 2.7 km/sec and just slightly heavy tails:

hist_vdiff

Next up — doing something with velocity fields…