
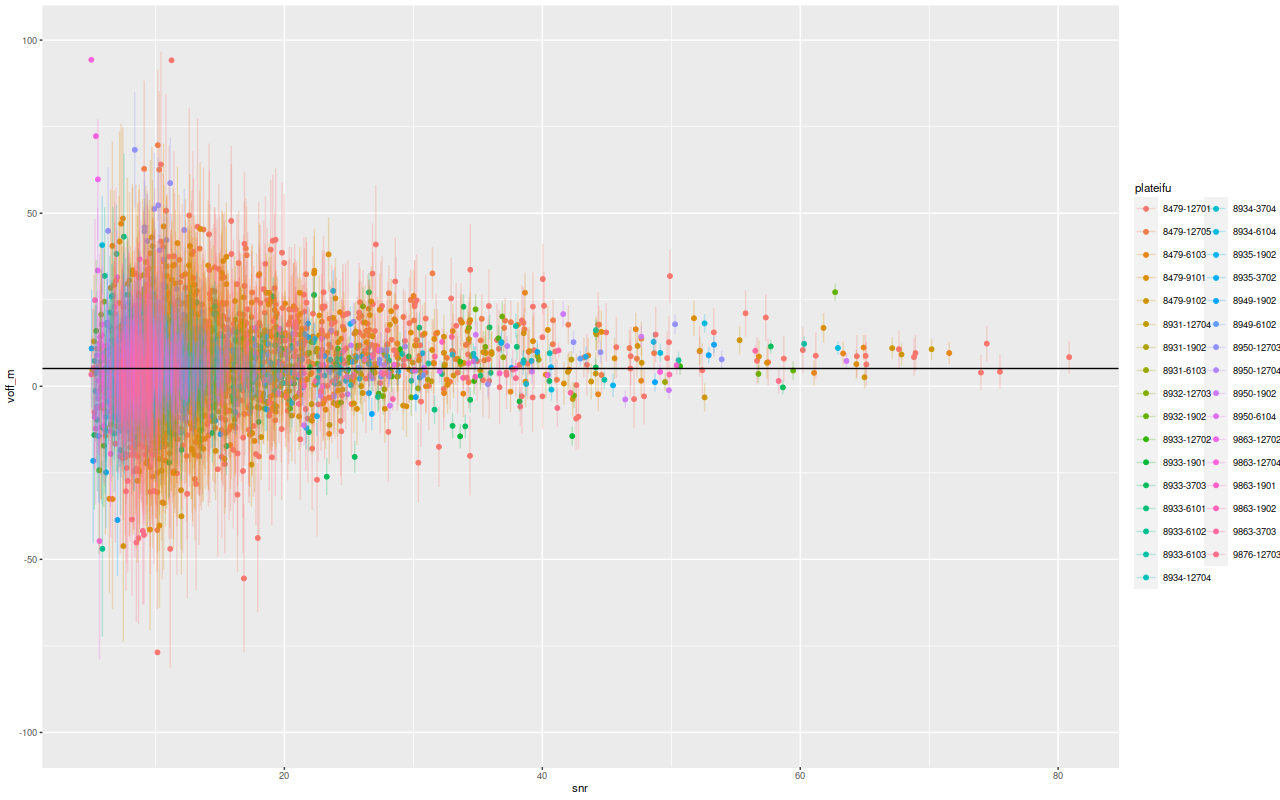
A while back I completed LOSVD models for 3348 spectra in the 33 Coma Cluster galaxies I chose for an initial sample. I want to look briefly at a couple summary statistics from the models. For each sample in the posterior I calculate first and second moments of the velocity distribution, and from those I calculate means and standard deviations of velocity offsets and velocity dispersions. Recall from the earlier posts that wavelengths are in the spectrum rest frame with peculiar velocities estimated by fitting a set of eigenspectra to the data. The first plot below is the mean velocity offset with errorbars ± 1 standard deviation versus the signal to noise in each spectrum. The horizontal line is the overall median of 5.25 km/sec. This is less than 1/10th the width of a wavelength bin and, I think, consistent with the absolute wavelength calibration accuracy claimed by the MaNGA team. From an eyeball analysis there doesn’t appear to be any trend in the mean with S/N, but the dispersion in estimates increases as the data quality gets worse. This seems unlikely to be a real problem. Two outliers cut off from the graph had mean velocity offsets of ≈ 200 km/sec, which is only 3 wavelength bins.
Possibly more concerning is that the mean velocity dispersion also shows a systematic trend with S/N:
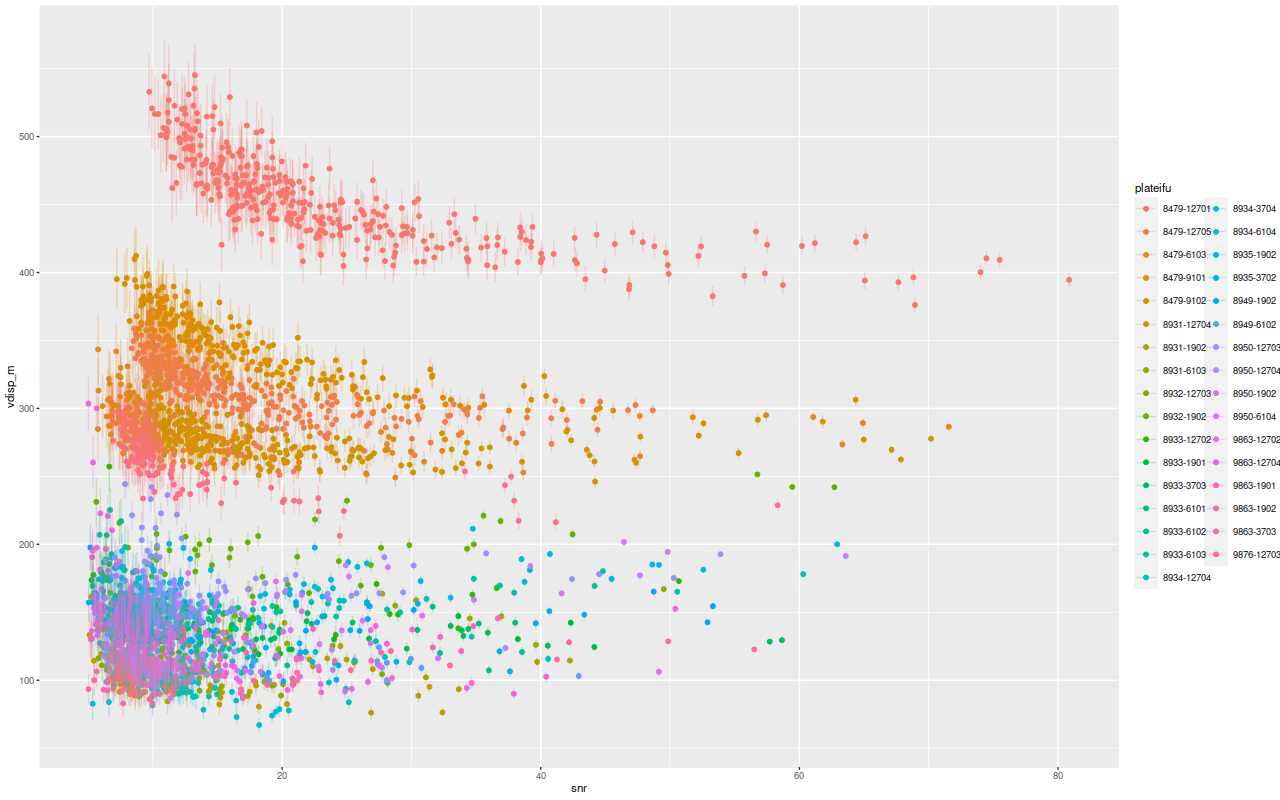
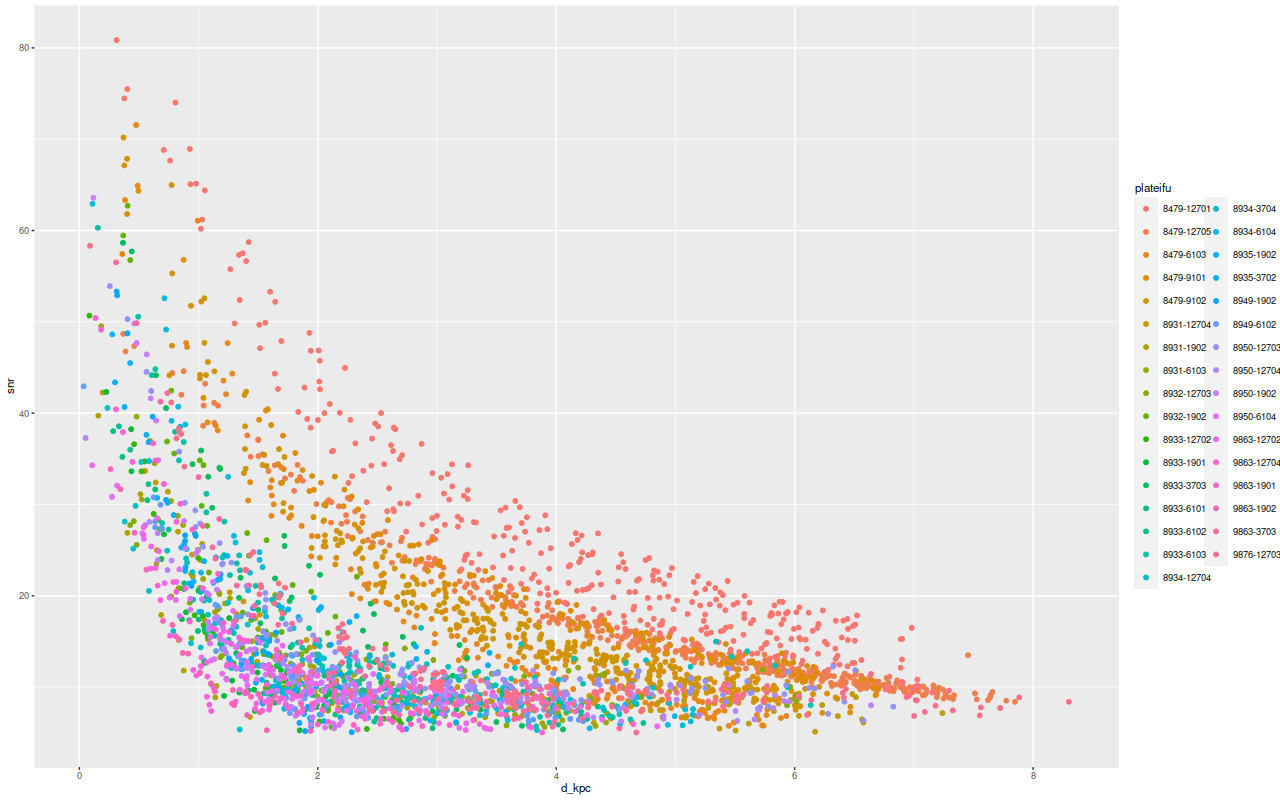
Of course there is a wide range of velocity dispersions since there’s a range of galaxy masses in this sample, but each galaxy shows a similar trend. This matters because, of course, S/N correlates strongly with distance from the nucleus which is usually the IFU center and this in turn leads to potentially spurious correlations with distance.
For example here are results for the cD galaxy NGC 4889 with MaNGA plateifu 8479-12701. This has the highest overall velocity dispersion in the sample by a fair margin as seen in the plots above. Plotting the estimated velocity dispersion against distance from the IFU center shows an apparent systematic increase1the trendline is just a “loess” smooth fit to mislead the eye and shouldn’t be interpreted as any kind of analysis:
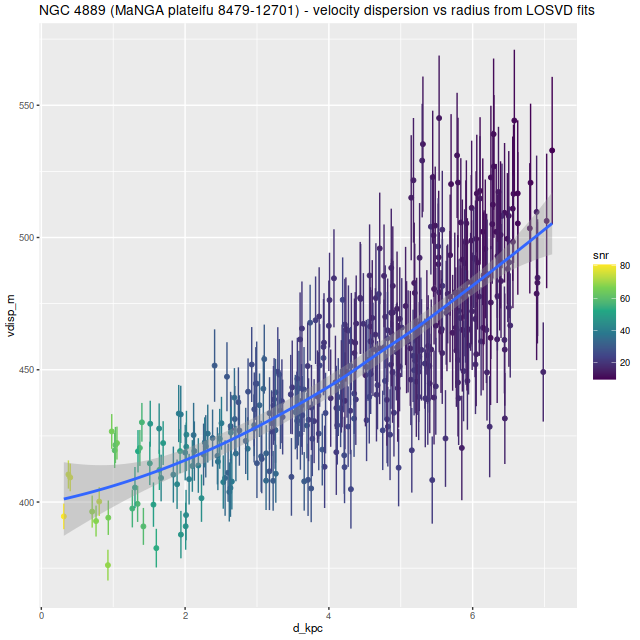
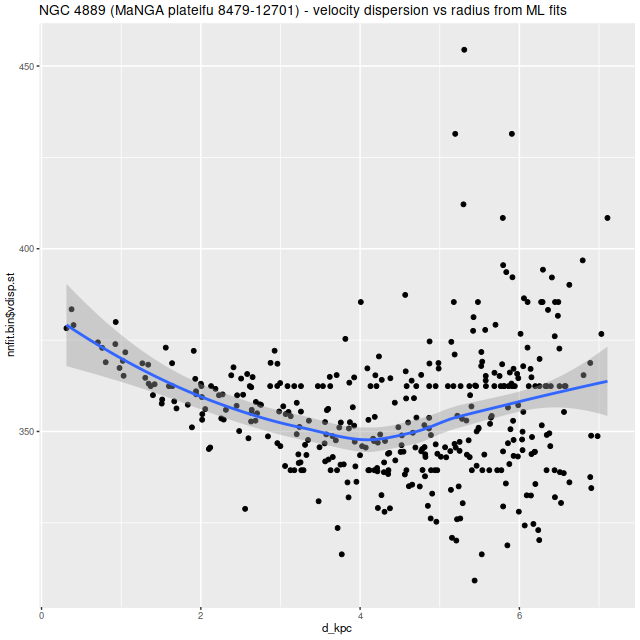
Now this could be a real trend: my recollection is the outskirts of cD galaxies have essentially the velocity dispersion of the clusters they live in, which is taken as strong evidence that they grow by cannibalism. But the IFU only covers the inner part of this galaxy and in any case the confounding effect of the correlation between S/N and modeled velocity dispersion prevents any conclusion. Just for comparison here is the same relation using the single gaussian estimates from the preliminary maximum likelihood fits:
So, if we’re interested in kinematics or dynamics some regularization with an informative prior seems advisable. What’s not so clear is whether this matters in SFH modeling, which as I’ve said many times is what most interests me. There’s one way to find out…