
One more post making use of the measurement error model introduced last time and then I think I move on. I estimate the dust attenuation of the starlight in my SFH models using a Calzetti attenuation relation parametrized by the optical depth at V (τV). If good estimates of Hα and Hβ emission line fluxes are obtained we can also make optical depth estimates of emission line regions. Just to quickly review the math we have:
\(A_\lambda = \mathrm{e}^{-\tau_V k(\lambda)}\)
where \(k(\lambda)\) is the attenuation curve normalized to 1 at V (5500Å) and \(A_\lambda\) is the fractional flux attenuation at wavelength λ. Assuming an intrinsic Balmer decrement of 2.86, which is more or less the canonical value for H II regions, the estimated optical depth at V from the observed fluxes is:
\(\tau_V^{bd} = \log(\frac{\mathrm{F}(\mathrm{H}\alpha)/\mathrm{F}(\mathrm{H}\beta)}{ 2.86})/(k(4861)-k(6563))\)
The SFH models return samples from the posteriors of the emission lines, from which are calculated sample values of \(\tau_V^{bd}\).
Here is a plot of the estimated attenuation from the Balmer decrement vs. the SFH model estimates for all spectra from the 28 galaxy sample in the last two posts that have BPT classifications other than no or weak emission. Error bars are ±1 standard deviation.
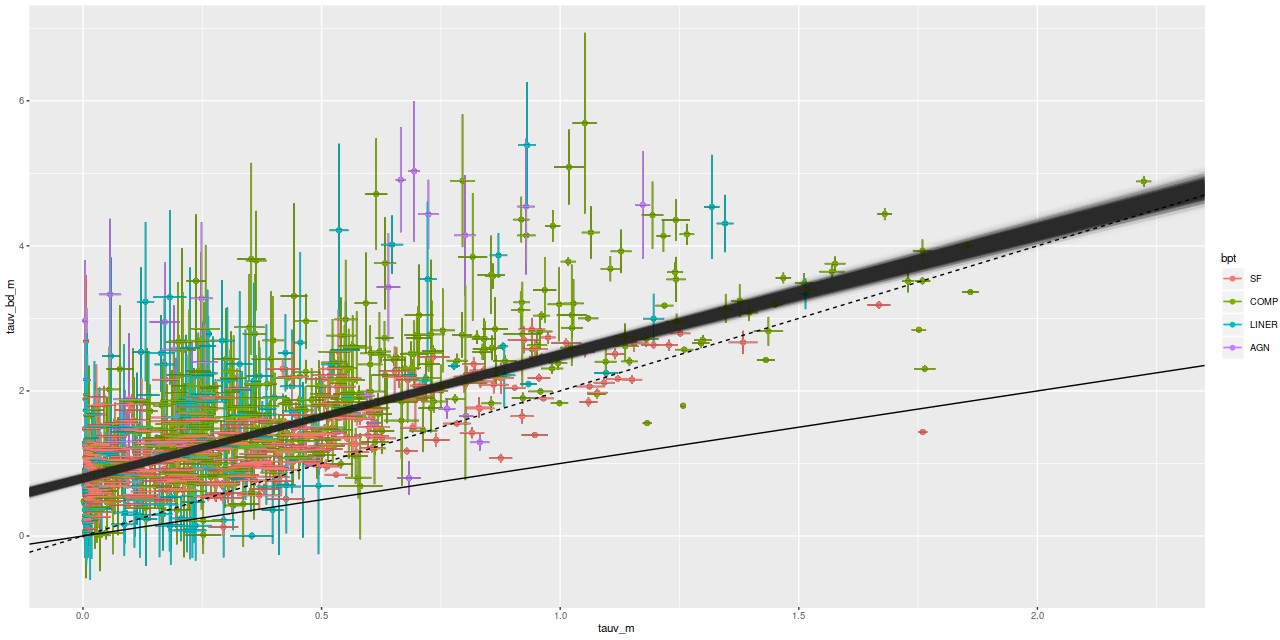
It’s well known that attenuation in emission line regions is larger than that of the surrounding starlight, with a typical reddening ratio of ∼2 (among many references see the review by Calzetti (2001) and Charlot and Fall (2000)). One thing that’s clear in this plot that I haven’t seen explicitly mentioned in the literature is that even in the limit of no attenuation of starlight there typically is some in the emission lines. I ran the regression with measurement error model on this data set, and got the estimated relationship \(\tau_V^{bd} = 0.8 (\pm 0.05) + 1.7 ( \pm 0.09) \tau_V^{stellar}\) with a rather large estimated scatter of ≈ 0.45. So the slope is a little shallower than what’s typically assumed. The non-zero intercept seems to be a robust result, although it’s possible the models are systematically underestimating Hβ emission. I have no other reason to suspect that, though.
The large scatter shouldn’t be too much of a surprise. The shape of the attenuation curve is known to vary between and even within galaxies. Adopting a single canonical value for the Balmer decrement may be an oversimplification too, especially for regions ionized by mechanisms other than hot young stars. My models may be overdue for a more flexible prescription for attenuation.
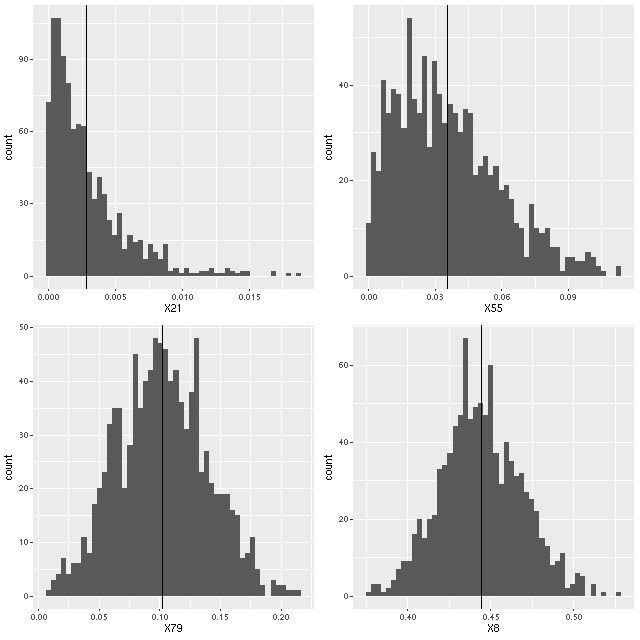
The statistical assumptions of the measurement error model are a little suspect in this data set as well. The attenuation parameter tauv is constrained to be positive in the models. When it wants to be near 0 the samples from the posterior will pile up near 0 with a tail of larger values, looking more like draws from an exponential or gamma distribution than a gaussian. Here is an example from one galaxy in the sample that happens to have a wide range of mean attenuation estimates:
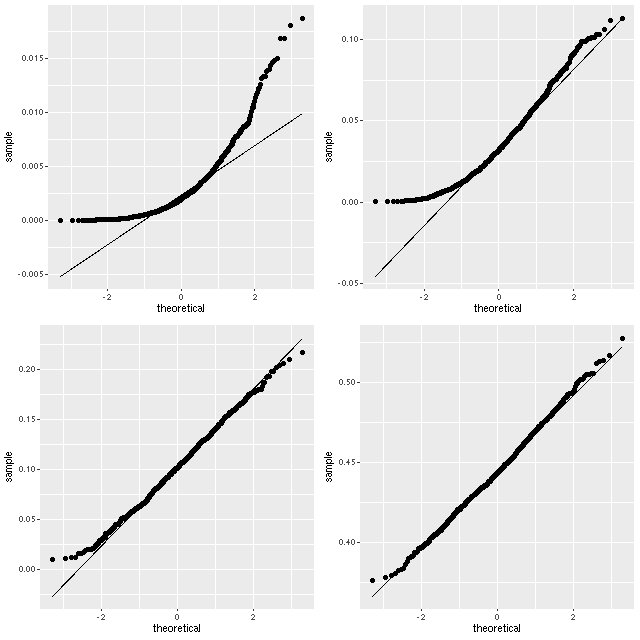
I like theoretical quantile-quantile plots better than histograms for this type of visualization:
I haven’t looked at the distributions of emission line ratios in much detail. They might behave strangely in some cases too. But regardless of the validity of the statistical model applied to this data set it’s apparent that there is a fairly strong correlation, which is encouraging.