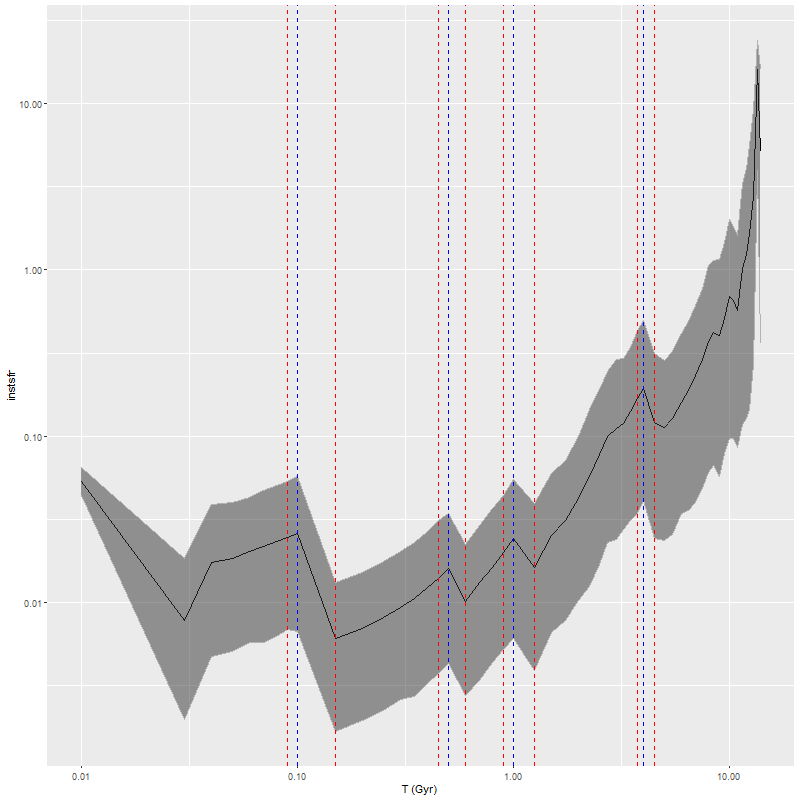
One of my favorite visualization tools for displaying results of star formation history modeling is a ribbon plot of star formation rate versus look back time. This simply plots the marginal posterior mean or median SFR along with 2.5 and 97.5th percentiles (by default) as the lower and upper boundaries of the ribbon. I’ve been using the simplest possible definition of the star formation rate, namely the total mass born in each age bin divided by the interval between the nominal age of each SSP model and the next younger. One striking feature of these plots that’s especially evident in grids of SFH models for an entire galaxy like the one shown in my last post is that there are invariably jumps in the SFR at certain specific ages as marked below. This particular example is from a sample of passively evolving Coma cluster galaxies, but the same features are seen regardless of the likely “true” star formation history.

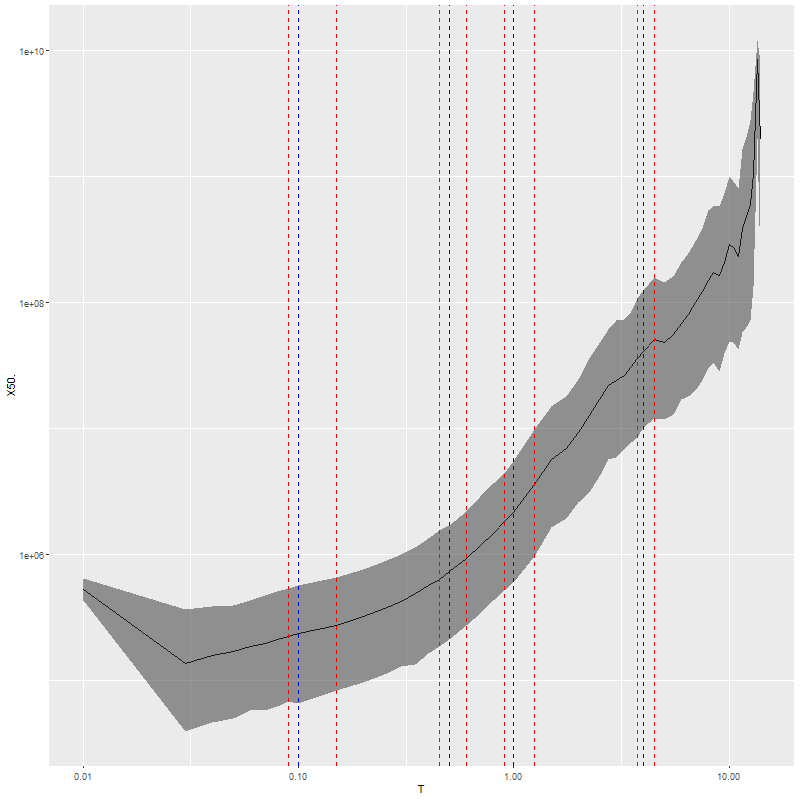
These jumps are artifacts of course: the BaSTI isochrones used for the EMILES SSP models that I currently use are tabulated at age intervals that are constant over certain age ranges, with jumps at 4 ages1100 Myr, 500 Myr, 1 Gyr, and 4 Gyr. The jumps in model SFR occur exactly at the breaks in the age intervals. This turns out to be due to an otherwise welcome feature of the SFH models that they “want” to produce SSP contributions that vary smoothly with age as shown below for the same model run. So for example the stellar mass born in the 90-100 Myr age bin per the model is about 90% of that in the 100-150 Myr bin while the time interval increases by a factor of 5, so the model SFR declines by a factor 4.5 or around 0.6 dex.

Can I do anything about this? Should I? Changing how I calculate the star formation rate might work — this is after all a derivative and I’m currently using the most stupidly simple numerical approximation possible. It also might help to adjust the effective ages of each SSP model. I should also look at the priors on the SSP model coefficients, although as I noted some time ago it’s hard to affect the model star formation histories much with adjustments to priors.
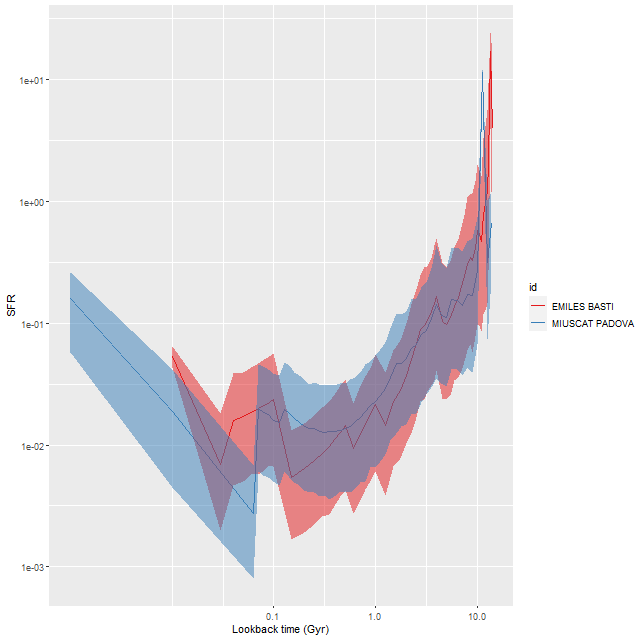
These jumps are something of a peculiarity of the BaSTI isochrones. I had previously used a subset of MILES SSP models from Padova isochrones, which are tabulated at equal logarithmic age intervals. A comparison model run lacks large jumps except for an early time burst. Since the youngest age bin in the Padova isochrones is around 60 Myr I had added two younger SSP models from an update of the BC03 library, and these show abrupt jumps in model SFR. This is also the case with the youngest age bin in my currently used EMILES library.

A final comment about these visualizations is that often the mode of the posterior distribution of an SSP model contribution is near 0, and it might make sense to display one sided confidence intervals since what we’re really constraining is an upper limit. I may work on this in the future.
