When I first began modeling disk galaxy rotation curves using low order polynomials for the circular velocity I noticed two rather frequent systematics in the model residuals:
- Lobe like areas symmetrically located around the nucleus with approximately equal and opposite signs. Sometimes these are co-located with bar ends but a bar is not always obvious.
- A contrast of a few 10’s of kilometers/sec between spiral arms and interarm regions. This is rather common in grand design spirals.
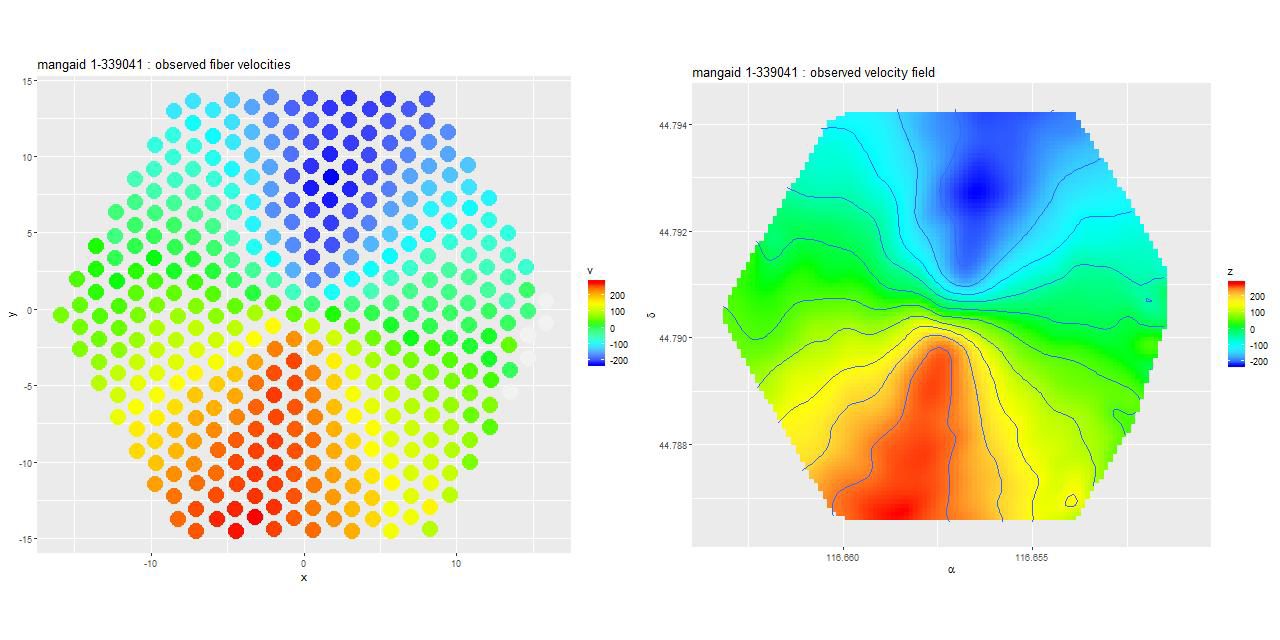
Here’s a particularly dramatic example of symmetrical lobes in mangaid 1-339041 (plateifu 8138-12704), IAU name SDSS J074637.70+444725.8. First, here are the measured line of sight velocities for the fiber spectra:

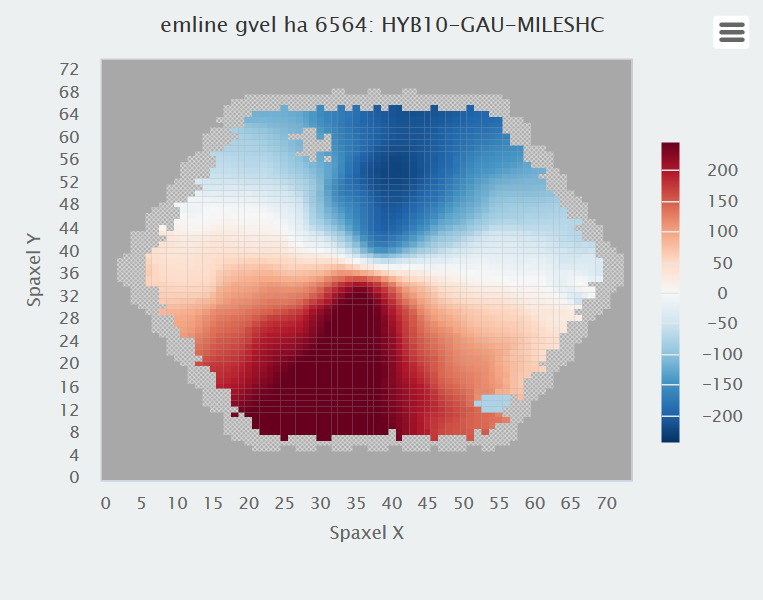
The left plot shows the actual measurements from the stacked RSS file. The right is just an interpolated version of the left. Since value added data is now available it’s worth comparing this to output from “Marvin“. For reference here is the Hα velocity map:

It’s hard to tell in any detail, but these look similar enough and the stellar velocity field as measured by the DAP also looks similar.
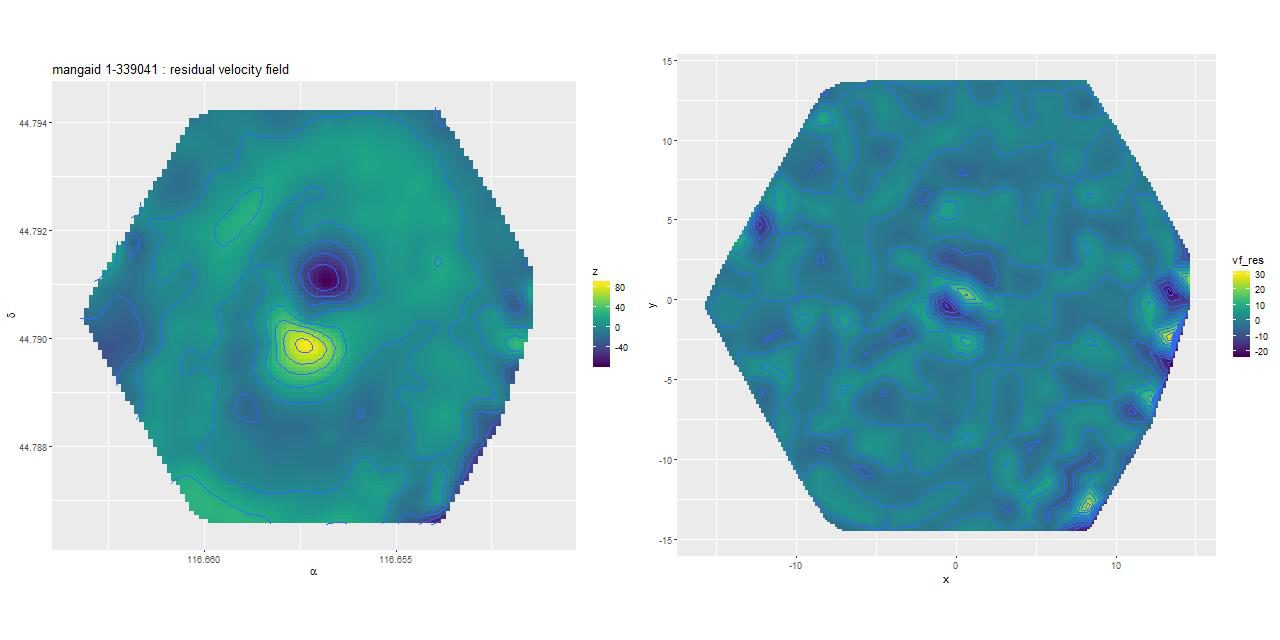
Next, here are the mean residuals from the posterior predictive fits shown as interpolated maps derived from the fits at the observed positions. As promised the left hand map from the low order polynomial fit has prominent lobes situated on either side of the nucleus and a more subtle contrast between spiral arms and interarm regions. The right hand map from the GP model appears to be largely free of systematic patterns. Why the difference?

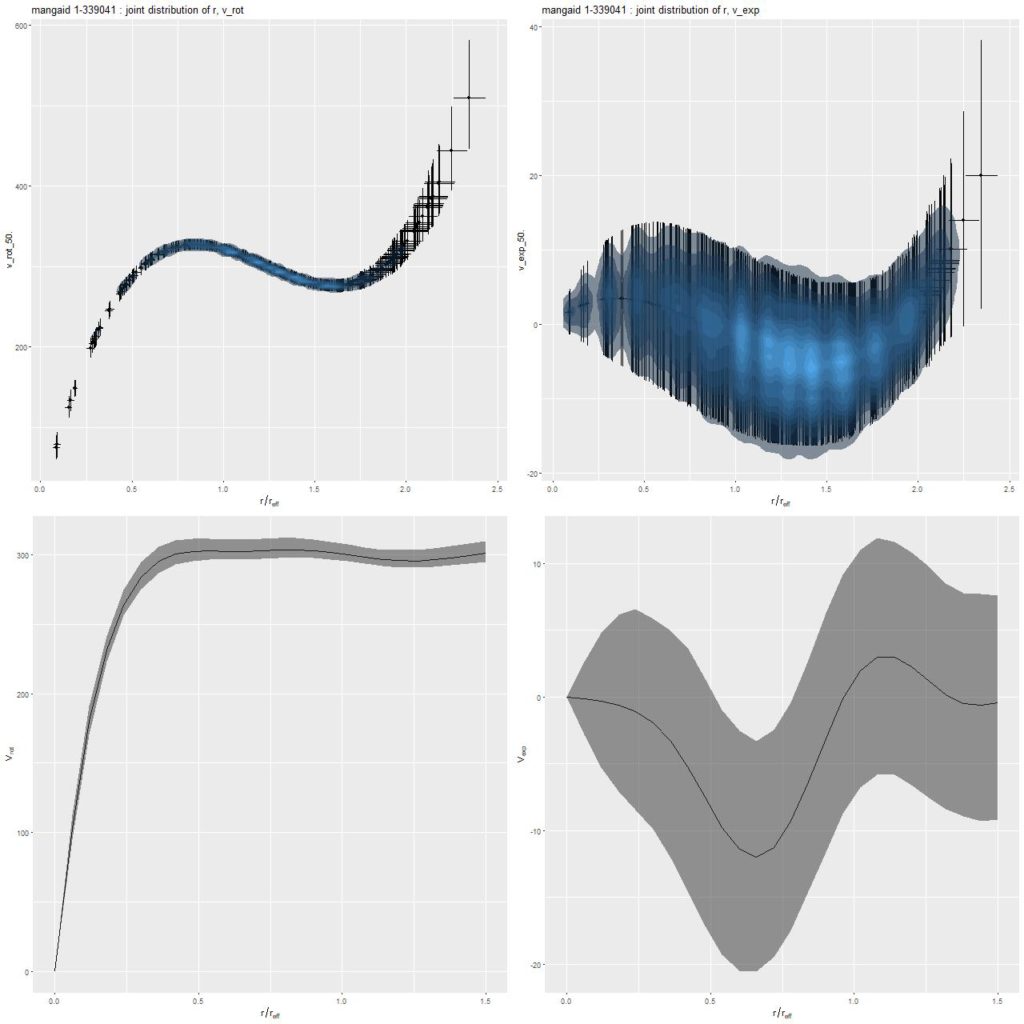
In this case the arctangent mean function I introduced in the last post worked very well, with the estimated circular velocity rising quickly to an asymptotic value of ∼300km/s. The low order polynomial representation is necessarily constrained by the possible shapes of a low order polynomial (in this case cubic), resulting in a shallower initial slope and a first local maximum farther out than in the GP model. The lobed residuals in the polynomial model are therefore seen to be due to an inner disk that’s rotating more rapidly than can be modeled (and not due to a kinematically distinct component or to streaming material).

As a brief morphological note, GZ2 classifiers thought this was a normal looking disk galaxy by an overwhelming majority. It’s hard to say they were wrong based on the SDSS imaging, but the deeper and wider legacy survey thumbnail clearly shows the outer disk to be disturbed, presumably by the edge on disk galaxy to the north — the relative velocities are ∼340km/sec, so they are likely in close proximity.

As time allows I may take a closer look at model diagnostics available in Stan or some more examples. Longer term I plan to take another look at the Baryonic Tully-Fisher relationship for the larger sample available in DR15.
