Kinematics 2 – Disk galaxy rotation curves (simple version)

In the course of studying star formation histories I’ve accumulated lots of velocity fields similar to the ones I just posted about. For purposes of SFH modeling their only use is to reduce wavelengths to the galaxy rest frame. It’s not sufficient just to use the system redshift because peculiar velocities of a few hundred km/sec (typical for disk galaxies) translate into spectral shifts of 2-3 pixels, enough to seriously impair spectral fits. Naturally however I wanted to do something else with these data, so I decided to see if I could model rotation curves. And, since I’m interested in Bayesian statistics and was using it anyway, I decided to try Stan as a modeling tool. This is hardly a new idea; in fact I was motivated in part by a paper I encountered on arxiv by Oh et al. (2018), who attempt a more general version of essentially the same model.

The basic idea behind these models is that if the stars and/or gas are confined to a thin disk and moving in its plane we can recover their full velocities from the measured radial velocities when the plane of the galaxy is tilted by a moderate amount to our line of sight (inclination angles between about 20o and 70o are generally considered suitable). The equations describing the tilted disk model are given in, among many other places,  Teuben (2002). I reproduce them here with some minor notational changes. The crude sketch below might or might not make the geometry of this a little clearer. The galaxy is inclined to our line of sight by some angle \(i\)  (where 0 is face-on), with the position angle of the receding side \(\phi\), by convention measured counterclockwise from north. The observed radial velocity \(v(x,y)\) at cartesian coordinates \((x,y)\) in the plane of the sky can be written in terms of polar coordinates \((r, \theta)\) in the plane of the galaxy as

$$v(x,y) = v_{sys} +  \sin i  (v_{rot} \cos \theta + v_{exp} \sin \theta) $$

where

$$\sin \theta = \frac{- (x-x_c)  \cos \phi – (y-y_c) \sin \phi}{r \cos i}$$

$$\cos \theta = \frac{ – (x-x_c) \sin \phi + (y-y_c) \cos \phi}{r}$$

and \(v_{sys}, v_{rot}, v_{exp}\) the overall system velocity at the kinematic center \((x_c, y_c)\), rotational (or transverse), and expansion (or radial) components of the measured line of sight velocity.


ellipse
the tilted disk model

The transformation between coordinates on the sky and coordinates in the plane of the galaxy can be written as a sequence of vector and matrix operations consisting of a translation, rotation, and a stretch:

$$[\hat x, \hat y] = [(x – x_c), (y-y_c)] \mathbf{R S}$$

$$ \mathbf{R} = \left( \begin{array}{c} -\cos \phi & -\sin \phi \\ -\sin \phi & \cos \phi \end{array} \right)$$

$$ \mathbf{S} = \left( \begin{array}{c} 1/\cos i & 0\\ 0 & 1 \end{array} \right)$$

and now the first equation above relating the measured line of sight velocity to velocity components in the disk can be rewritten as

$$v(x, y) = v_{sys} + \sin i [v_{rot}(\hat x, \hat y) \hat y/r + v_{exp}(\hat x, \hat y) \hat x/r]$$

Note that I am defining, somewhat confusingly,

$$\cos \theta = \hat y/r \\ \sin \theta = \hat x/r$$

with

$$r = \sqrt{\hat x^2 + \hat y^2}$$

This is just to preserve the usual convention that the Y axis points up, while also preserving the astronomer’s convention that angles are measured counterclockwise from north.

Stan supports a full complement of matrix operations and it turns out to be slightly more efficient to code these coordinate transformations as matrix multiplications, even though it involves some copying between different data types.

So far this is just geometry. What gives the model physical content is that both \(v_{rot}\) and \(v_{exp}\) are assumed to be strictly axisymmetric. This seems like a very strong assumption, but these can be seen as just the lowest order modes of a Fourier expansion of the velocity field. There’s no reason in principle why higher order Fourier terms can’t be incorporated into the model. The appropriateness of this first order model rests on whether it fits the data and its physical interpretability.

How to represent the velocities posed, and continues to pose, a challenge. Smoothing splines have desirable flexibility and there’s even a lengthy case study showing how to implement them in Stan. I tried to adapt that code and found it to be quite intractable, the problem being that coordinates in the disk frame are parameters, not data, so the spline basis has to be rebuilt at each iteration of the sampler.

In order to get started then I just chose a polynomial representation. This isn’t a great choice in general because different orders of the polynomial will be correlated which leads to correlated coefficient estimates. If the polynomial order chosen is too high the matrix of predictors becomes ill conditioned and data can be overfit. This is true for both traditional least squares and Bayesian methods. The minimum order to be included is linear, because both \(v_{rot}\) and \(v_{exp}\) have limiting values of 0 at radius 0. This is both because of continuity and identifiability: a non-zero velocity at 0 is captured in the scalar parameter \(v_{sys}\). It takes at least a 3rd order polynomial to represent the typical shape of a rotation curve; I found that convergence issues started to become a problem at as low as 4th order, so I just picked 3rd order for the models reported here. In the next or a later post I will show a partial solution to a more flexible representation, and I may revisit this topic in the future.

There are two angles in the model, and this presents lots of interesting complications. First, it’s reasonable to ask if these should be treated as data or parameters of the model. There are useful proxies for both in the photometric data provided in the MaNGA catalog, in fact there are several. Some studies do in fact fix their values. I think this is both a conceptual and practical error. First, these are photometric measurements not kinematic ones. They aren’t the same thing. Second, they are subject to uncertainty, possibly a considerable amount. Failing to account for that could lead to seriously underestimated uncertainties in the velocities. In fact I think much of the literature is significantly overoptimistic about how well constrained are rotation velocities.

So, both the inclination and major axis orientation are parameters. And this immediately creates other issues. Hamiltonian Monte Carlo requires gradient evaluation, and the version implemented in Stan requires the gradient to exist everywhere in \(\mathbb{R}^N\). Bounded parameters are automatically transformed to create new, unbounded ones. But this creates an acknowledged problem that circles can’t be mapped to the real line, at least in a way that preserves probability measure everywhere. There are a couple potential ways to avoid this problem, and I chose different ones for the inclination and orientation angles.

The inclination turned out to be the easier to deal with, at least in terms of model specification. First, the inclination angle is constrained to be between 0 and 90o. Instead of the angle itself I make the parameter \(\sin i\) (or \(\cos i\); it turns out to make no difference at all which is used). This is constrained to be between 0 and 1 in its declaration. Stan maps this to the real line with a logistic transform, so the endpoints map to \(\mp \infty\). But that creates no issue in practice because recall this model is only applicable to disk galaxies with moderate inclination. Rotation can’t be measured at all in an exactly face on galaxy. Rotation is all that can be measured in an exactly edge on one, but this model is misspecified for that case. If contrary to expectations the posterior wants to pile up near 0 or 1 it tells us either that something is wrong with the model or data or that the actual inclination is outside the usable range.

Even though the parametrization is straightforward inference about the inclination can be problematic because it is only weakly identified: notice it enters the velocity equation multiplicatively so, for example, halving it’s value and simultaneously doubling both velocity components produces exactly the same likelihood value. Identifiability therefore is only achieved through the stretch operation and through the prior.

There are two possible ways to parametrize the orientation angle, which is determined modulo \(2 \pi\). I chose to make the angle the parameter and to leave it unbounded. This creates a form of what statisticians call a label switching problem: suppose we try an improper uniform prior for this parameter (generally not a good idea), and suppose there’s a mode in the posterior at some angle \(\hat \phi\). Then there will be other modes at \(\hat \phi \pm \pi\) with the signs of the velocities flipped, and at \(\hat \phi \pm \pi/2\) with \(v_{rot}\) taking the role of \(v_{exp}\) and vice versa. Therefore even if there’s a well behaved distribution around \(\hat \phi\) it will be replicated infinitely many times, making the posterior improper. The solution to this is to introduce a proper prior and in practice it has to be informative enough to keep the sampler from hopping between modes.

Since the orientation angle enters the model only through its cosine and sine the other solution available in Stan is to declare the cosine/sine pair as a 2 dimensional unit vector. This solves the potential improper posterior problem, but it doesn’t solve the mode hopping problem; a moderately informative prior is still needed to keep the elements of the vector from flipping signs.

I’ve tried both the direct parameterization and the unit vector version, and both work with appropriate priors. I chose the former mostly because I expect the angle to have a fairly symmetrical posterior, which makes a gaussian prior a reasonable choice.  Choosing a prior for the unit vector that makes the posterior of the angle symmetrical seems a trickier task. It turns out that the data usually has a lot to say about the orientation angle, so as long as mode hopping is avoided its effect on inferences is much less problematic than the inclination.

Well, I’ve been more verbose than expected, so again I’ll stop the post halfway through. Next time I’ll take a selective look at the code and some results from the data set introduced last time.

 

Kinematics 1b – Velocity offsets finally

Now that I have some data in a form suitable for further analysis my next step is to estimate radial velocity offsets. Part of the metadata is a system redshift z taken from the MaNGA observation catalog, which in turn is derived from the NSA catalog. Most redshifts are from the SDSS legacy survey, and usually but not always the spectroscopic target is close to the system nucleus, which is generally at the IFU center. What I actually measure then are redshift offsets from the cataloged system redshift, and I expect those most of the time to be small. The algorithm I developed uses a straightforward, not quite brute force template matching procedure that I believe, without having seen the code, is similar to that used in the SDSS spectro pipeline. This is a simpler task though because there’s no need to distinguish among stars, galaxies, and QSO’s and the range of redshifts to be probed is much smaller.

The templates I use are a set of 15 eigenspectra from a principal components analysis of ∼16,000 SDSS legacy survey galaxy spectra using an algorithm published by Tsalmantza and Hogg (2012). These are of some independent interest, but I will defer writing about them until a later post. The algorithm returns a single blended estimate for both stars and ionized gas. This differs from the MaNGA science team’s data analysis pipeline which produces separate estimates for stars and gas. From the small number of thumbnail size plots of velocity fields that have been published it’s evident that one or the other of these estimates is usually significantly noisier. Blended estimates should be cleaner provided ionized gas and stars are kinematically tightly coupled. This isn’t always true — in fact there is at least one published paper studying MaNGA galaxies with kinematically decoupled gas and stars (Jin et al. 2016). It also performs poorly if multiple velocity components are present, as in ongoing mergers, or if spectra are contaminated by foreground stars.

For completeness, and because the function is fairly small I reproduce the code here:

getdz <- function(gdat, lib, snrthresh=5, nlthresh=2000, dzlim=0.003, searchinterval=1e-4) {
  dims <- dim(gdat$flux)
  nr <- dims[1]
  nc <- dims[2]
  dz <- matrix(NA, nr, nc)
  dz.err <- matrix(NA, nr, nc)
  z <- gdat$meta$z
  lambda <- gdat$lambda
  fmla <- as.formula(paste("f ~", paste(names(lib)[-1], collapse="+")))
  fn <- function(x) {
    lambda.out <- lambda/(1+z+x)
    lib.out <- regrid(lambda.out, lib)
    lfit <- lm(fmla, data=lib.out, weights=iv)
    deviance(lfit)
  }
  fn_v <- Vectorize(fn)
  z_search <- seq(-dzlim, dzlim, by=searchinterval)

  for (i in 1:nr) {
    for (j in 1:nc) {
      if (is.na(gdat$snr[i,j]) || gdat$snr[i,j]<=snrthresh) next
        f <- gdat$flux[i, j, ]
        if (length(which(!is.na(f))) < nlthresh) next
          iv <- gdat$ivar[i, j, ]
          dev_grid <- fn_v(z_search)
          z0 <- z_search[which.min(dev_grid)]
          bestz <- Rsolnp::solnp(pars=z0, fun=fn, 
                                 LB=z0-searchinterval, UB=z0+searchinterval, 
                                 control=list(trace=0))
          dz[i,j] <- bestz$pars
          dz.err[i,j] <- sqrt(2./bestz$hessian)
    }
  }
  list(dz=dz, dz.err=dz.err)
}

I’ll review a few points about this function. The arguments gdat and lib are the IFU data described in the last post and a data frame with the rest frame template wavelengths and eigenspectra. I’ve found that sometimes large portions of spectra are masked by the DRP; often these are near the edge of the IFU and have very low signal to noise, so I set a minimum threshold for number of unmasked wavelength bins. The other arguments with default values just set reasonable limits for SNR, maximum redshift deltas, and grid size for preliminary search.

The function fn is the key section of code. Given the system redshift and a trial offset given in the function argument it calculates the galaxy restframe wavelengths, regrids the eigenspectra library to that vector of wavelengths, then fits it to the galaxy spectrum by weighted least squares and returns the deviance (weighted sum of squares). This function takes advantage of R’s rather peculiar scoping rules. When R encounters a name it checks the current environment for a value. If it finds one it uses it, otherwise it checks the parent environment, and if necessary the parent of the parent, etc. until it either finds the name or runs out of environments.

Just below the function definition I use the built in R function Vectorize, which takes a function that returns a single value and creates a new function that returns a vector. The brute force part of this code is a search over a uniformly spaced grid to isolate an interval containing the global minimum. This calls the vectorized version fn_v of fn, thus avoiding an explicit loop (which are generally best avoided in R). This also lets me write the grid search portion in two lines of code, which could have been condensed to one. Finally I use a general nonlinear optimization routine to refine the redshift offset estimate. I’ve found the function solnp in the independently developed Rsolnp package to be somewhat more robust than R’s built in options, but for this application it’s somewhat of an overkill. The return value from the function is a list of redshift offsets and uncertainties estimated from the local curvature. Here by the way is another R peculiarity. The value returned by a function is the last expression evaluated, which in this case is just the creation of a named list. Although there is a built in function return() nobody seems to quite know what it actually does and it’s rarely necessary to use it.

This function has considerable room for efficiency improvements. For one thing this task is embarrassingly parallel since each spaxel/fiber is evaluated independently, so this could easily be broken into chunks and fed to multiple cores when available. Also, the built in R function lm() for linear modeling does more than necessary and is somewhat slower than just doing the matrix algebra. So this function may change in the future.

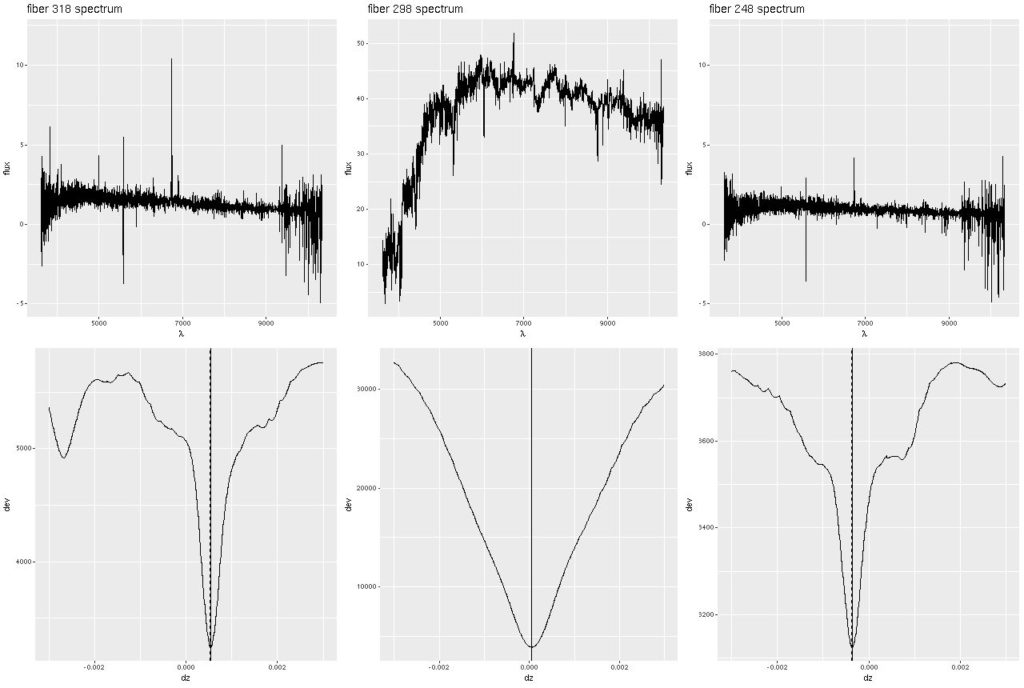
Let’s take a look at a few examples. I modified the code to return the grid of deviance values for a single input spectrum. For this illustration I took the spectra from the eastern-most, central, and western-most fiber/pointing combinations from the stacked RSS data. The spectra are shown in the top row, with the run of deviance values with redshift offset in the bottom. Note there are many local minima in the deviance plots for the two corner spectra, which have very low S/N. This is probably due to accidental alignments of noise spikes with features in the eigenspectra rather than actual overlapping component populations. Somewhat surprisingly though the valleys in the vicinity of the global optima are even more steep sided than that for the central fiber, so the redshift offsets are quite well constrained. The presence of local optima is problematic for most nonlinear optimizers, which is why I use a brute force search to isolate global optima.

dzexamp Deviance vs. delta z for 3 fiber/pointing combinations
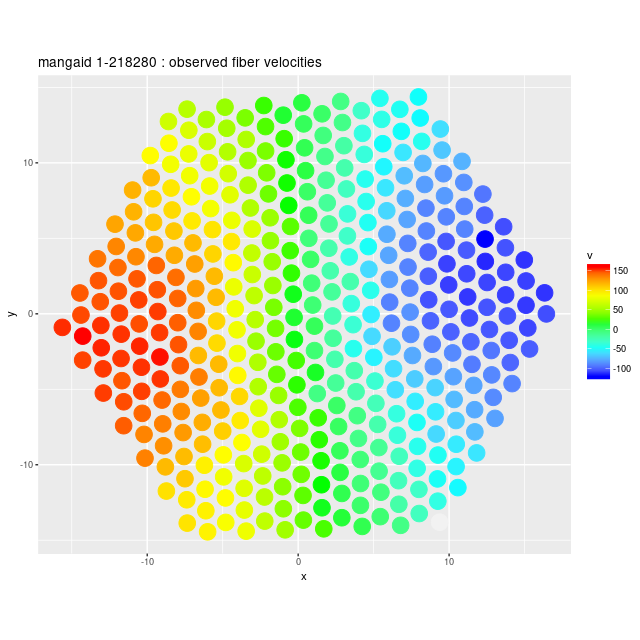
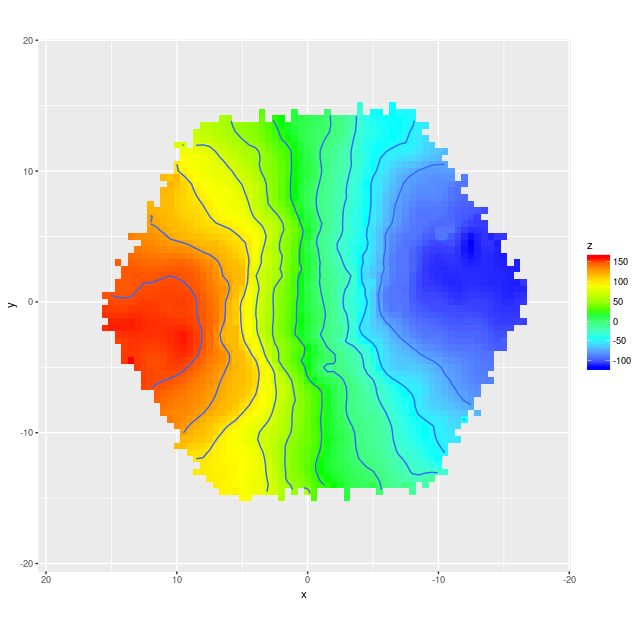
Next are the full velocity fields, first from the stacked RSS data and below it from the data cube. I set a signal to noise threshold of 3 for these, which seems optimistic but is usually OK for extracting velocities. The symbols in the first graph aren’t quite to scale — the fiber positions actually overlap somewhat. In the second graph contour lines are separated by 25 km/sec.

Experts in data visualization generally frown on the use of rainbows, but I think they’re OK for this one specific application. In my shared code I define

rainbow <- c("blue", "cyan", "green", "yellow", "red")  

as the set of additive and subtractive primary colors from blue through red. In ggplot2 plots of continuous variables this gets expanded to a fairly perceptually uniform spectrum optimized for display on a monitor.
vf-8942-12702 Example velocity field

vf_8942-12702-cube Example velocity field from data cube
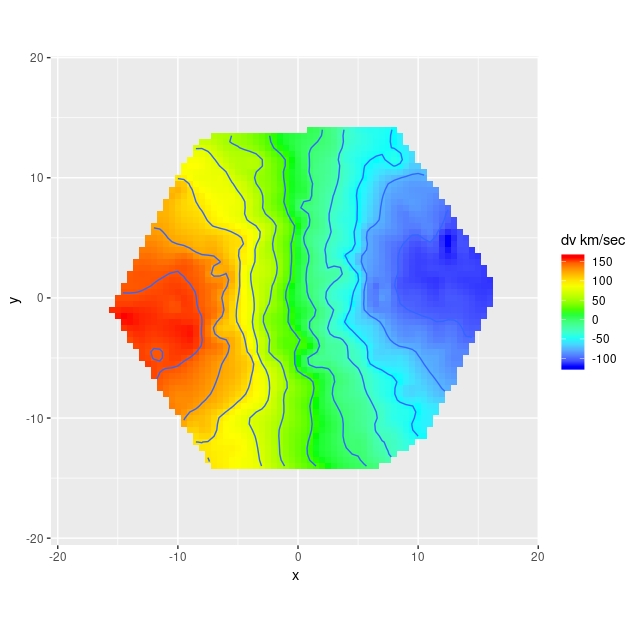
I’m going to take a little closer look at the comparison between the RSS derived velocity field and the one from the cube. First I use the function interp from the package akima to interpolate the RSS data onto the same 74×74 grid as the data cube. The code to do that and display the results is:

> allok <- complete.cases(dv.stack)
> dv.interp <- akima::interp(x=gdat.stack$xpos[allok], y=gdat.stack$ypos[allok], z=dv.stack[allok], xo=-3600*gdat.cube$xpos, yo=3600.*gdat.cube$ypos, linear=FALSE)
> ggimage(dv.interp$z, dv.interp$x, dv.interp$y, col=rainbow, addContour = T, binwidth = 25, legend="dv km/sec")
vf_8942-12702-rss-interp
Interpolated velocity field from RSS data

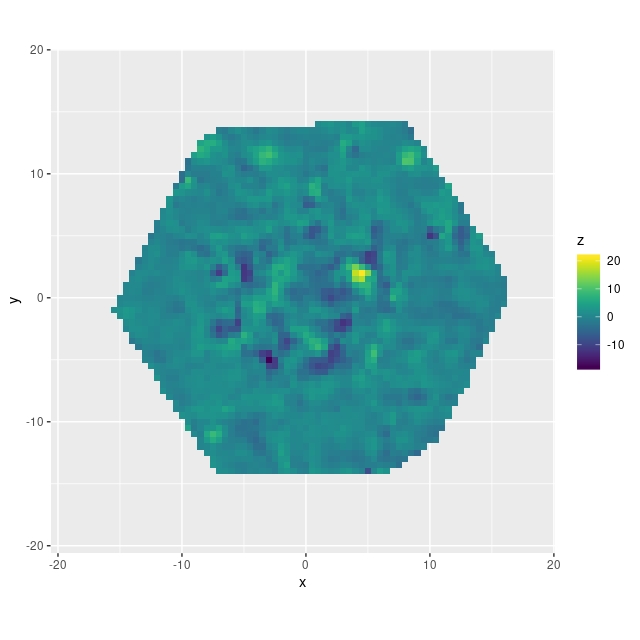
These look pretty similar. Taking the difference:

vfdiff_8942-12702-rsscube
Velocity difference: interpolated RSS – cube

There’s some possible structure here — there’s an irregular ring of negative velocity differences punctuated with a small area of positive difference. It’s a little hard to relate these to features in the galaxy (and I’d like to develop better tools for this), but comparing to the SDSS supplied thumbnail with superposed IFU footprint the ring might correspond to the inner arms and perhaps where the bar meets the arms:

thumbnail for MaNGA plateifu 8942-12702

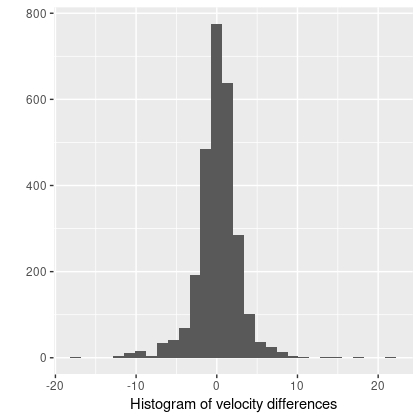
We’ll see later that arms and bars do measurably perturb velocities, and this suggests that different interpolation schemes might affect the fine details. But this is a higher order problem. Overall the velocity differences are symmetrically distributed around 0, with a standard deviation of just 2.7 km/sec and just slightly heavy tails:

hist_vdiff

Next up — doing something with velocity fields…

Kinematics 1a – Velocity offsets


I have been working mostly with spectroscopic data from SDSS-IV [MaNGA](http://www.sdss.org/dr14/manga/) since its first public release in 2016. The first few releases include little in the way of value-added data beyond calibrated spectra and some metadata taken mostly from the [NASA-Sloan Atlas](http://nsatlas.org/). In particular no kinematic measurements are provided, which are essential to most analyses. In the next several posts I’m going to write about estimating and using the first moment of the line of sight velocity distributions (LOSVD), that is velocity offsets from the system velocity. Keep in mind that estimating the moments of the LOSVD was the original objective of Cappellari and Emsellem’s `ppxf`, and anyone professionally engaged with the data should be using it or a similar tool that has passed peer review. But, since this is a hobby I developed my own tools. All software needed to replicate the examples posted here is available on my github repository at .

The first step in any data analysis is to acquire some data, and SDSS makes this really easy. The base URL for MaNGA data in DR14, which is still the current release at the time of writing, is . You drill down two levels deeper to download individual files. An observation is uniquely identified by a plate and IFU number, which are combined to make a plateifu id. Objects on the other hand are assigned a unique mangaid, which might be associated with multiple plateifu’s if observations are repeated. I’m going to work with the observation having plateifu 8942-12702 in the next several posts, which is in the directory 8942/stack. Calibrated data products come in two basic flavors: “row stacked spectra” (RSS) files and data cubes. Both types are available with either linear or logarithmically spaced wavelength bins — since convolution is an essential step in most analyses I work with the logarithmically spaced files, which have equal velocity widths of \( c \Delta \log_{10}(\lambda) \ln(10) \approx 69 \) km/sec per wavelength bin. The files I’ll work with are [manga-8942-12702-LOGCUBE.fits.gz](https://data.sdss.org/sas/dr14/manga/spectro/redux/v2_1_2/8942/stack/manga-8942-12702-LOGCUBE.fits.gz) and [manga-8942-12702-LOGRSS.fits.gz](https://data.sdss.org/sas/dr14/manga/spectro/redux/v2_1_2/8942/stack/manga-8942-12702-LOGRSS.fits.gz). This particular target is the nice barred spiral UGC 4300 (image credit SDSS):

![UGC 4300](http://skyserver.sdss.org/dr14/SkyServerWS/ImgCutout/getjpeg?TaskName=Skyserver.Chart.Image&ra=124.003321406132&dec=27.0758846629965&scale=0.4&width=512&height=512&opt=GL&query=&Grid=on&Label=on)

Browser based downloads are fine to get a file or two, but for bulk access it’s easiest to use a tool like `wget` or `rsync`. This is documented at . A small shell script helps automate the process:

“`{bash}
#! /bin/bash
wget -nv -nc -r -nH -nd -P. \
-i $1 \
-B http://data.sdss.org/sas/dr14/manga/spectro/redux/v2_1_2/

“`

This reads from a text file with the remainder of the path to the files to be downloaded listed one per line, fetches the files from the Science Archive Server, and stores them in the current working directory.

Next we need to get the data into R’s workspace. For this I use the R package [FITSio](https://cran.r-project.org/package=FITSio), which is the only package I’ve found for reading FITS files. While not as complete or polished as `astropy`’s FITS module it’s fine for reading in binary data tables. We also need some metadata from the MaNGA catalog, which is described [here](http://www.sdss.org/dr14/manga/manga-data/catalogs/). I have created a flat data table from the catalog and stored it in the R data file [drpcat.rda](https://github.com/mlpeck/vrot_stanmodels/blob/master/drpcat.rda) containing the R object `drpcat`. With the source files sourced into the R session the command to read a data cube is

“`{R}
gdat.cube <- readcube("manga-8942-12702-LOGCUBE.fits", drpcat) ``` For any reader unfamiliar with R syntax the symbol `<-` is the assignment operator (don't ask), so this line is just assigning the value returned by `readcube()` to the variable `gdat.cube`, which... ```{R} > str(gdat.cube)
List of 13
$ meta :List of 10
..$ mangaid : chr “1-218280”
..$ plateifu: chr “8942-12702”
..$ ra : num 124
..$ dec : num 27.1
..$ l : num 196
..$ b : num 29.6
..$ ebv : num 0.0367
..$ z : num 0.0255
..$ zdist : num 0.0254
..$ cpix : num [1:2] 38 38
$ xpos : num [1:74] 0.00514 0.005 0.00486 0.00472 0.00458 …
$ ypos : num [1:74] -0.00514 -0.005 -0.00486 -0.00472 -0.00458 …
$ lambda: num [1:4563(1d)] 3622 3622 3623 3624 3625 …
$ ra.f : num [1:74, 1:74] 124 124 124 124 124 …
$ dec.f : num [1:74, 1:74] 27.1 27.1 27.1 27.1 27.1 …
$ flux : num [1:74, 1:74, 1:4563] NA NA NA NA NA NA NA NA NA NA …
$ ivar : num [1:74, 1:74, 1:4563] NA NA NA NA NA NA NA NA NA NA …
$ snr : num [1:74, 1:74] NA NA NA NA NA NA NA NA NA NA …
$ gimg : num [1:74, 1:74] 0 0 0 0 0 0 0 0 0 0 …
$ rimg : num [1:74, 1:74] 0 0 0 0 0 0 0 0 0 0 …
$ iimg : num [1:74, 1:74] 0 0 0 0 0 0 0 0 0 0 …
$ zimg : num [1:74, 1:74] 0 0 0 0 0 0 0 0 0 0 …
“`

is a large list containing another list with some metadata and a number of numerical arrays, some taken directly from the FITS file and some processed in various ways. I correct the fluxes and inverse variances for galactic foreground extinction and also check the `mask` array for spaxels that should be masked. These are set to `NA` in the `flux` and `ivar` arrays. For this observation using the largest, 127 fiber, IFU these are stored in 74 x 74 x 4563 arrays, with the number of wavelength bins equal to 4563. The 74 x 74 spaxel field is somewhat larger than the IFU footprint so only some spaxels have data — in this example just 3,049 out of 5,476, or about 56%.

RSS files are a little more complicated to work with. They contain one spectrum for each exposure and each fiber, while for every observation the IFU is dithered to 3 distinct positions. Therefore if there are Nexp total exposures there will be Nexp/3 exposures for each fiber/pointing combination. In the RSS FITS files the flux and other data are stored in 4563 x Nexp image arrays, but to use the data we need to identify the distinct fiber/pointing combinations and combine the data. This is complicated by the fact that it isn’t entirely clear how the rows are stacked — this varies between data sets, although the first 3Nfiber spectra appear always to comprise one complete set of 3 pointings. A further complication is that because of differential refraction the position on the sky seen by each fiber varies with wavelength and with exposure. I chose to gloss over that by taking the mean position (over each wavelength range)
as the fiber position for that exposure. I then do a k-nearest neighbor lookup to find the Nexp-1 neighbors of the first 3Nfiber exposures. Then, with a bit of rearranging of data I end up storing the flux and inverse variance measurements in 3Nfiber x Nexp/3 x 4563 arrays.

Now this isn’t what I really want. What I want is to combine the exposures for each fiber/pointing combination to get a single spectrum and inverse variance estimates. I call this a stacked data set, and I wrote separate functions to read and manipulate the RSS files and to stack the data. These could be combined of course; I really have no use for the RSS data itself. In any case the current workflow goes like

“`{R}
> gdat.rss <- readrss("manga-8942-12702-LOGRSS.fits", drpcat) > str(gdat.rss)
List of 7
$ meta :List of 10
..$ mangaid : chr “1-218280”
..$ plateifu: chr “8942-12702”
..$ nexp : num 9
..$ ra : num 124
..$ dec : num 27.1
..$ l : num 196
..$ b : num 29.6
..$ ebv : num 0.0367
..$ z : num 0.0255
..$ zdist : num 0.0254
$ lambda: num [1:4563] 3622 3622 3623 3624 3625 …
$ flux : num [1:381, 1:3, 1:4563] 1.913 0.861 2.618 -2.61 5.185 …
$ ivar : num [1:381, 1:3, 1:4563] 0.124 0.161 0.14 0.177 0.119 …
$ snr : num [1:381, 1:3] 2.28 2.2 2.42 2.71 2.76 …
$ xpos : num [1:381, 1:3] 6.67 7.89 5.37 2.78 4.13 …
$ ypos : num [1:381, 1:3] -12.6 -10.2 -10.4 -10.5 -12.7 …
> gdat.stack <- stackrss(gdat.rss) > str(gdat.stack)
List of 10
$ meta :List of 10
..$ mangaid : chr “1-218280”
..$ plateifu: chr “8942-12702”
..$ nexp : num 9
..$ ra : num 124
..$ dec : num 27.1
..$ l : num 196
..$ b : num 29.6
..$ ebv : num 0.0367
..$ z : num 0.0255
..$ zdist : num 0.0254
$ lambda: num [1:4563] 3622 3622 3623 3624 3625 …
$ flux : num [1:381, 1, 1:4563] -0.538 2.972 1.319 -0.642 1.778 …
$ ivar : num [1:381, 1, 1:4563] 0.396 0.383 0.403 0.436 0.388 …
$ snr : num [1:381, 1] 3.93 3.89 4.18 4.7 4.81 …
$ xpos : num [1:381] 6.67 7.88 5.36 2.78 4.12 …
$ ypos : num [1:381] -12.6 -10.2 -10.4 -10.5 -12.7 …
$ ra.f : num [1:381] 124 124 124 124 124 …
$ dec.f : num [1:381] 27.1 27.1 27.1 27.1 27.1 …
$ dz : NULL
“`
Now, I work almost exclusively with these stacked derivatives of the RSS files. The main reason is necessity: the Bayesian models I work with, especially for star formation history modeling, are extremely computationally expensive. These can take some 10’s of minutes per spectrum with a state of the art desktop PC even with a smaller number of samples than I’d like and some other compromises. At, say, 3 per hour analyzing ∼3000spectra would take about 42 days worth of CPU time, while the stacked RSS files have at most 381 spectra, making a single IFU’s analysis at most a 5 days project. Eliminating the compromises could increase execution time by factors of several, making even the latter analysis difficult for any reasonable size sample of galaxies.

There are some principled reasons as well to prefer the RSS files. The data cubes are generated from the RSS data via an interpolation scheme which can’t add to the information content but does introduce spatial covariance into any derived data. This should properly be modeled, but in practice usually isn’t — the MaNGA science team recommends inflating variance estimates by some factor. For many analyses it’s necessary to bin spaxels, and again the spatial covariance should properly be accounted for. The fiber spectra on the other hand can be treated as independent samples. The one significant disadvantage of working with the RSS data is that new visualization tools are needed. I’ve developed a number of such tools, and continue to work on them.

This post is longer than I originally intended, so I will save results for the next one and then move on to discussing one use of velocity data.