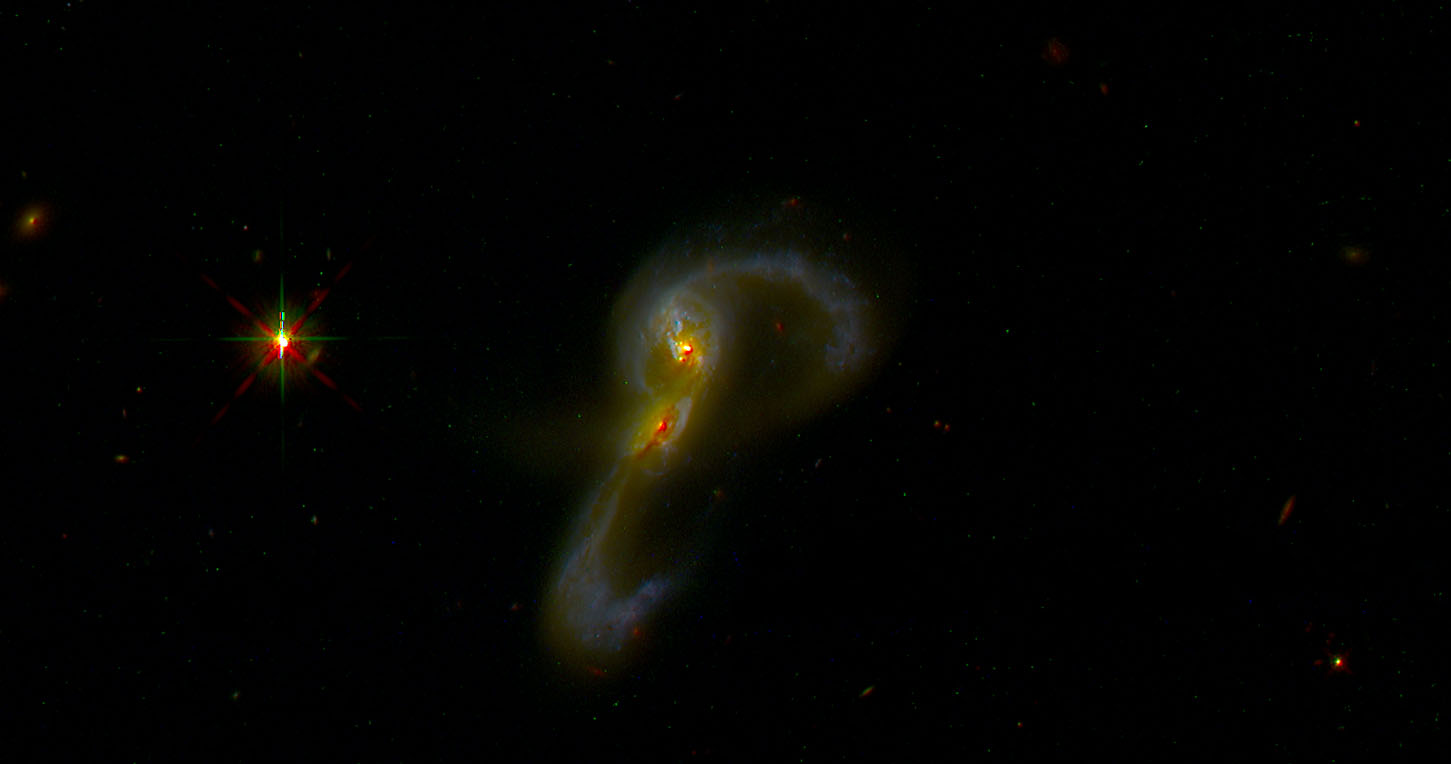
I’m returning now to the Leung et al. (2024, 2025) sample of post-starburst galaxies observed in MaNGA. I actually completed model runs for the entire sample some time ago, but it’s taken a while to examine the results and that is still underway. To summarize briefly the sample consists of 48 “central” (CPSB) and 41 “ring” (RPSB)1this classification scheme was proposed by Chen et al. 2019. See also Cheng et al. 2024. galaxies. I analyzed 1255 spectra from the CPSB sample and 2202 from the RPSBs. This was out of 5310 and 7755 spectra in the stacked RSS files that are the sources of my spectroscopic data. I generally tried to bin spectra to a minimum mean SNR of 8 per wavelength bin, although I sometimes accepted less. I excluded spectra that failed to meet whatever threshold I set as well as spectra with foreground star contamination: there were 1311 and 2311 binned spectra in the two subsamples, so I excluded 56 and 109 from analysis.
Some time ago while still running models for this sample I mentioned noticing a distinct tendency for model star formation rates to peak at right around 1 Gyr. Since then I’ve added measurements of the lookback time to maximum star formation rate, so I can now check if my visual impression was correct. And, as the graph below shows, it was! This displays on the left histograms of counts of lookback times to maximum SFR, and on the right empirical cumulative distribution functions for the two samples.
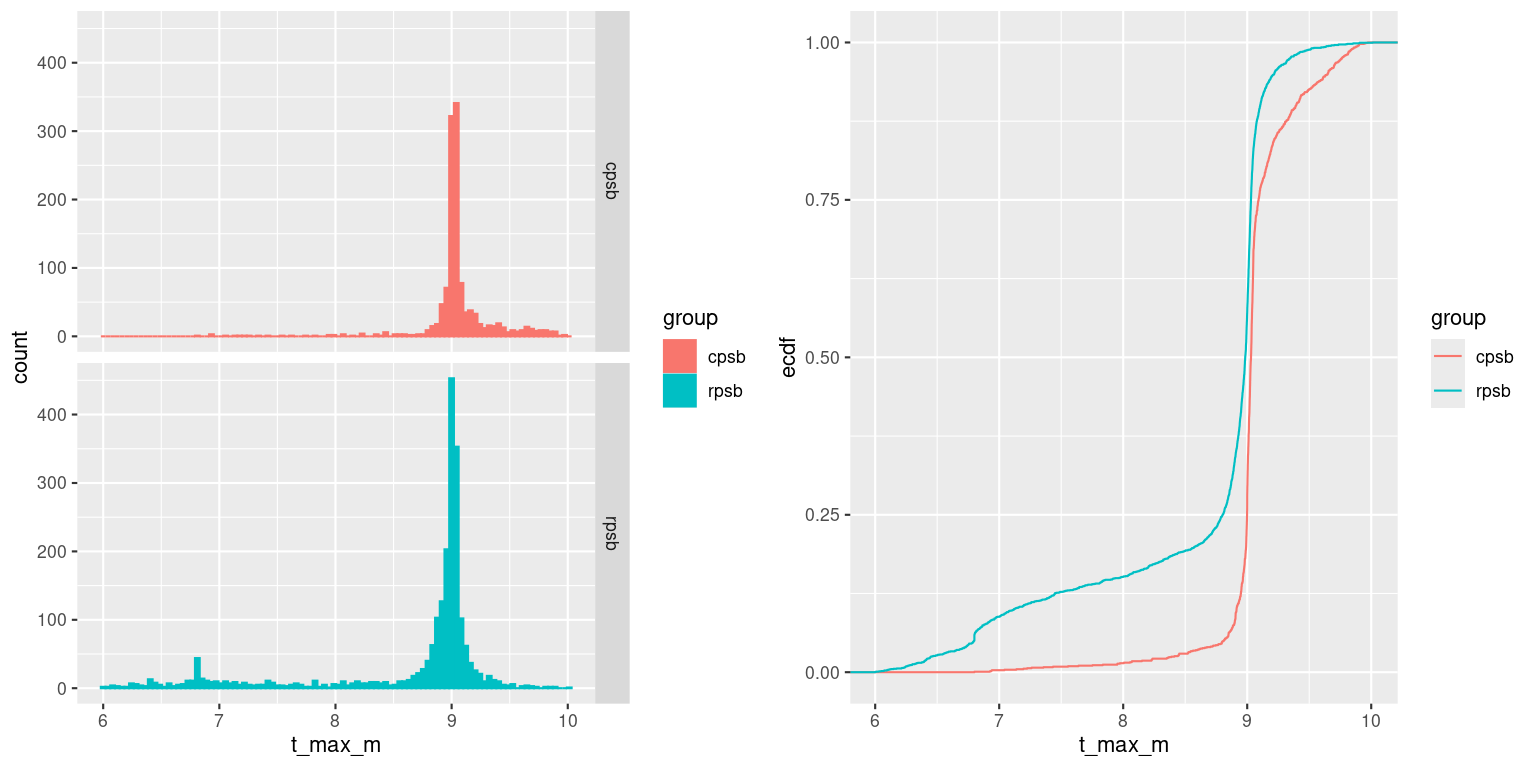
Clearly both have very strong peaks right around 1 Gyr, which again raises the question whether this is a sample selection effect or something in the models or SSP library that’s preferentially producing large contributions from a narrow age range. I’m still investigating this and will follow up in a future post. As a preliminary comment model runs with the BPASS library for a few galaxies show a similar tendency to have very strong peaks but at earlier ages of ~2 Gyr.
The other striking thing here is that the RPSBs have a long tail of more recent peaks: about 5% of the regions are still star forming (peak SFR at < 107 yr) and 15% peaked < 100 Myr ago, while < 2% of CPSB regions peak at < 100 Myr. Standard emission line diagnostics are consistent2these are based on [N II]/Hα vs [O III]/Hβ with Kauffmann’s “composite” region:
| No Em | Weak Em | SF | Comp | LI(n)ER | AGN | |
| CPSB | 6 | 62 | 1 | 9 | 16 | 6 |
| RPSB | 2 | 30 | 25 | 26 | 12 | 5 |
Regions with LINER and even AGN like emission line ratios aren’t necessarily centrally concentrated, so we can’t infer the presence of AGN from line ratios alone (there are known optical AGN in both samples however).
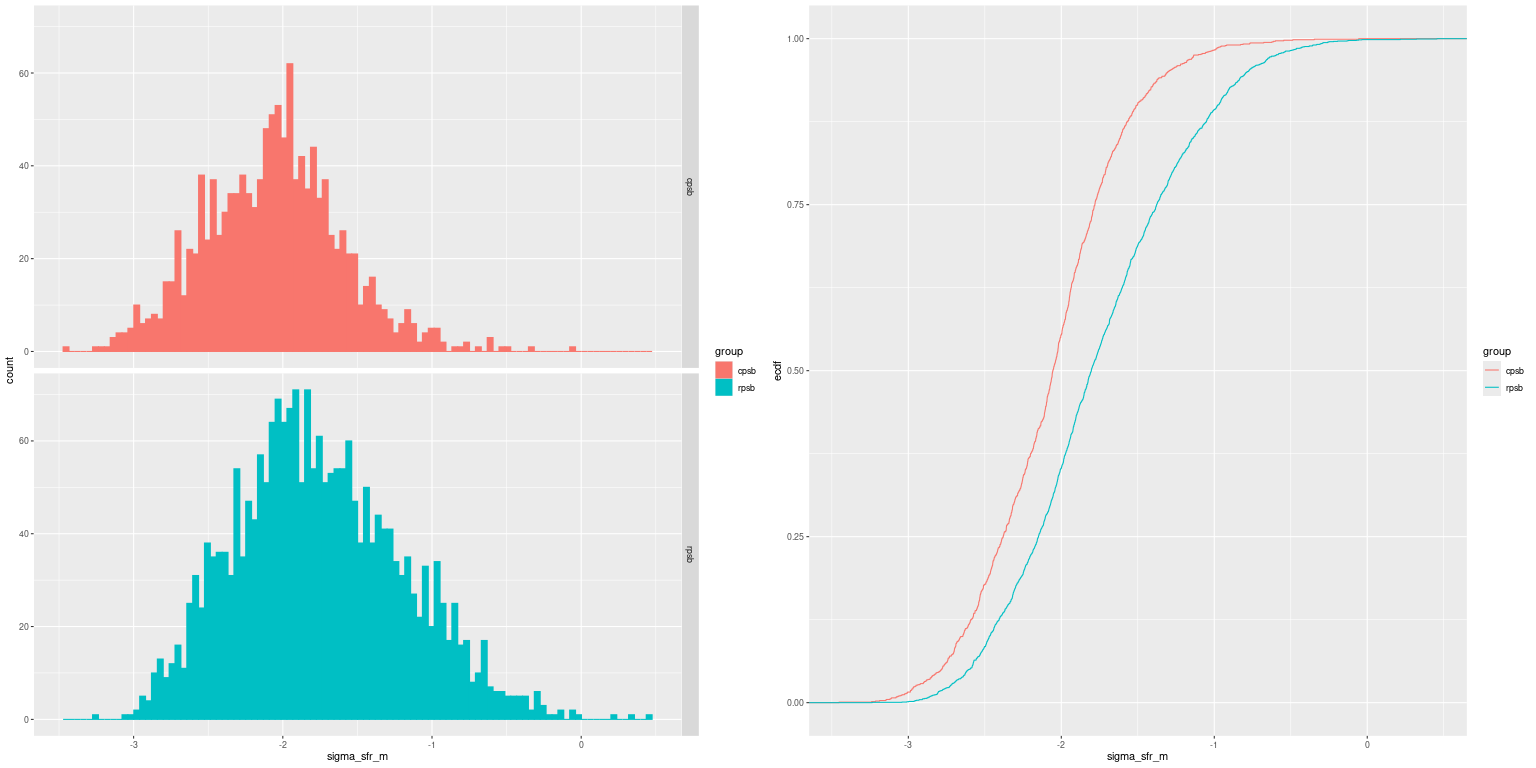
There are other population level differences as well. The RPSBs have higher (in distribution) star formation rate densities:
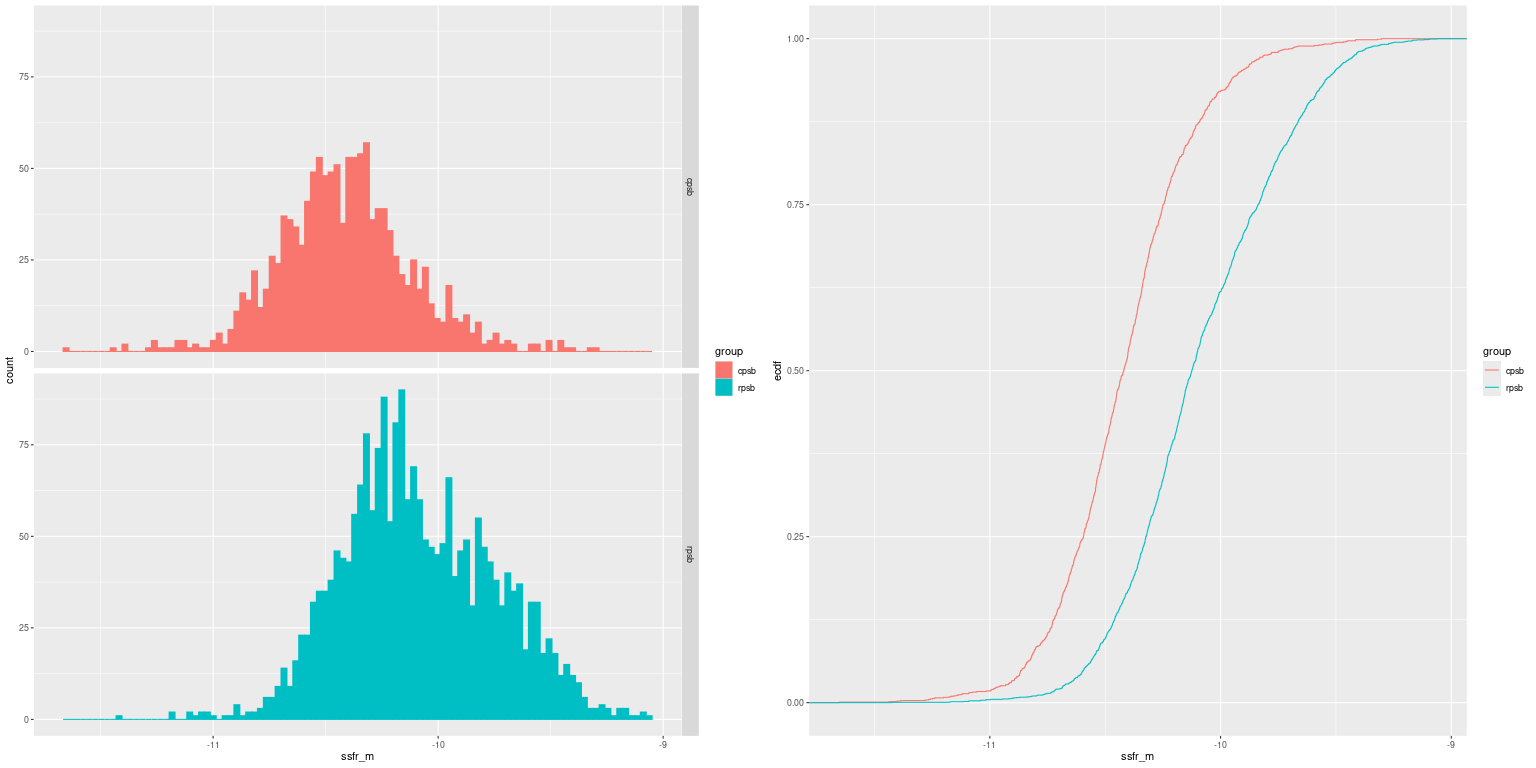
and specific star formation rates (both are 100 Myr averages):
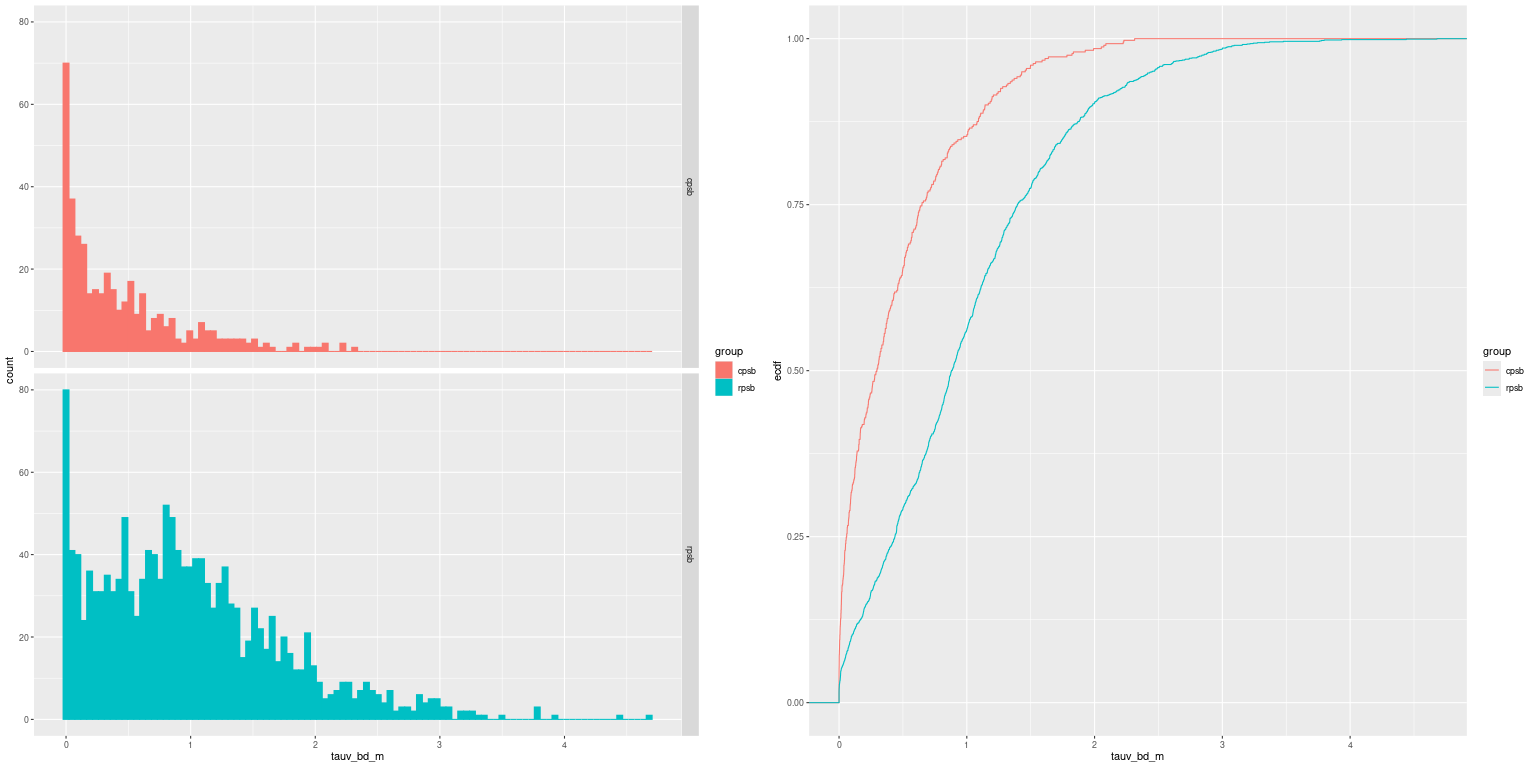
Limiting the samples to regions with firm emission line detections the RPSBs appear to be dustier:
and have slightly lower gas phase metallicity:
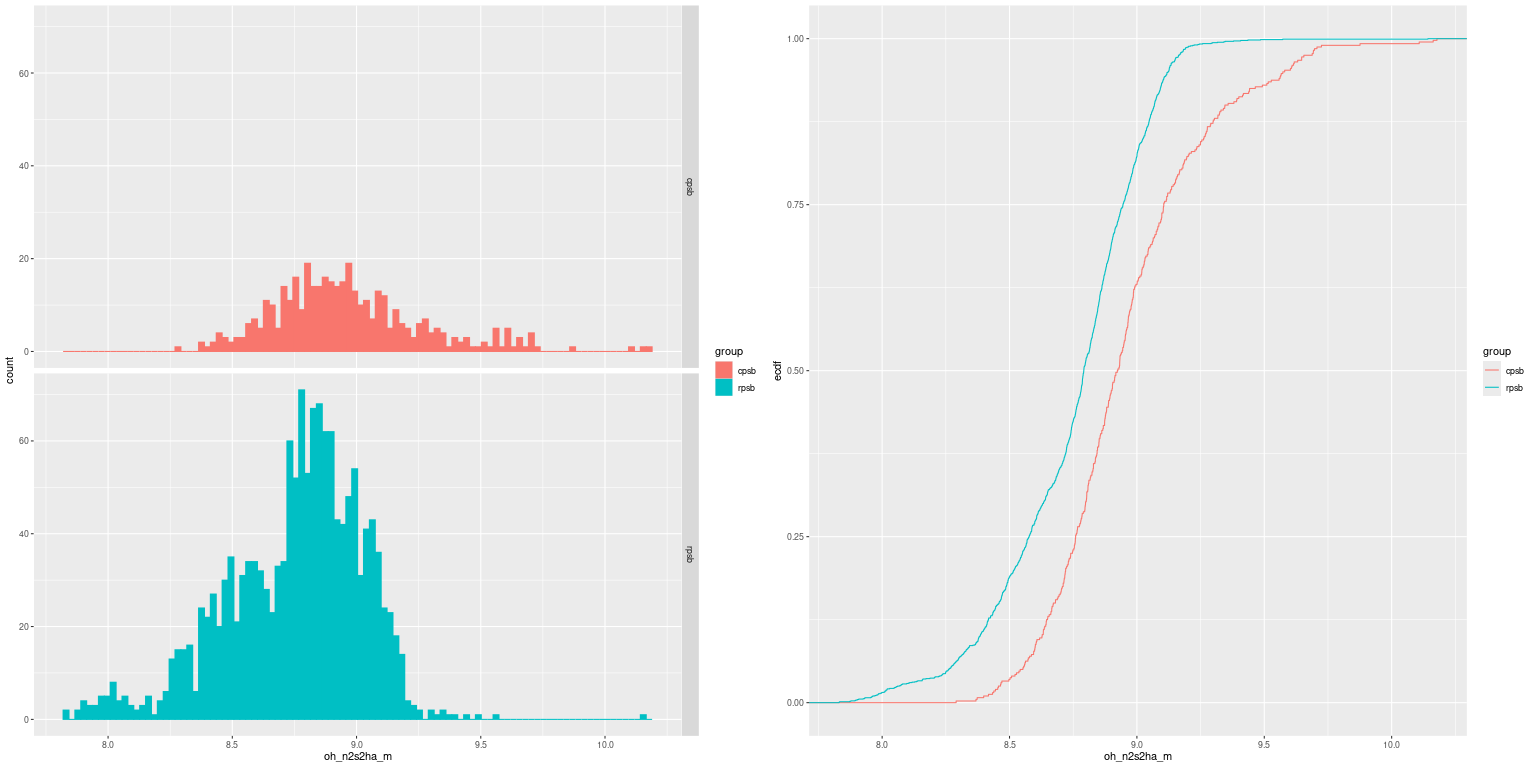
For what it’s worth a Kolmogorov-Smirnov test says all of these empirical CDFs are different at essentially arbitrary significance levels.
Turning to spatial variations of a few modeled quantities with projected radius for each galaxy and broken down by sample. First is lookback time to maximum SFR:
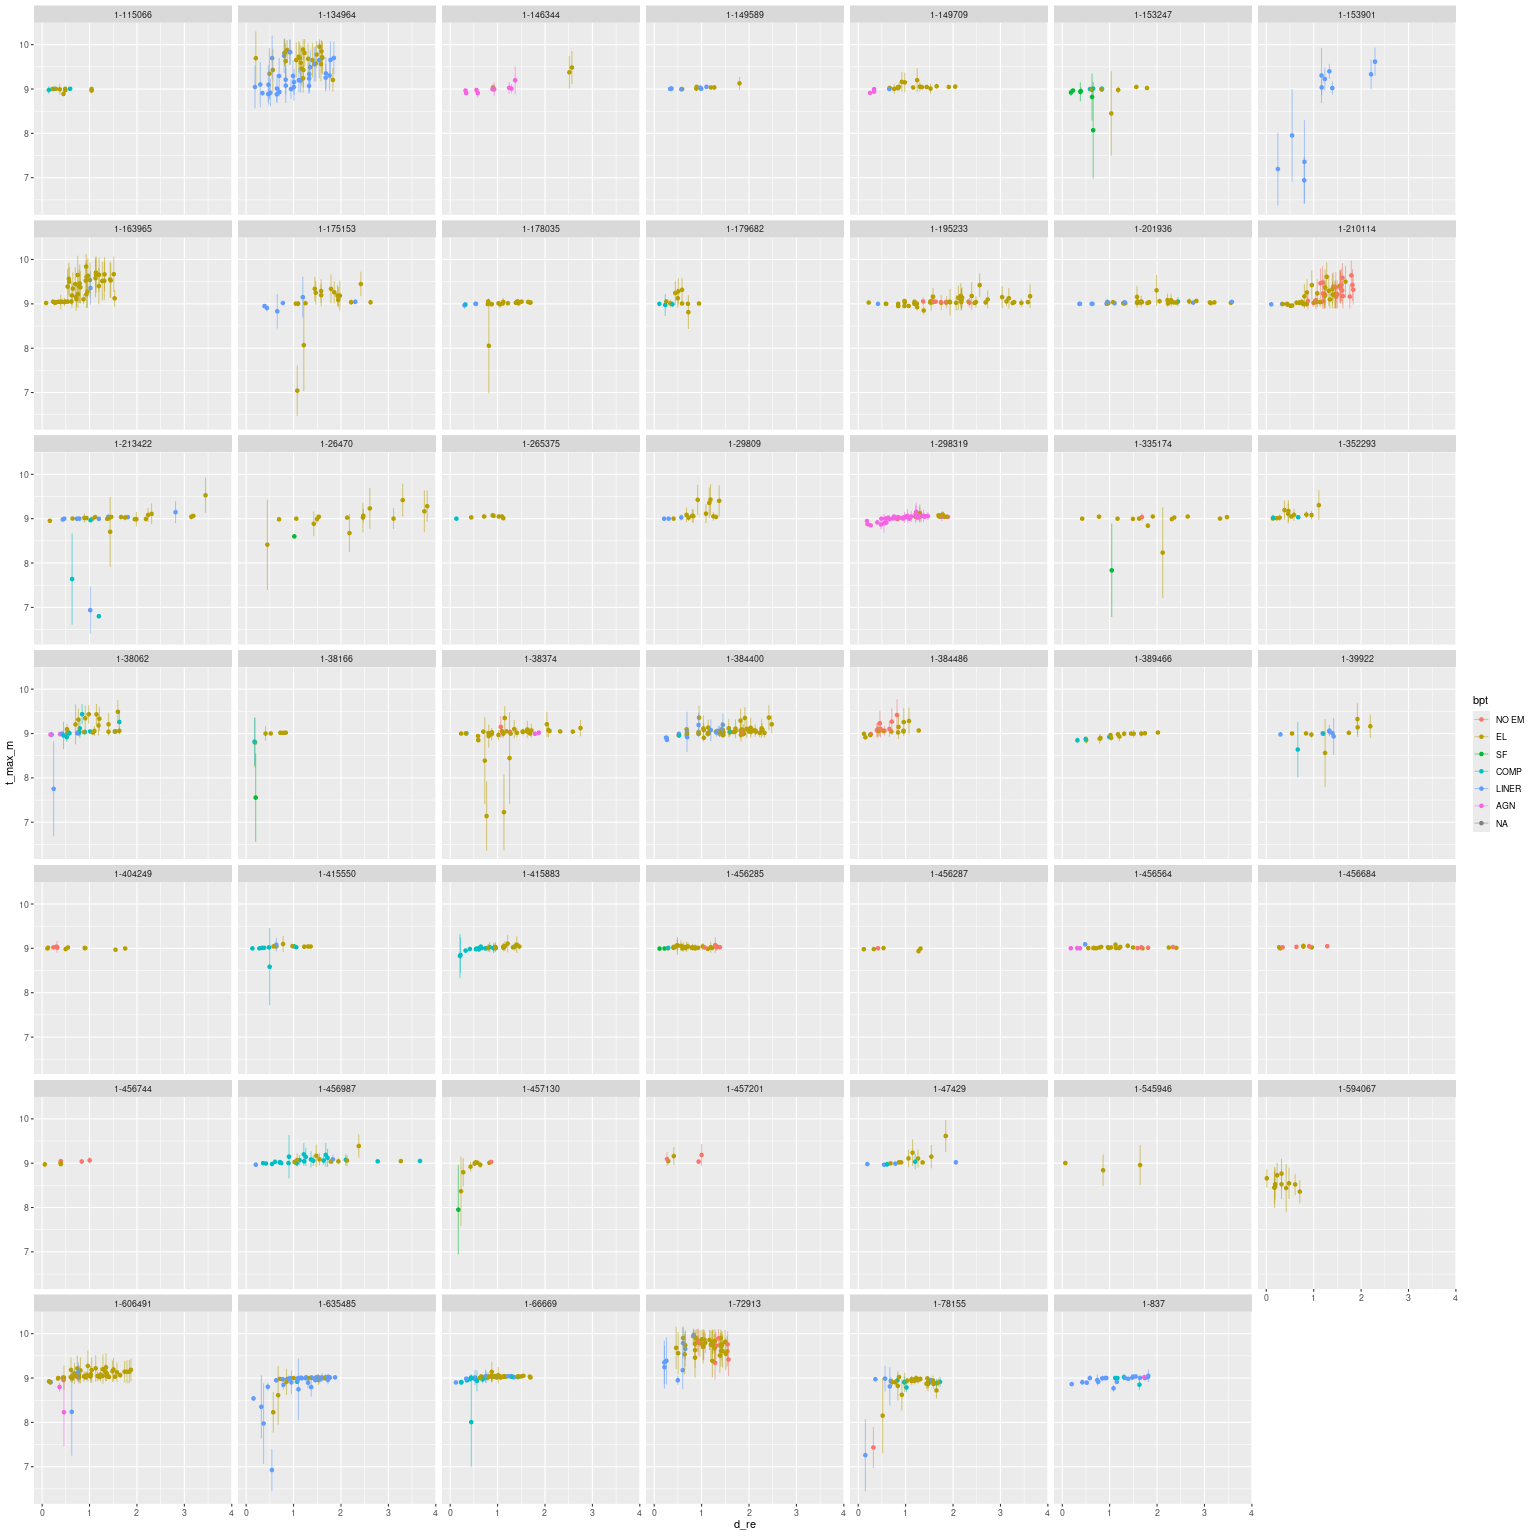
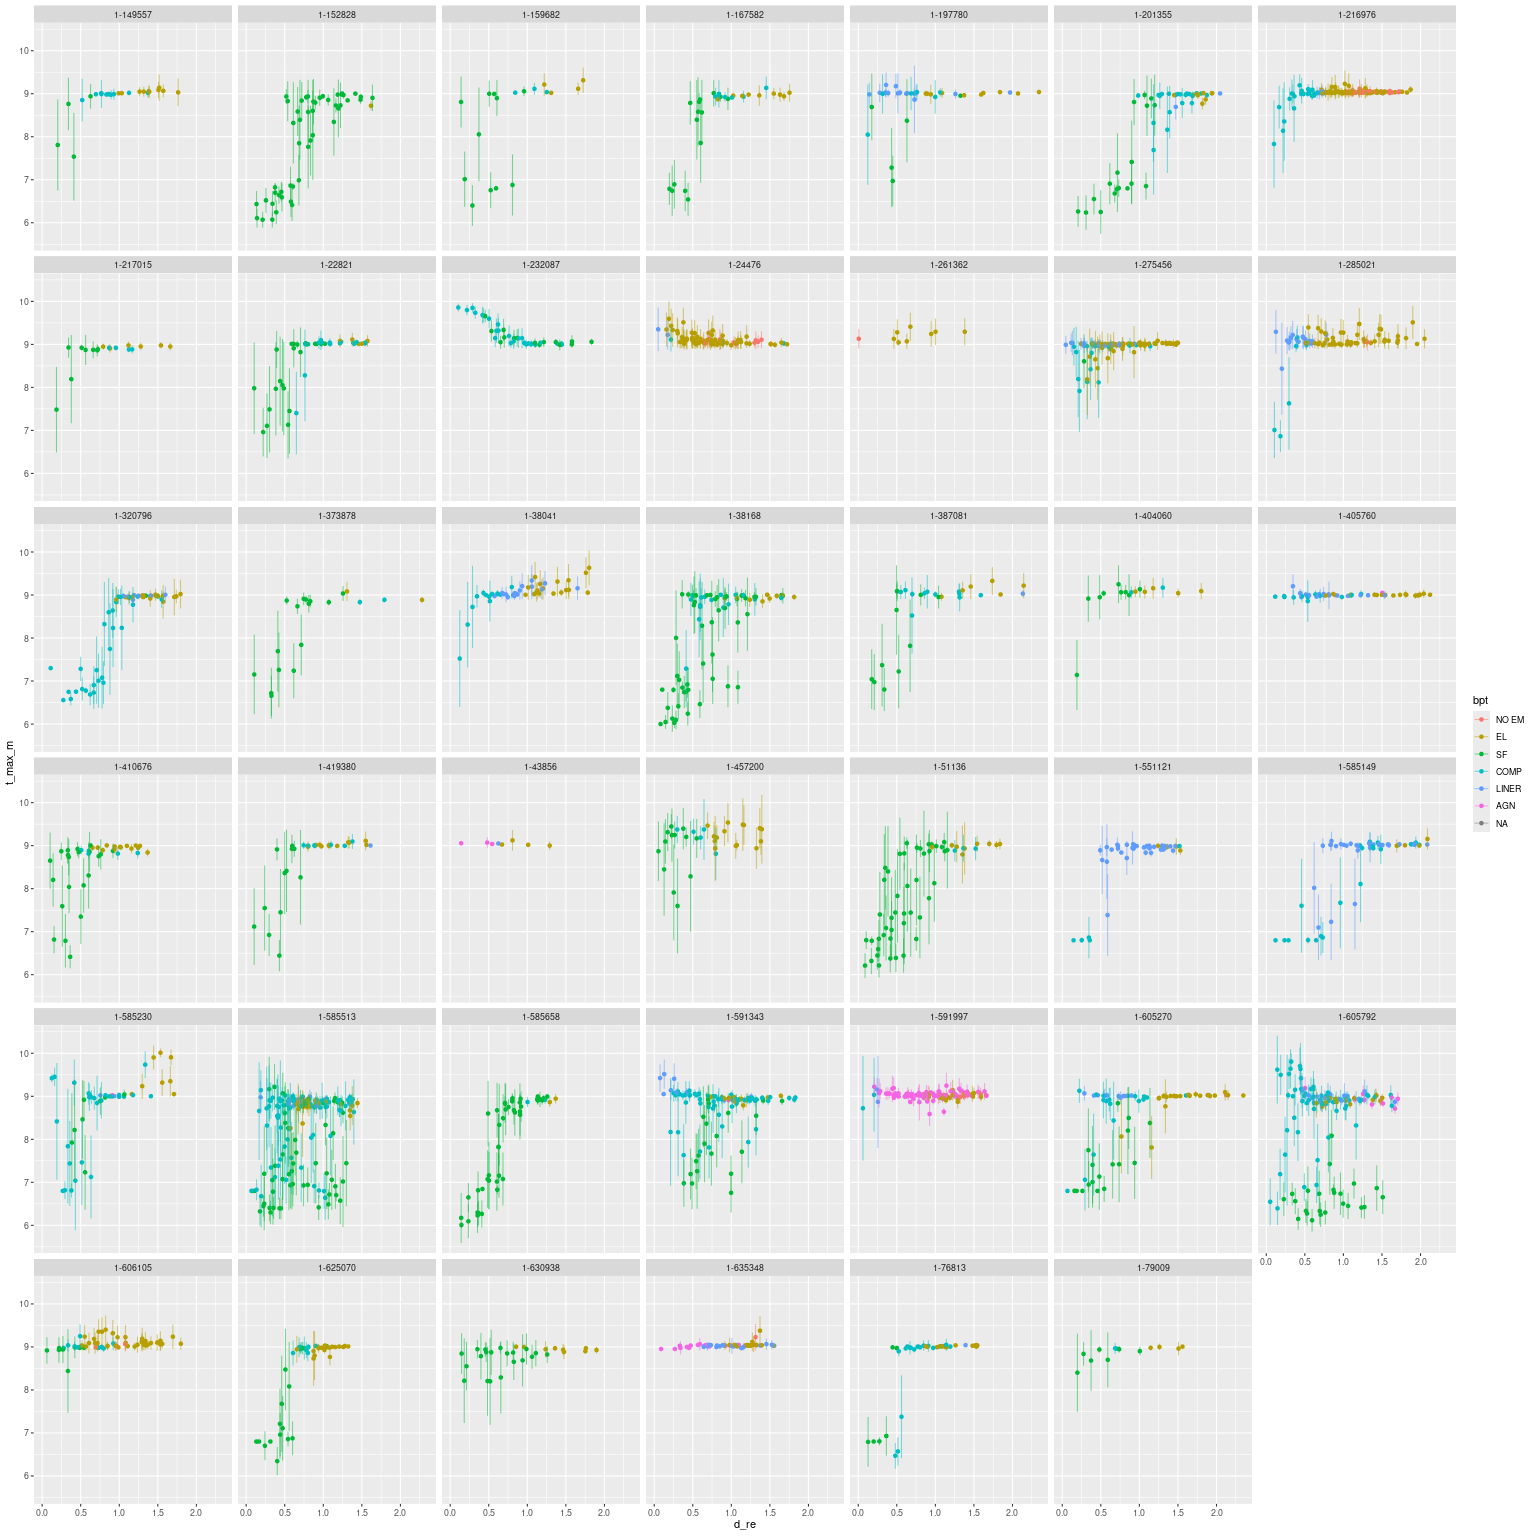
The CPSBs generally have relatively constant burst ages with projected radius, with a small number having positive gradients — one of the better examples being mangaid 1-635485 (plateifu 7965-1902; row 7, column 2 in the plot above) that I discussed in the previous post. None have negative gradients (center significantly older than farther out).
The RPSBs on the other hand have many examples with positive age gradients. There are also a number of examples of star forming regions interspersed with post-starburst. There’s just one clear example (mangaid 1-232087, plateifu 8152-3703) with a strongly negative age gradient. My models have an old and quiescently evolving central region with a post-starburst disk.
Star formation rate density:
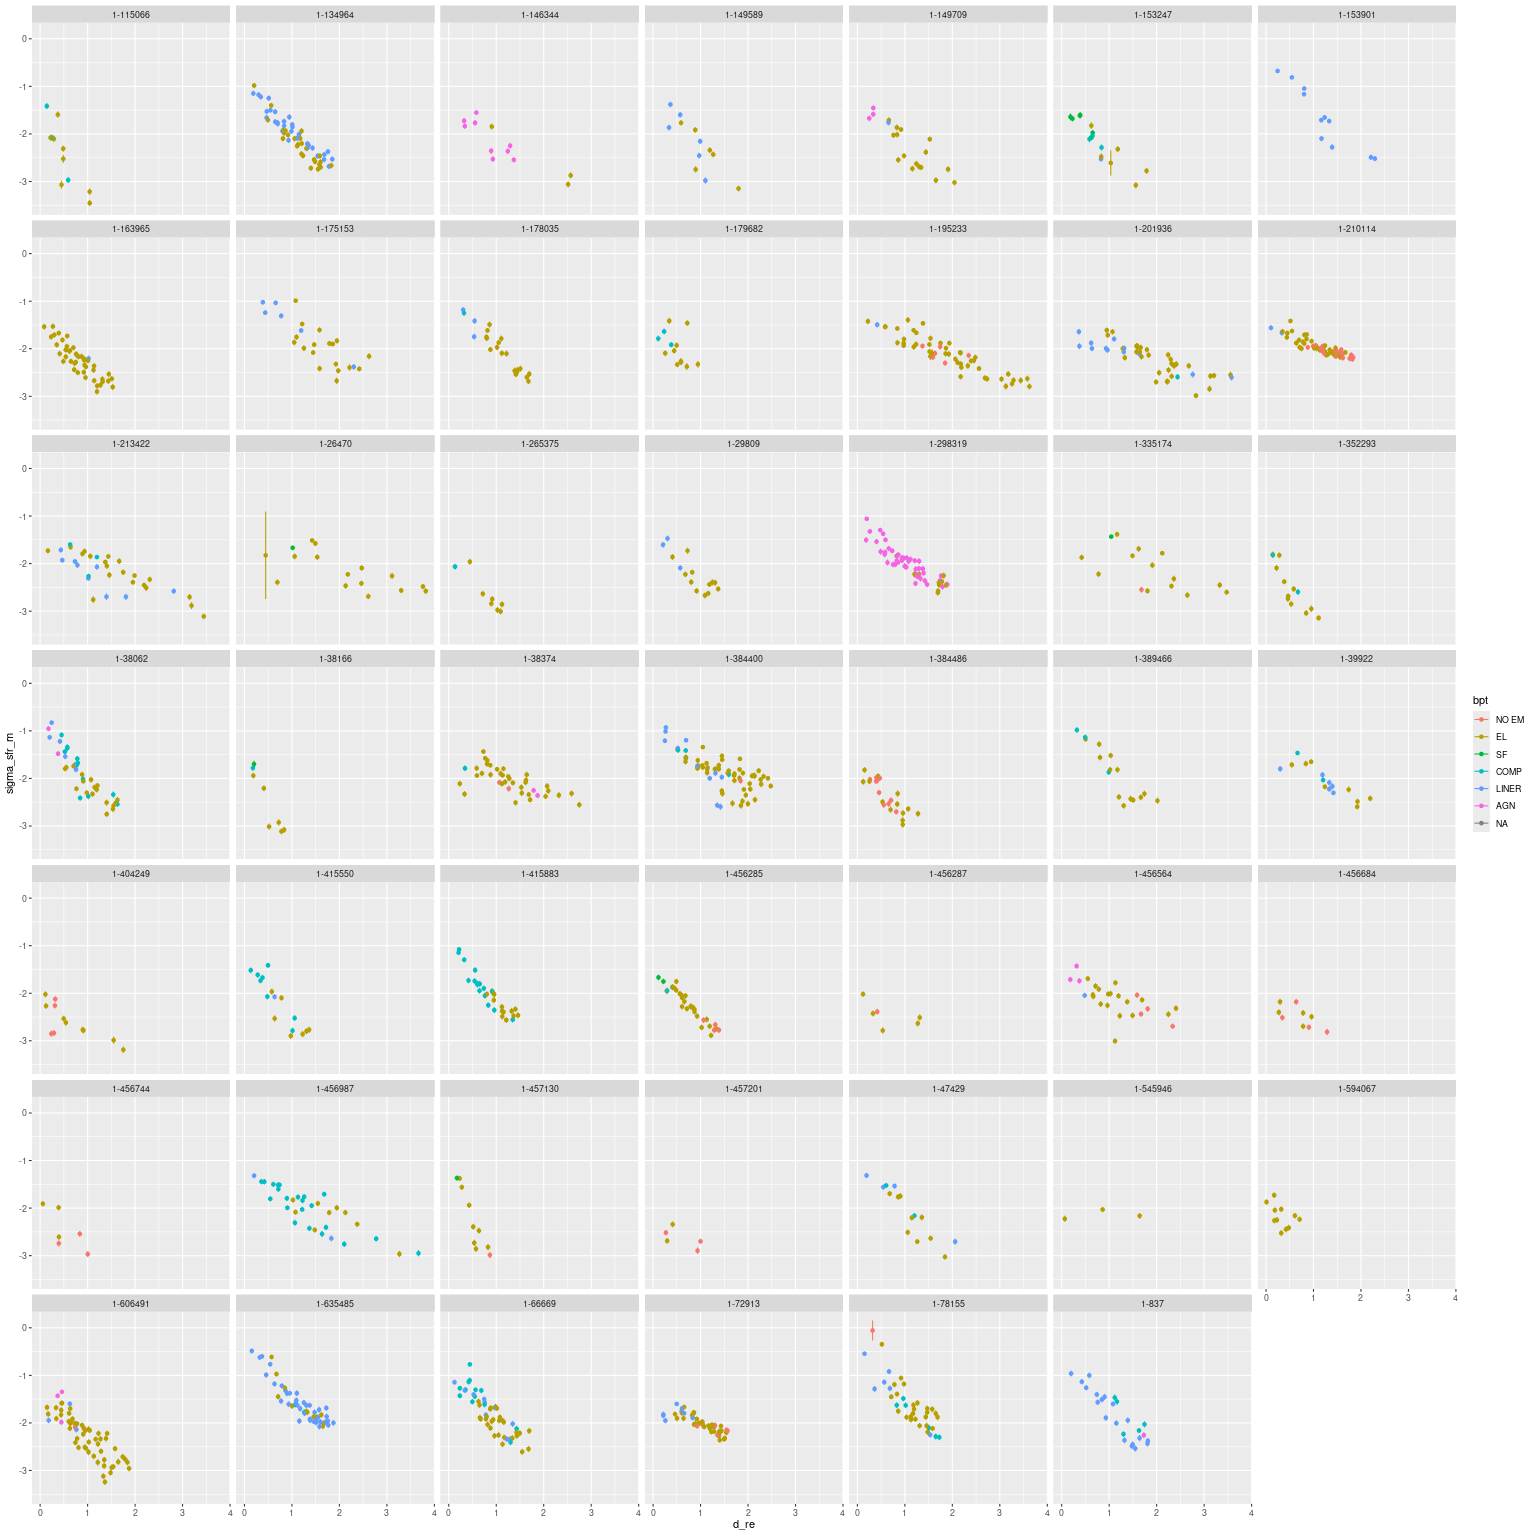
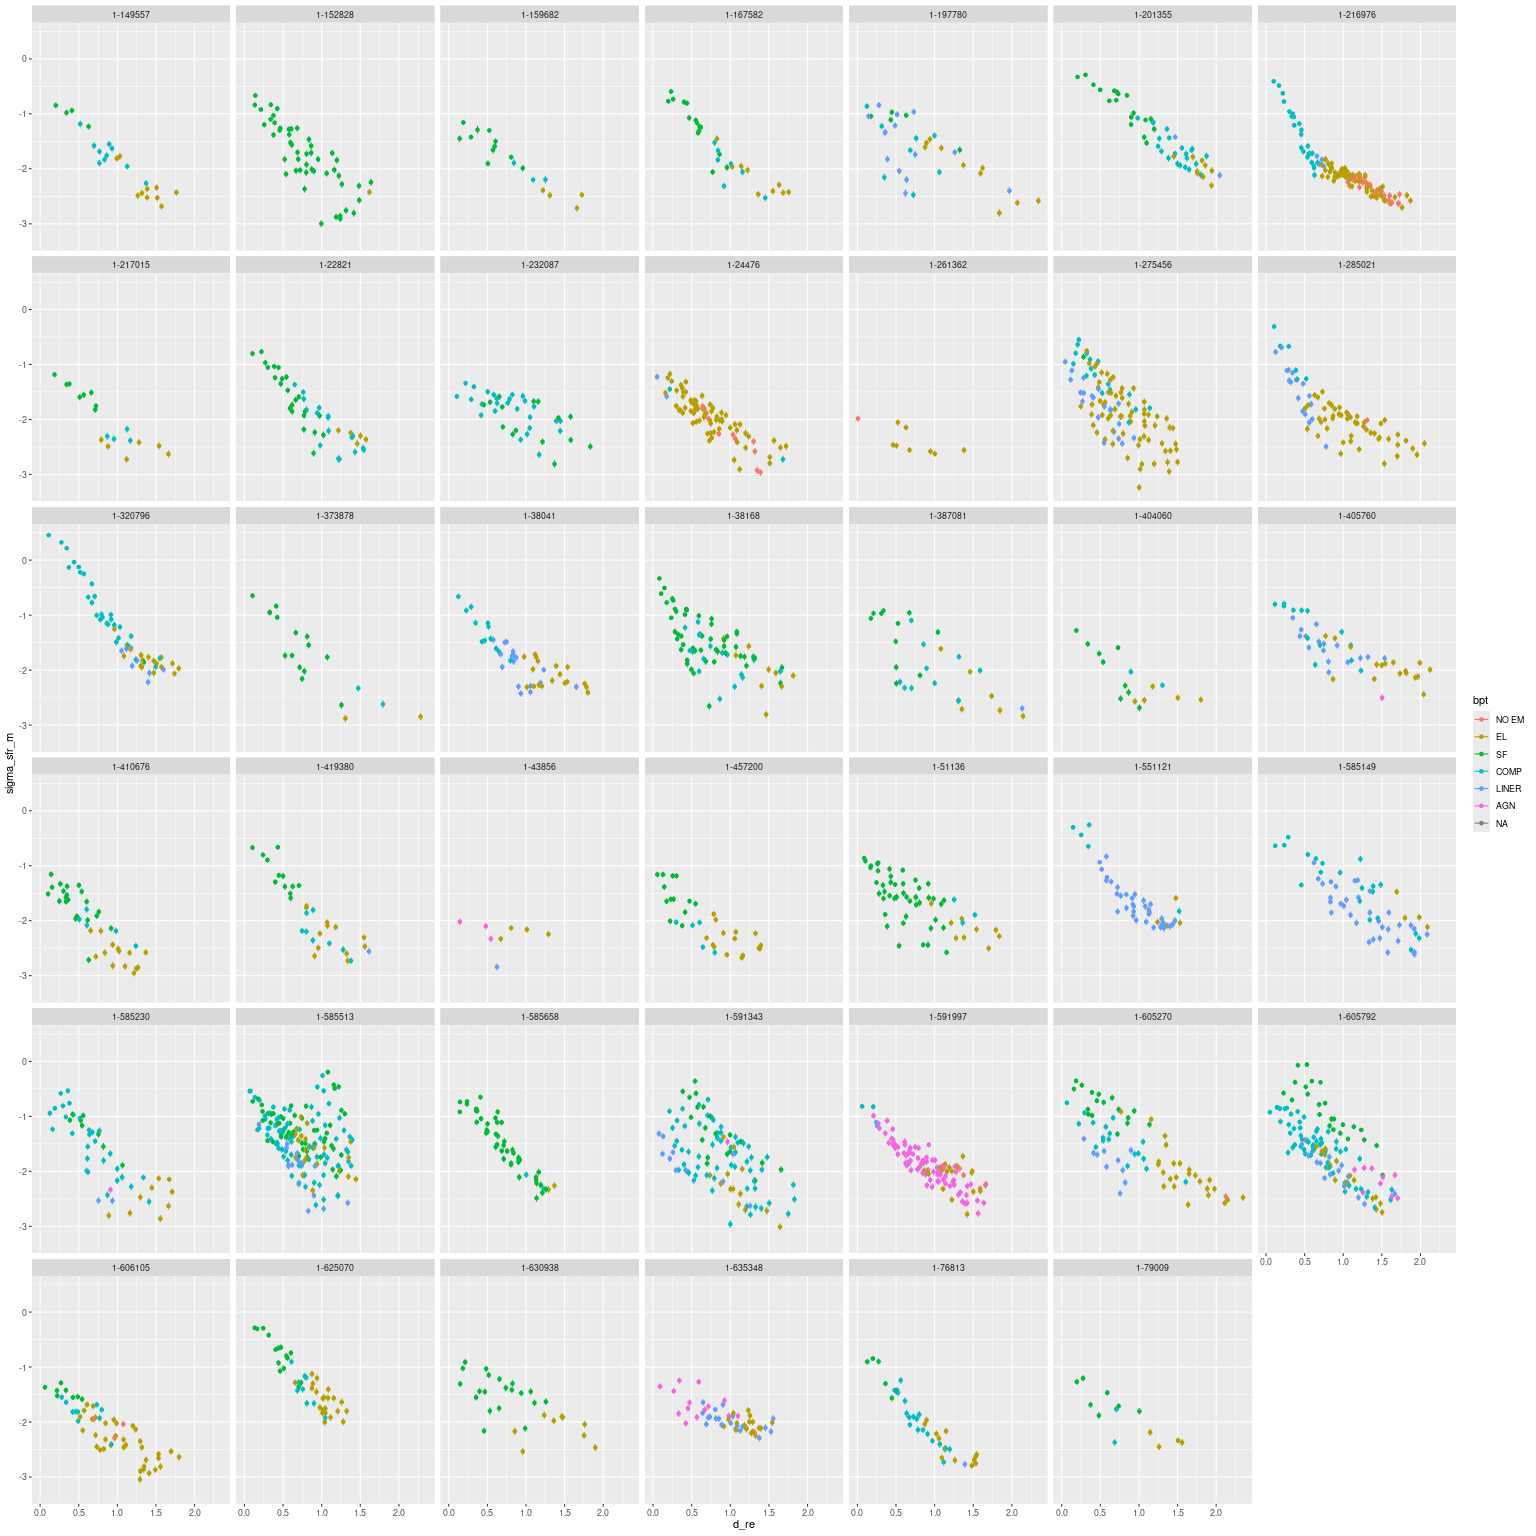
sSFR:
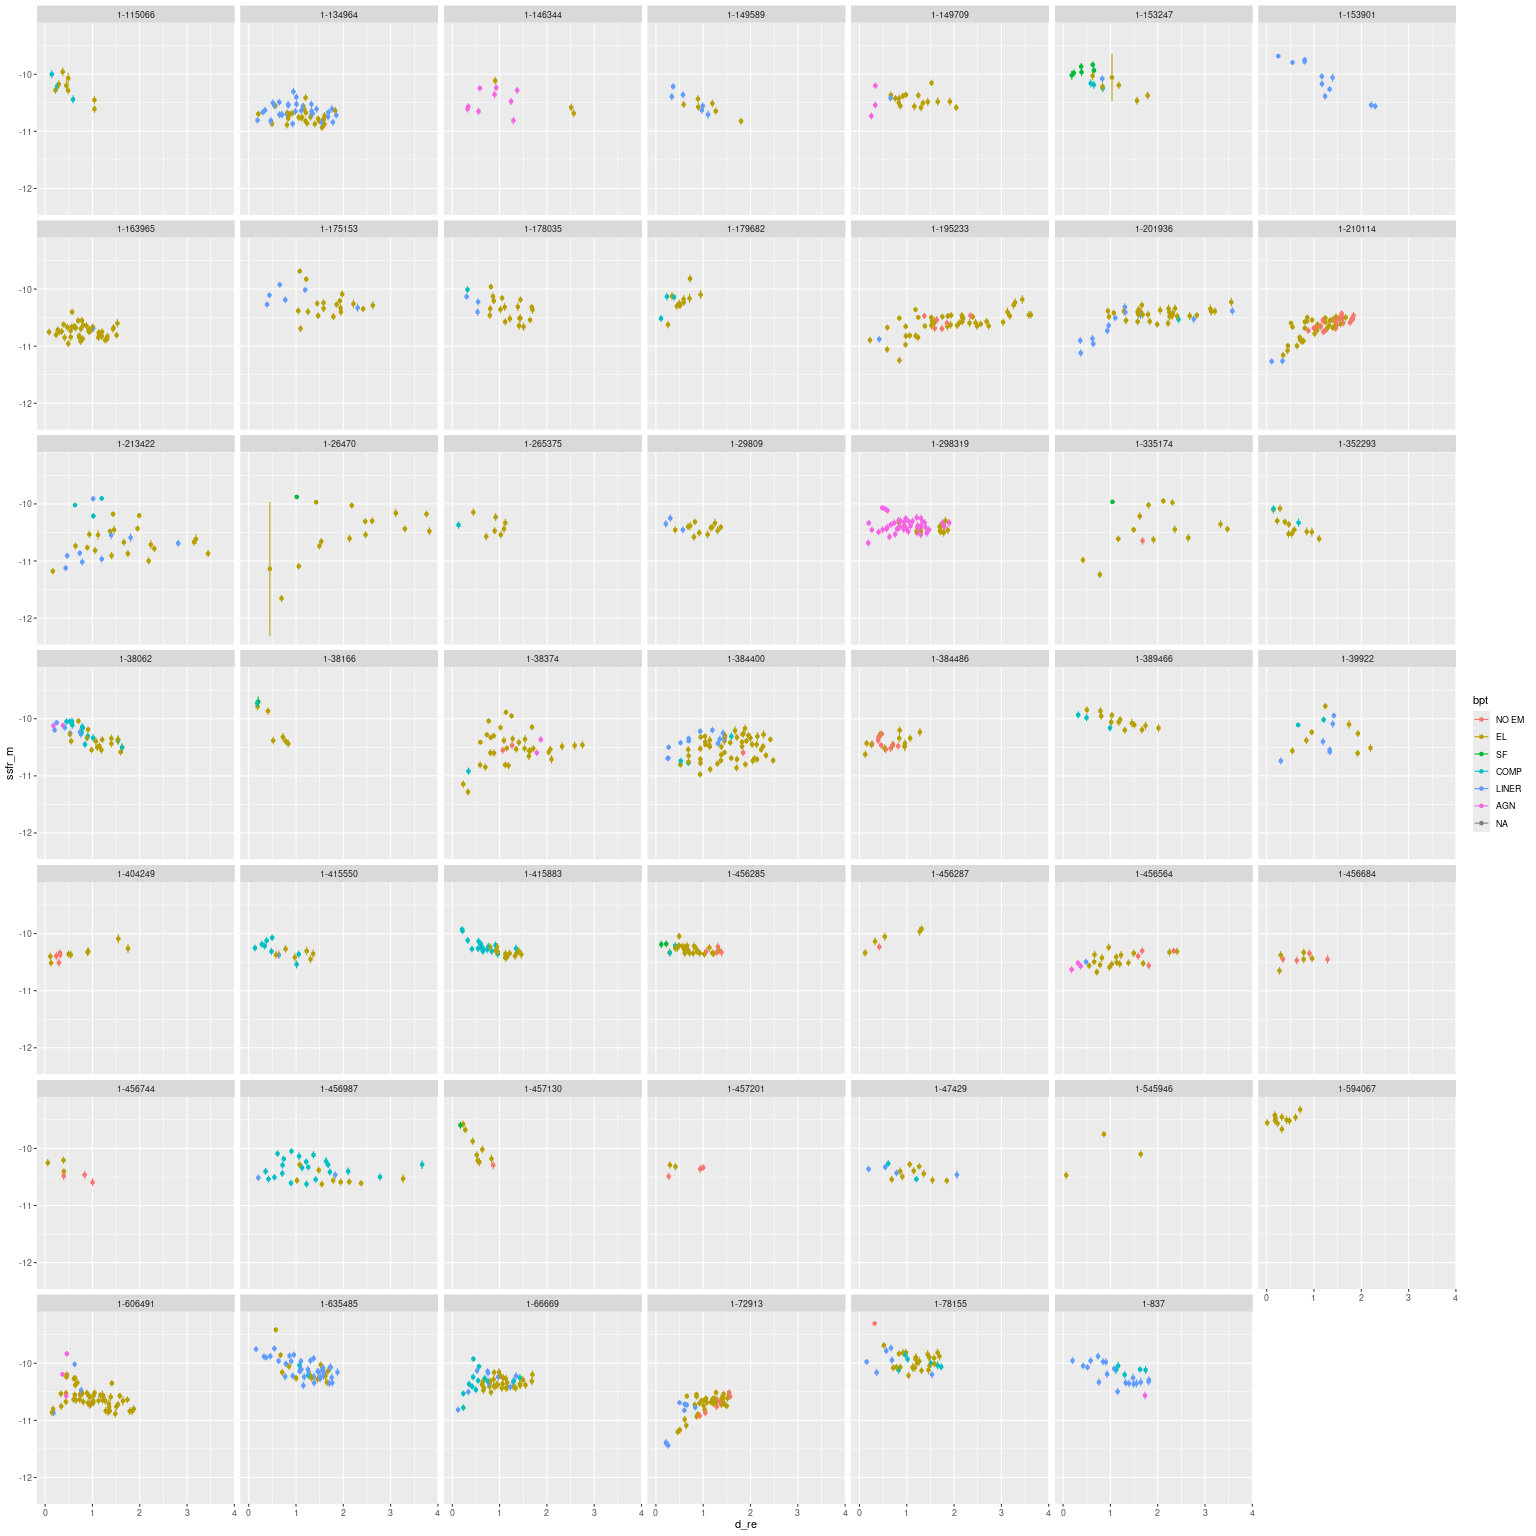
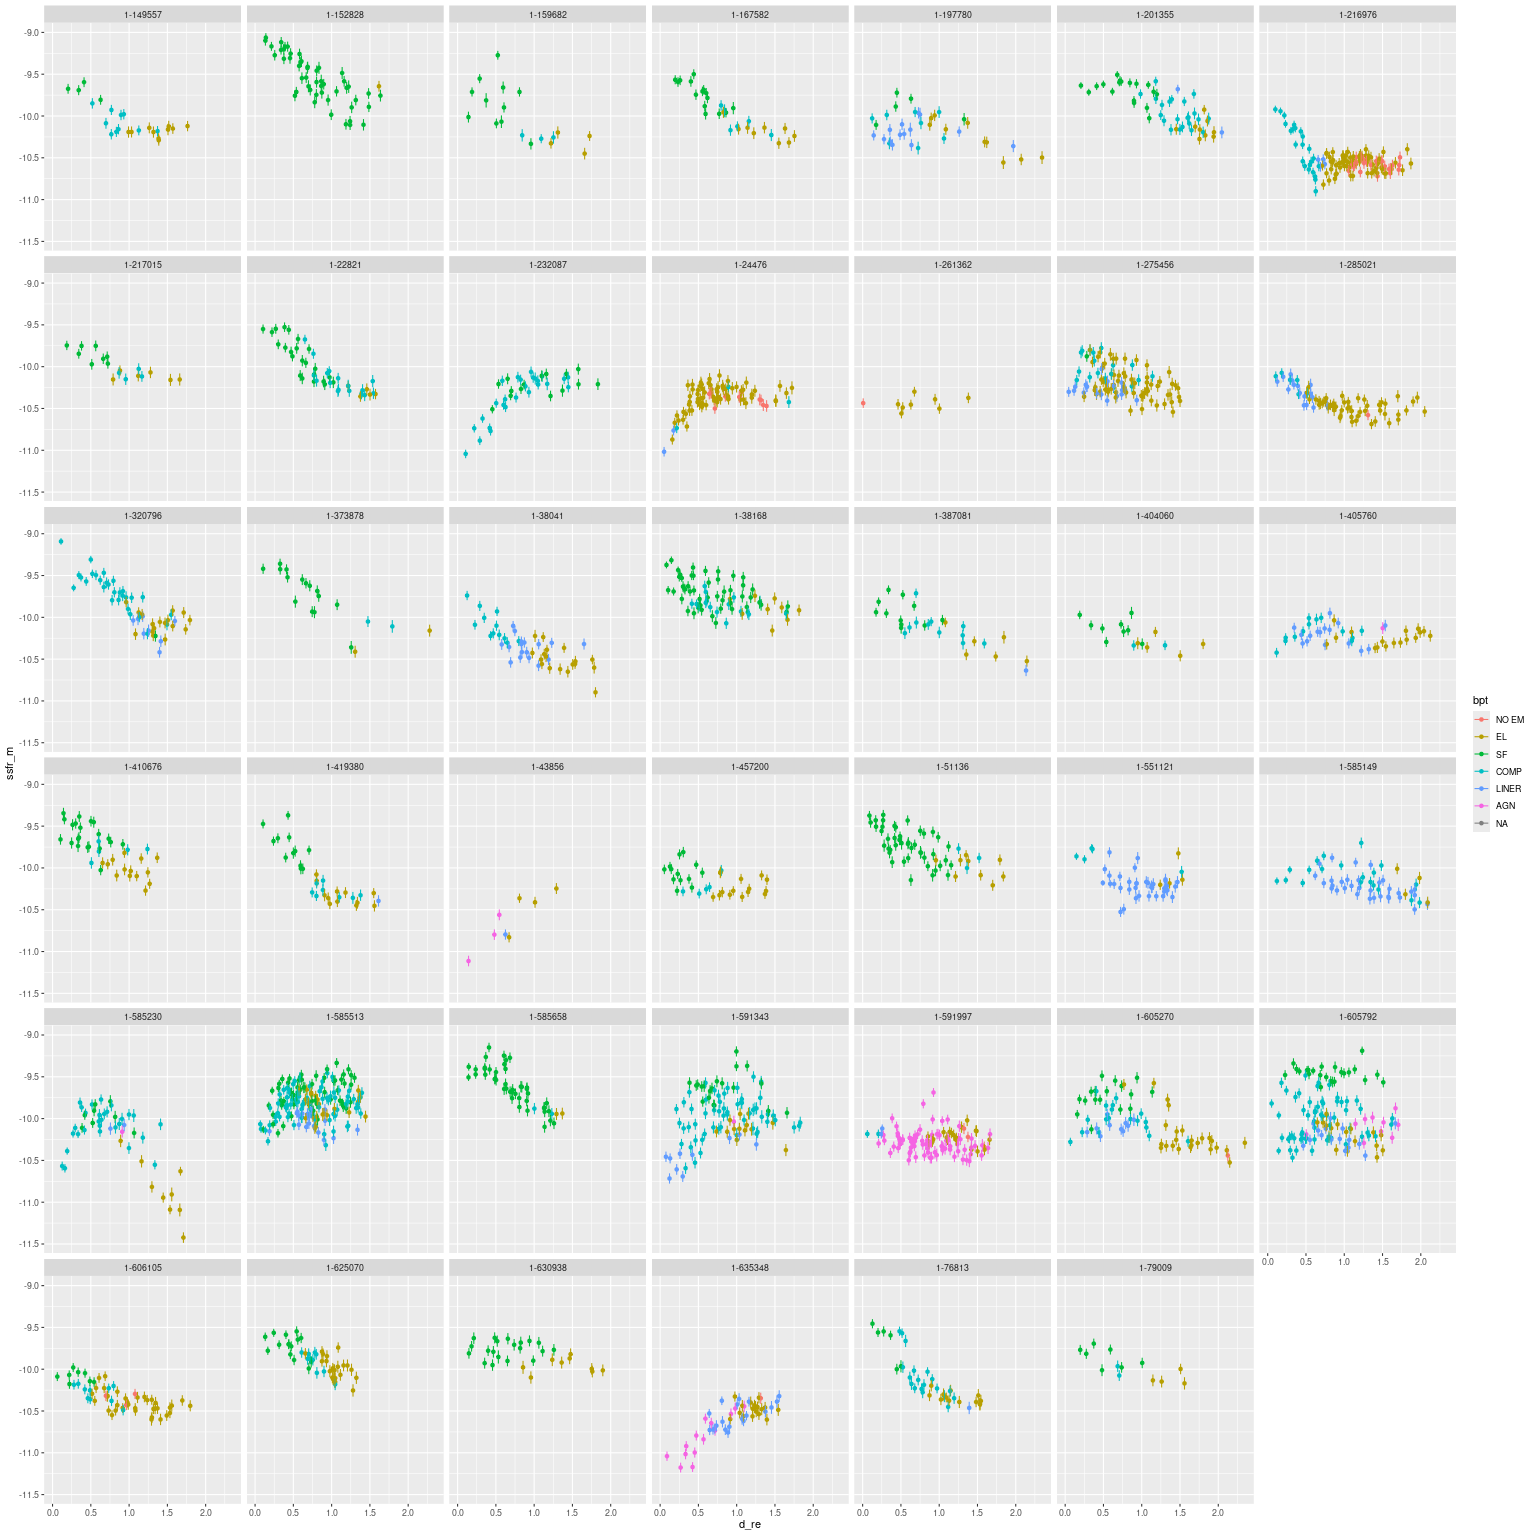
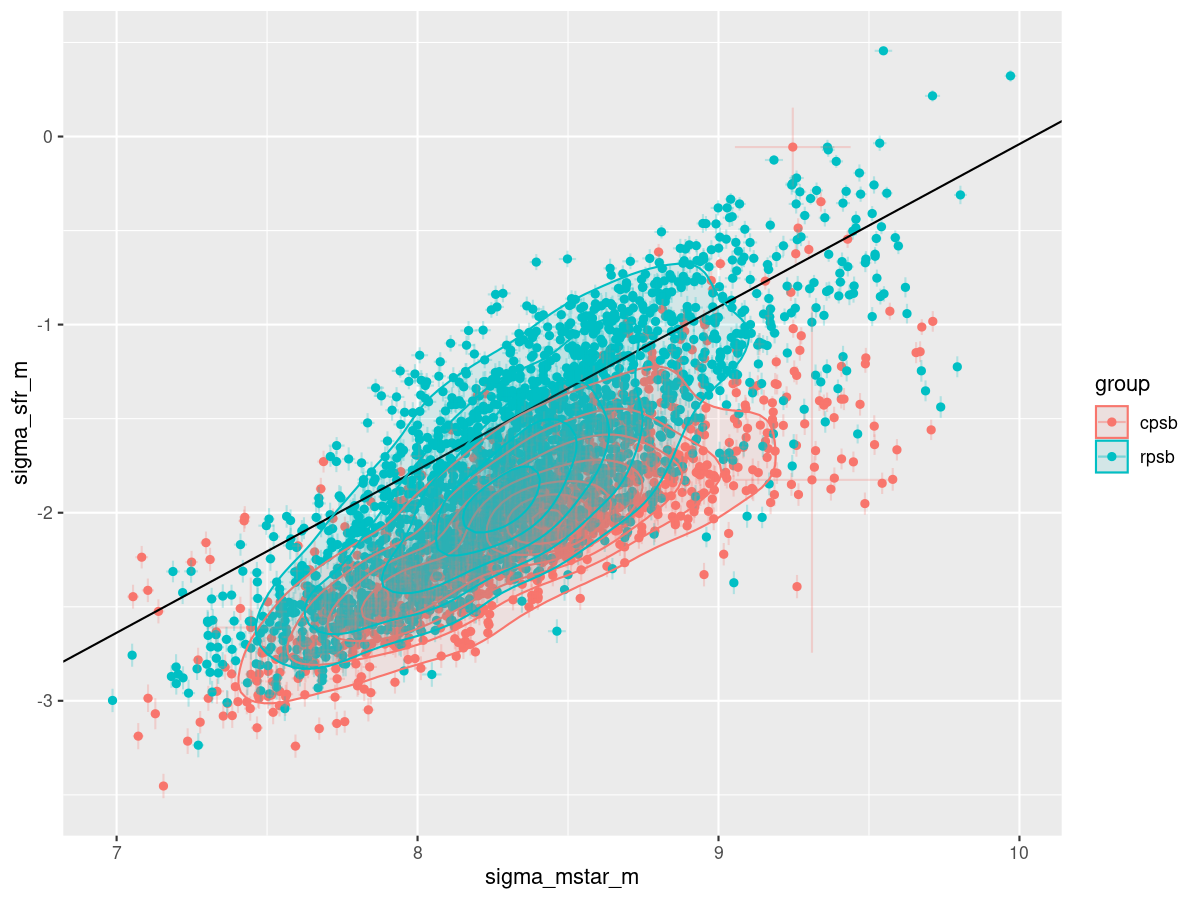
One final plot: (100 Myr averaged) SFR density vs stellar mass density. The solid line is my old calibration of the mean star forming main sequence (which I should recalibrate). Evidently the RPSBs have a larger fraction of regions in the star forming main sequence and conversely the CPSBs extend farther into the green valley.
Another thing I found rather odd about the Leung papers is they use some variation of the word “merger” 61 times in two papers, but there’s no indication that they actually examined imaging of their sample, all members of which are in both the SDSS and Legacy Survey footprints. I have examined the entire sample in Legacy Survey imaging3DR9 of Legacy Survey is considerably deeper than SDSS imaging using its custom catalog upload feature with the object list taken from the papers’ supplementary material. What I was mostly looking for was morphology, specifically morphological disturbance. What I found was an interesting difference between the two samples:
| Merger | Merger remnant | Disturbed | Total | |
| CPSB | 1 | 7 | 2 | 48 |
| RPSB | 8 | 5 | 6 | 41 |
Almost half of the RPSBs have some level of disturbance, and there are 8 ongoing mergers (or perhaps flybys in a few cases). The mergers are in all stages of Toomre’s famous sequence ranging from M51/M52 like interacting pairs to fully merged systems with prominent tidal tails. There are also several merger remnants that are fully consolidated but with residual tidal tails, shells, and heavily disturbed overall appearance. This suggests either that mergers play a more important role in forming RPSBs, or alternately that we are simply seeing earlier stages of the transition to quiescence in them. I favor the latter: star formation has almost completely shut down in the CPSB sample, while it’s relatively widespread in the RPSBs.
I may return to take a closer look at “interesting” systems, especially the mergers. After that I may look at extending the models somewhat, in particular to include kinematics in the Bayesian part of the analysis.
CPSB sample, formatted for Legacy survey’s custom catalog feature:
ra,dec,name,radius
259.53275,30.12902,1-178035,90
317.42261,0.62777,1-179682,90
318.50227,0.53509,1-635485,90
49.22887,-0.04201,1-38062,90
49.94685,0.62382,1-38166,90
50.8886,-0.43854,1-38374,90
246.76069,43.4761,1-134964,90
330.97675,12.66425,1-115066,90
358.46882,-0.09873,1-29809,90
129.95175,54.58077,1-47429,90
127.48937,44.94016,1-72913,90
195.3305,27.86046,1-457130,90
194.52342,29.01735,1-404249,90
120.06709,29.47144,1-146344,90
120.0596,26.69801,1-163965,90
194.33162,27.61386,1-456744,90
242.58533,41.8549,1-210114,90
173.41287,52.67459,1-149709,90
170.72345,51.34178,1-149589,90
239.67322,27.5576,1-265375,90
119.36531,33.25794,1-153247,90
126.75586,21.70675,1-384400,90
127.31796,23.80902,1-384486,90
123.32063,22.64832,1-298319,90
129.60004,25.7545,1-605367,90
129.24075,3.70746,1-213422,90
195.50061,27.7827,1-456987,90
195.00491,26.95609,1-456287,90
194.6184,27.55941,1-456564,90
196.18058,28.25158,1-457201,90
237.78551,25.72287,1-594067,90
123.85738,37.34052,1-153901,90
120.57663,32.5355,1-201936,90
123.44265,52.86546,1-352293,90
176.81118,49.18526,1-175153,90
149.29788,5.20136,1-606491,90
147.55031,34.69867,1-389466,90
149.45645,-0.21092,1-837,90
146.11232,4.49914,1-78155,90
194.84208,26.79709,1-456684,90
194.9764,26.81997,1-456285,90
196.35756,53.59176,1-195233,90
230.92926,8.45805,1-335174,90
241.62547,18.58765,1-545946,90
332.02545,-0.90695,1-26470,90
19.48079,14.62889,1-40655,90
16.57401,14.06501,1-39922,90
198.1078,34.121339999999996,1-415550,90
198.46832,2.13256,1-66669,90
204.01719,30.14108,1-415883,90
RPSB sample, formatted for Legacy survey’s custom catalog feature:
ra,dec,name,radius
264.680317495,57.2392064632,1-24476,90
49.4574544521,-0.554658522356,1-38041,90
49.9293385832,0.565477825589,1-38168,90
117.05386562,28.2250917233,1-201355,90
142.724744471,35.4397842245,1-232087,90
138.981378466,44.332760792,1-585513,90
159.382717136,43.653763908,1-275456,90
198.784245451,30.4037749681,1-625070,90
196.102718588,36.4799500087,1-405760,90
197.813416042,46.7006985856,1-285021,90
213.123697004,39.2511786235,1-261362,90
136.114189404,41.4862065591,1-217015,90
135.75896569,40.433985245,1-216976,90
207.301450689,35.2847067132,1-410676,90
154.480832851,46.6032857139,1-167582,90
147.664314026,44.3311626403,1-606105,90
183.007901999,35.4043988775,1-419380,90
256.566034877,60.7051871831,1-22821,90
313.902141162,-0.636585786958,1-635348,90
118.370298929,39.2997132847,1-43856,90
196.472871111,28.1124344082,1-457200,90
117.929431767,30.4487515558,1-152828,90
187.855146189,36.8261121104,1-404060,90
171.779020656,51.1316446862,1-149557,90
48.9109712372,-7.07881660757,1-51136,90
139.177873123,28.0542327591,1-387081,90
221.3144,49.43478,1-197780,90
228.414854807,28.2444605219,1-373878,90
129.747018952,26.1369907096,1-585230,90
152.870773315,5.14903593063,1-79009,90
134.522081756,3.75649240107,1-76813,90
205.432335253,55.6737595258,1-591997,90
220.027462904,3.87356958262,1-630938,90
127.34375942,43.3586843172,1-605270,90
128.949656177,28.753142151,1-585149,90
139.97678,32.93352,1-605792,90
144.843313049,36.5745680881,1-585658,90
214.930148646,49.2366458158,1-320796,90
195.920019324,51.4950809373,1-591343,90
345.921811451,1.043581797,1-551121,90
204.680676363,-1.7041980007,1-159682,90