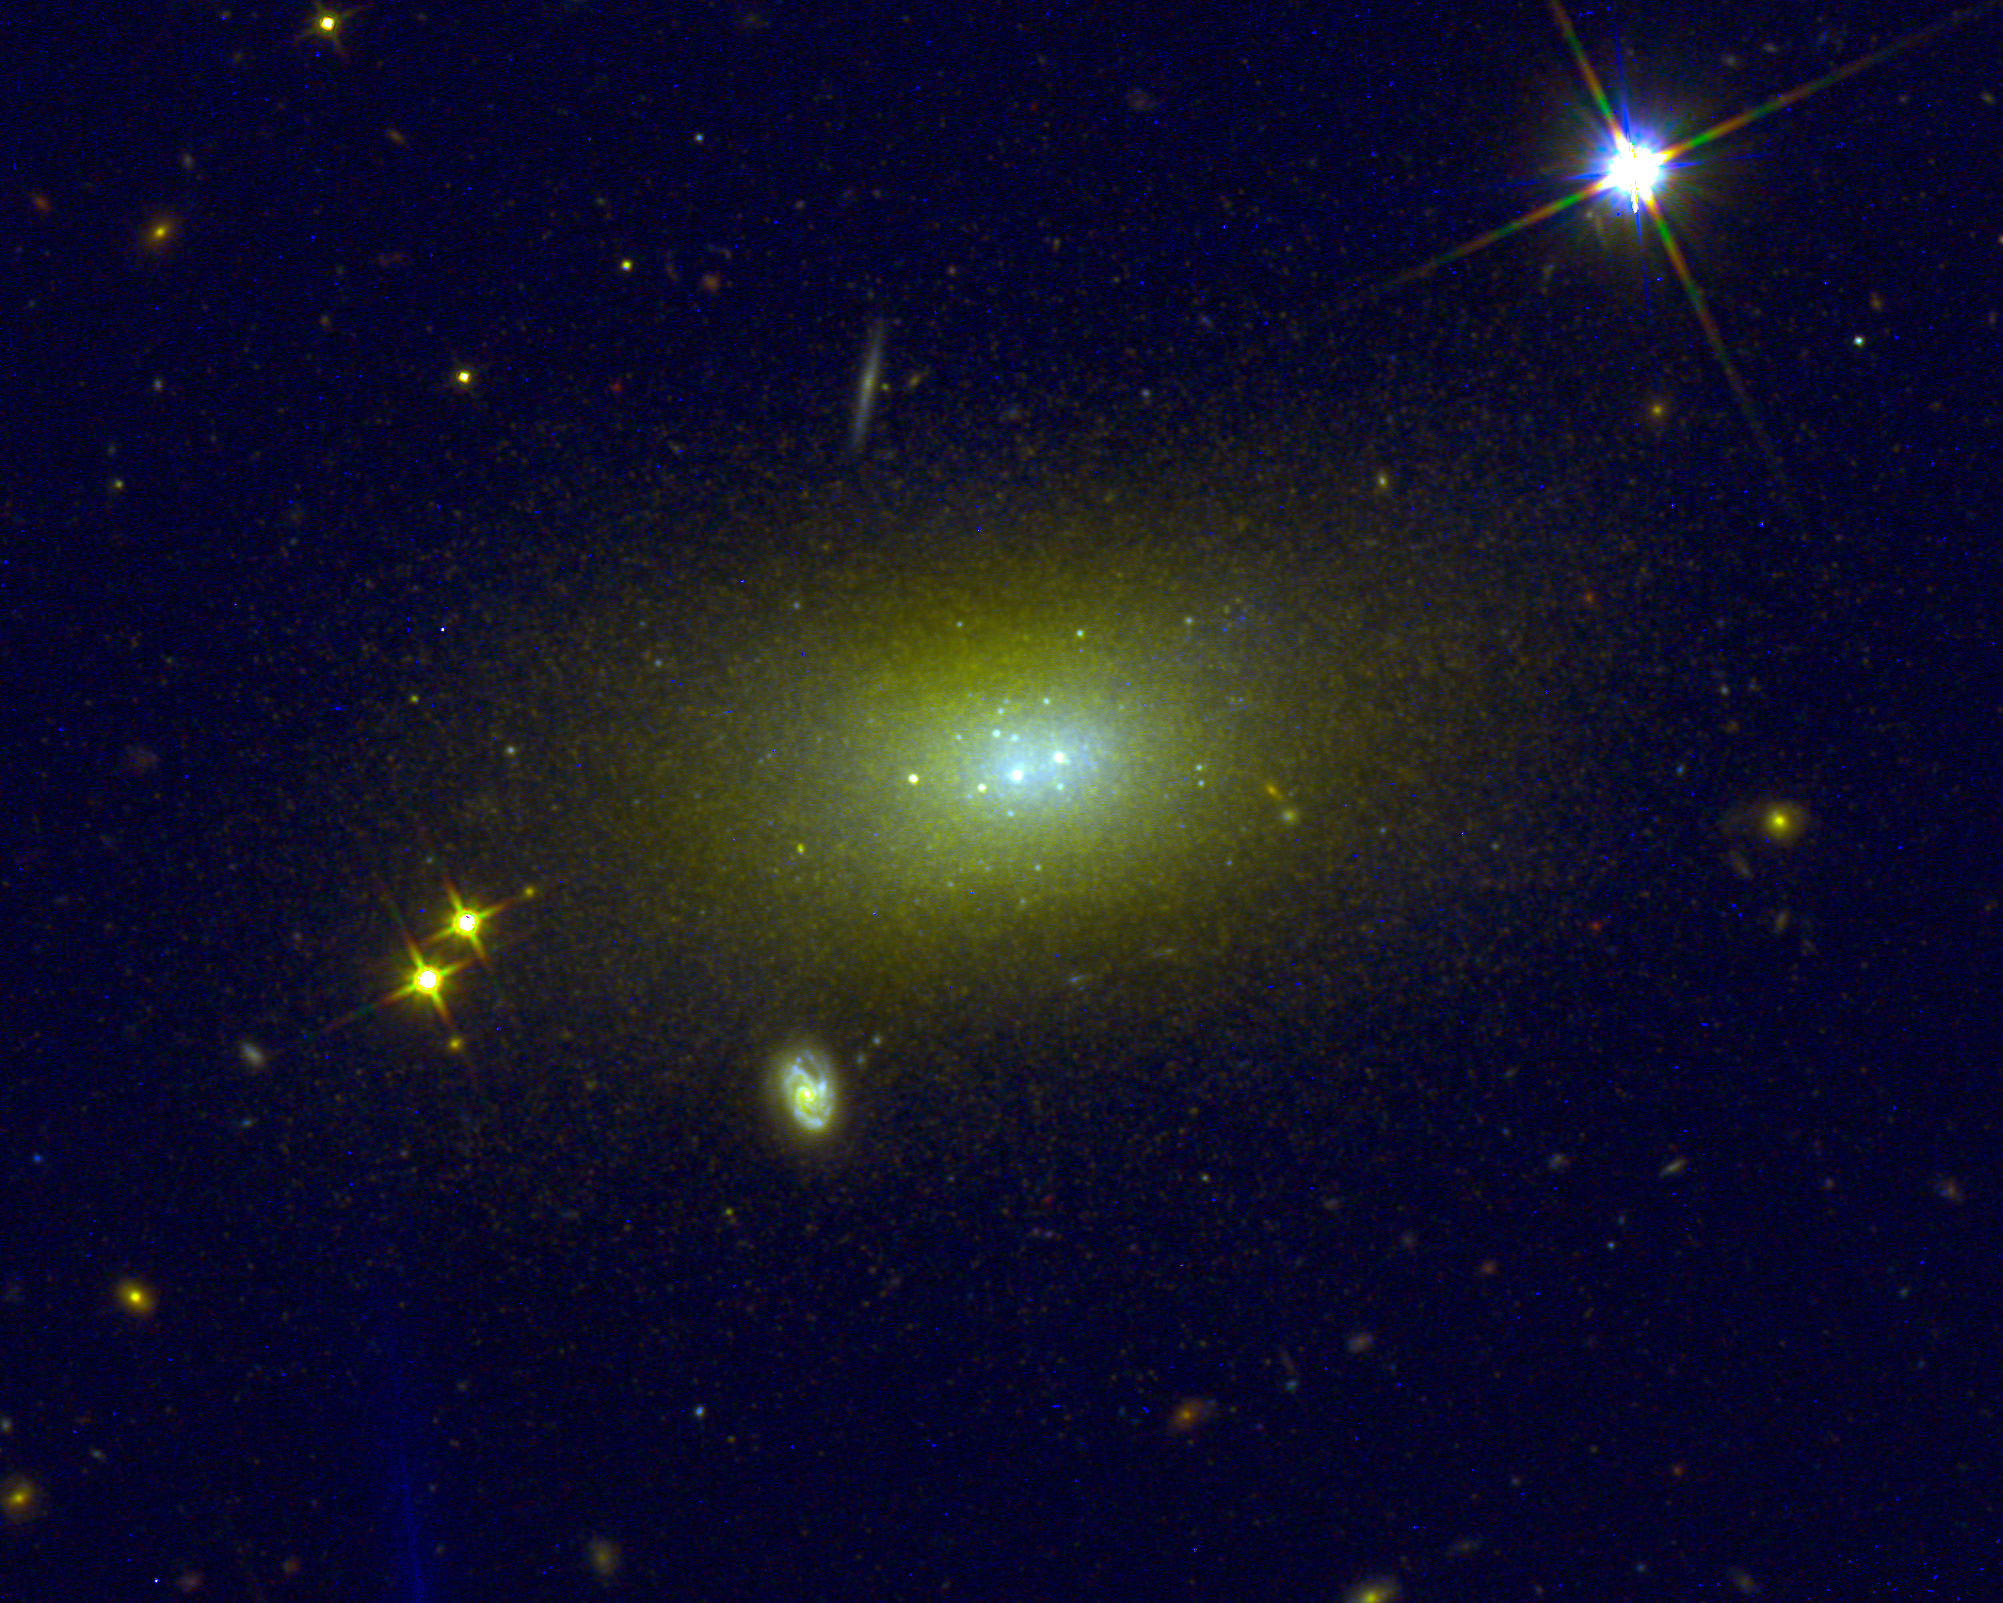
I’ll resume my M31 posts soon (I hope), but I wanted to do a short post on the recent Zoogems HST observation of IC 3025 which is a dwarf elliptical in the Virgo cluster that was selected as part of the “post-starburst” galaxy sample. Thanks mostly to its membership in Virgo this galaxy is fairly well studied and even has multiple HST observations. Just for fun I tried to make a false color RGB image from three observations, with two in the IR through F160W and F110W filters, and the blue channel from the Zoogems observation in F475W.

This used a program named SWarp (author Bertin) to rescale and align the images and STIFF (also Bertin) to combine them, with some Photoshop work in a mostly futile attempt to get a more pleasing color balance and clean up some of the hot pixels. I don’t know exactly how STIFF maps counts to gray scale levels, but despite the odd color cast this picture may actually give a reasonably accurate rendering of the relative fluxes in each filter. The galaxy as a whole has a g-J color of about 1.3 mag (based on my measurements with APT and NED) and J-H ≈ 0.2 mag. per Jensen et al. (2015), so an orange or even green color in the body of the galaxy is not so unreasonable.
The blue(er) central region is notable and apparently real also. This is one of a distinct class of dwarf early type galaxies with blue centers, given the designation dE(bc) by Lisker et al. (2006). The blue centers are almost certainly due to recent star formation, as I’ll verify below.
There are 3 bright, unresolved clusters near the center with a number of others scattered around the body of the galaxy. By my measurements with the manual Aperture Photometry Tool the brightest of these has a g band (F475W) magnitude of 20.71 and J (110W) of 20.084, or g-J ≈ 0.62. The other two near the galaxy center are slightly fainter and considerably redder: g = 21.5 and 22.6 for the western and eastern flanking clusters, with g-J ≈ 1.2 for both. Jensen et al. (cited above) measure the distance modulus to be m-M = 31.42, which makes the F475W absolute magnitude of the central cluster equal to -10.71. Like the Zoogems target I discussed several months ago this would be quite luminous for a galactic globular cluster but is typical for a dwarf galaxy’s nuclear star cluster (Neumayer, Seth, and Boker 2020). This distance modulus, which corresponds to a luminosity distance of 19.2 Mpc, is considerably larger than the canonical distance to the Virgo cluster of m-M = 31.09 (per Jensen again). This is one of several lines of evidence that the galaxy is currently falling into the cluster.
Like the other galaxies in the Zoogems “post-starburst” sample the SDSS spectrum was incorrectly classified by the SDSS spectro pipeline as coming from a star, but this one has a correct redshift and has been used in science studies (for example in Lisker et al. cited above). From the reported position the fiber center was just west of the brightest central cluster and includes both that one and the cluster just to the west. The spectrum is very much typical of a post-starburst, with deep Balmer absorption and a shallow 4000Å break. I measure HδA = 7.24 ± 0.60Å and Dn4000 = 1.26 ± 0.0141this spectrum was analyzed in the JHU/MPA pipeline with nearly identical values and uncertainties, very similar values to the other two that I posted about last year. Finally, although it’s far from evident on visual inspection, there are firm (4-5 σ) detections of Hα and S[II] 6717, 6730 in emission. No other emission lines were detected.
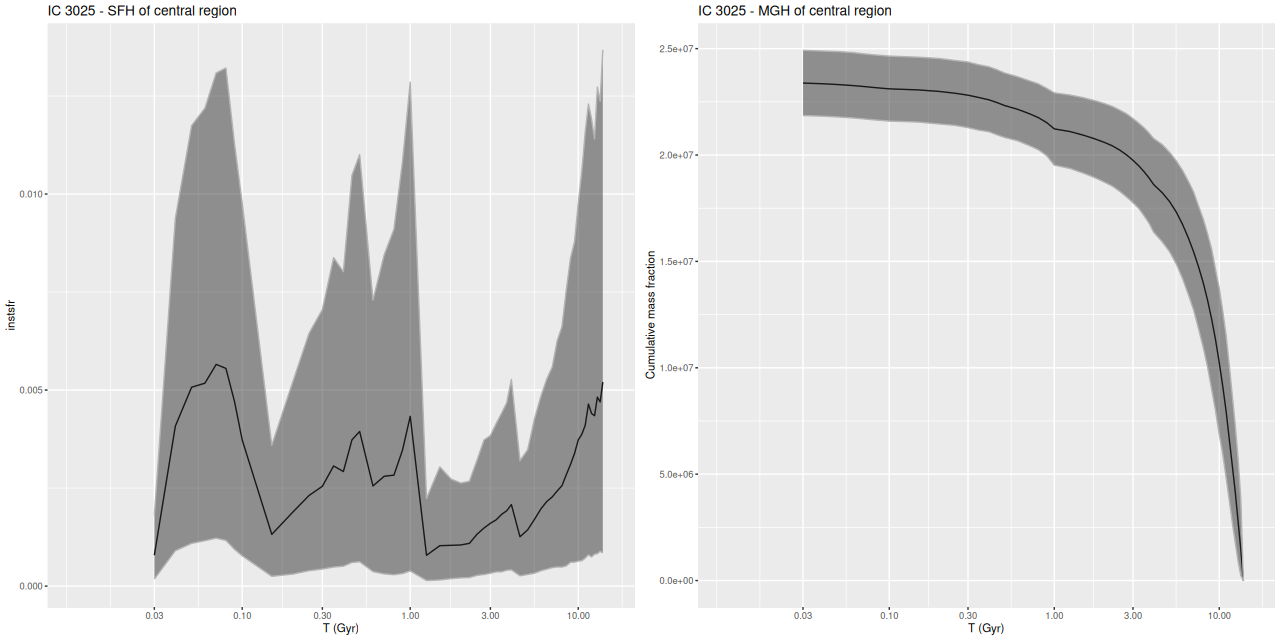
I used my usual star formation history modeling code with the metal poor subset of the EMILES SSP library as described here, which produced the estimated star formation and mass growth histories:

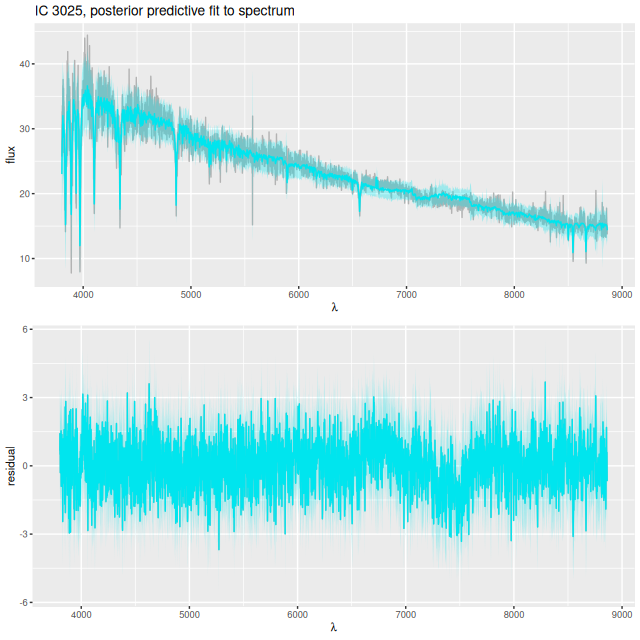
with a very good fit to the data except for a small region around 7500Å (which is often the case with the EMILES library):

My results can be compared fairly directly to an analysis by Lisker et al. (cited above), who performed some simple stellar population modeling on SDSS spectra with what appears to be their own unreleased code. They limited their populations to 3 discrete ages with the oldest fixed at 5 Gyr and the mass fractions and ages for the other 2 chosen from a finite set of possible values.
Perhaps surprisingly my results agree rather well with theirs. For VCC 21 (the Virgo Cluster Catalog designation for IC 3025) their best fit had about 9% of the total mass in young and intermediate age populations, with the young population chosen at 9 Myr age and 0.3% of mass and the intermediate population age of 509 Myr.
My models also show three broad periods of star formation with some lulls in between that can conveniently be divided into young, intermediate, and old populations. The youngest SSP models in my metal poor subset are 30 Myr, so of course there can’t be any truly young populations in the model. The peak in recent star formation was at ~70 Myr with a steep decline at the youngest lookback times. Around 1% of the present day stellar mass in the fiber footprint is in stars younger than 100 Myr, with just under 10% under 1 Gyr.
Based on the colors we can infer that the acceleration of star formation that began ~1 Gyr ago was limited to the central region and the presumed nuclear star cluster. The remainder of the galaxy and its cluster system must already have been quiescent by then.
Edit
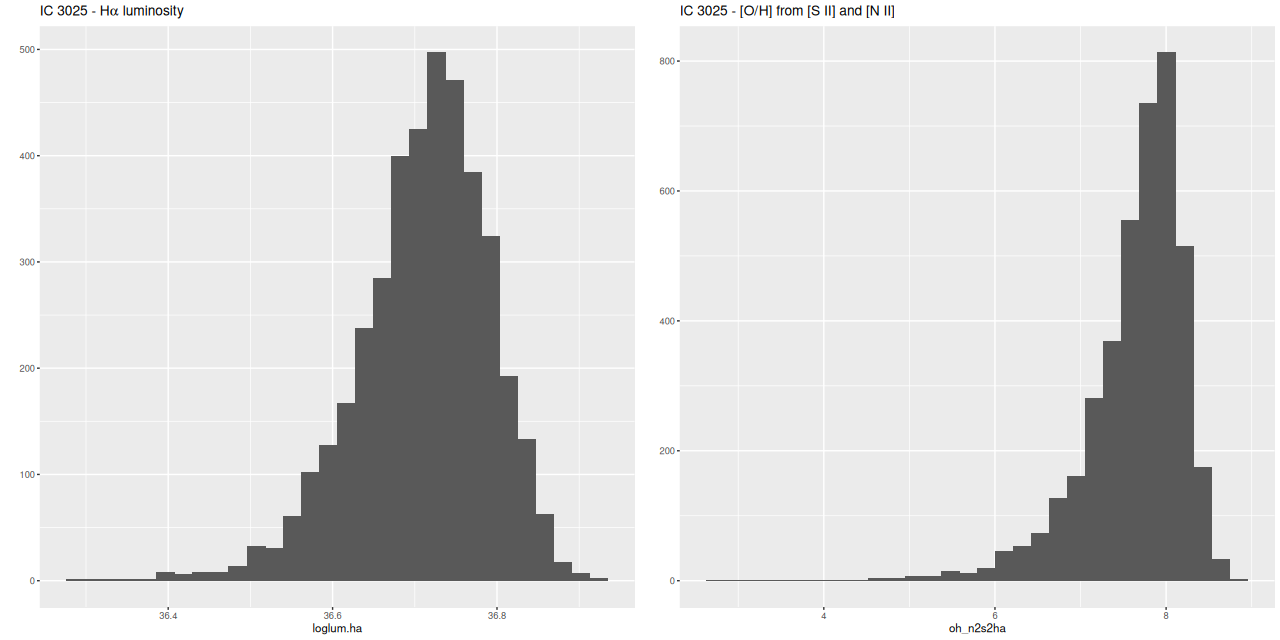
I mentioned above my SFH models indicated there were firm detections of Hα and the [S II] doublet in emission. Although [N II] wasn’t detected at better than the 1σ level it’s still possible to make a strong line metallicity estimate from the posteriors. I also plot the marginal posterior for Hα luminosity below:

Using Calzetti’s calibration of the Hα – SFR relation this implies a current day star formation rate ~10-4.5 M☉/yr. This should be considered an upper limit since we don’t know the ionizing source. Using Dopita’s calibration of the [N II]/Hα plus [S II]/Hα strong line metallicity estimator the upper limit to 12+log(O/H) is around 8, which is subsolar by almost an order of magnitude.
