
After a fairly long break I want to get back to M31 and MaNGA for one, or perhaps several posts and take a more detailed look at my model results. I still haven’t decided where I’m going to take this investigation. I may examine every IFU or just the ones that I found most interesting, and I’m not sure which of the many quantities that I estimate I’ll discuss. Besides my models I’ve retrieved a number of catalogs of interesting objects using Aladin. These include in particular H II regions (Azimlu et al. 2011), OB associations (Magnier et al. 1993), and red supergiants (Ren et al. 2021). All of these are products of recent or ongoing star formation. There are of course a huge number of catalogs of just about every type of astronomical object found in galaxies, and I may examine some more depending on what interests me.
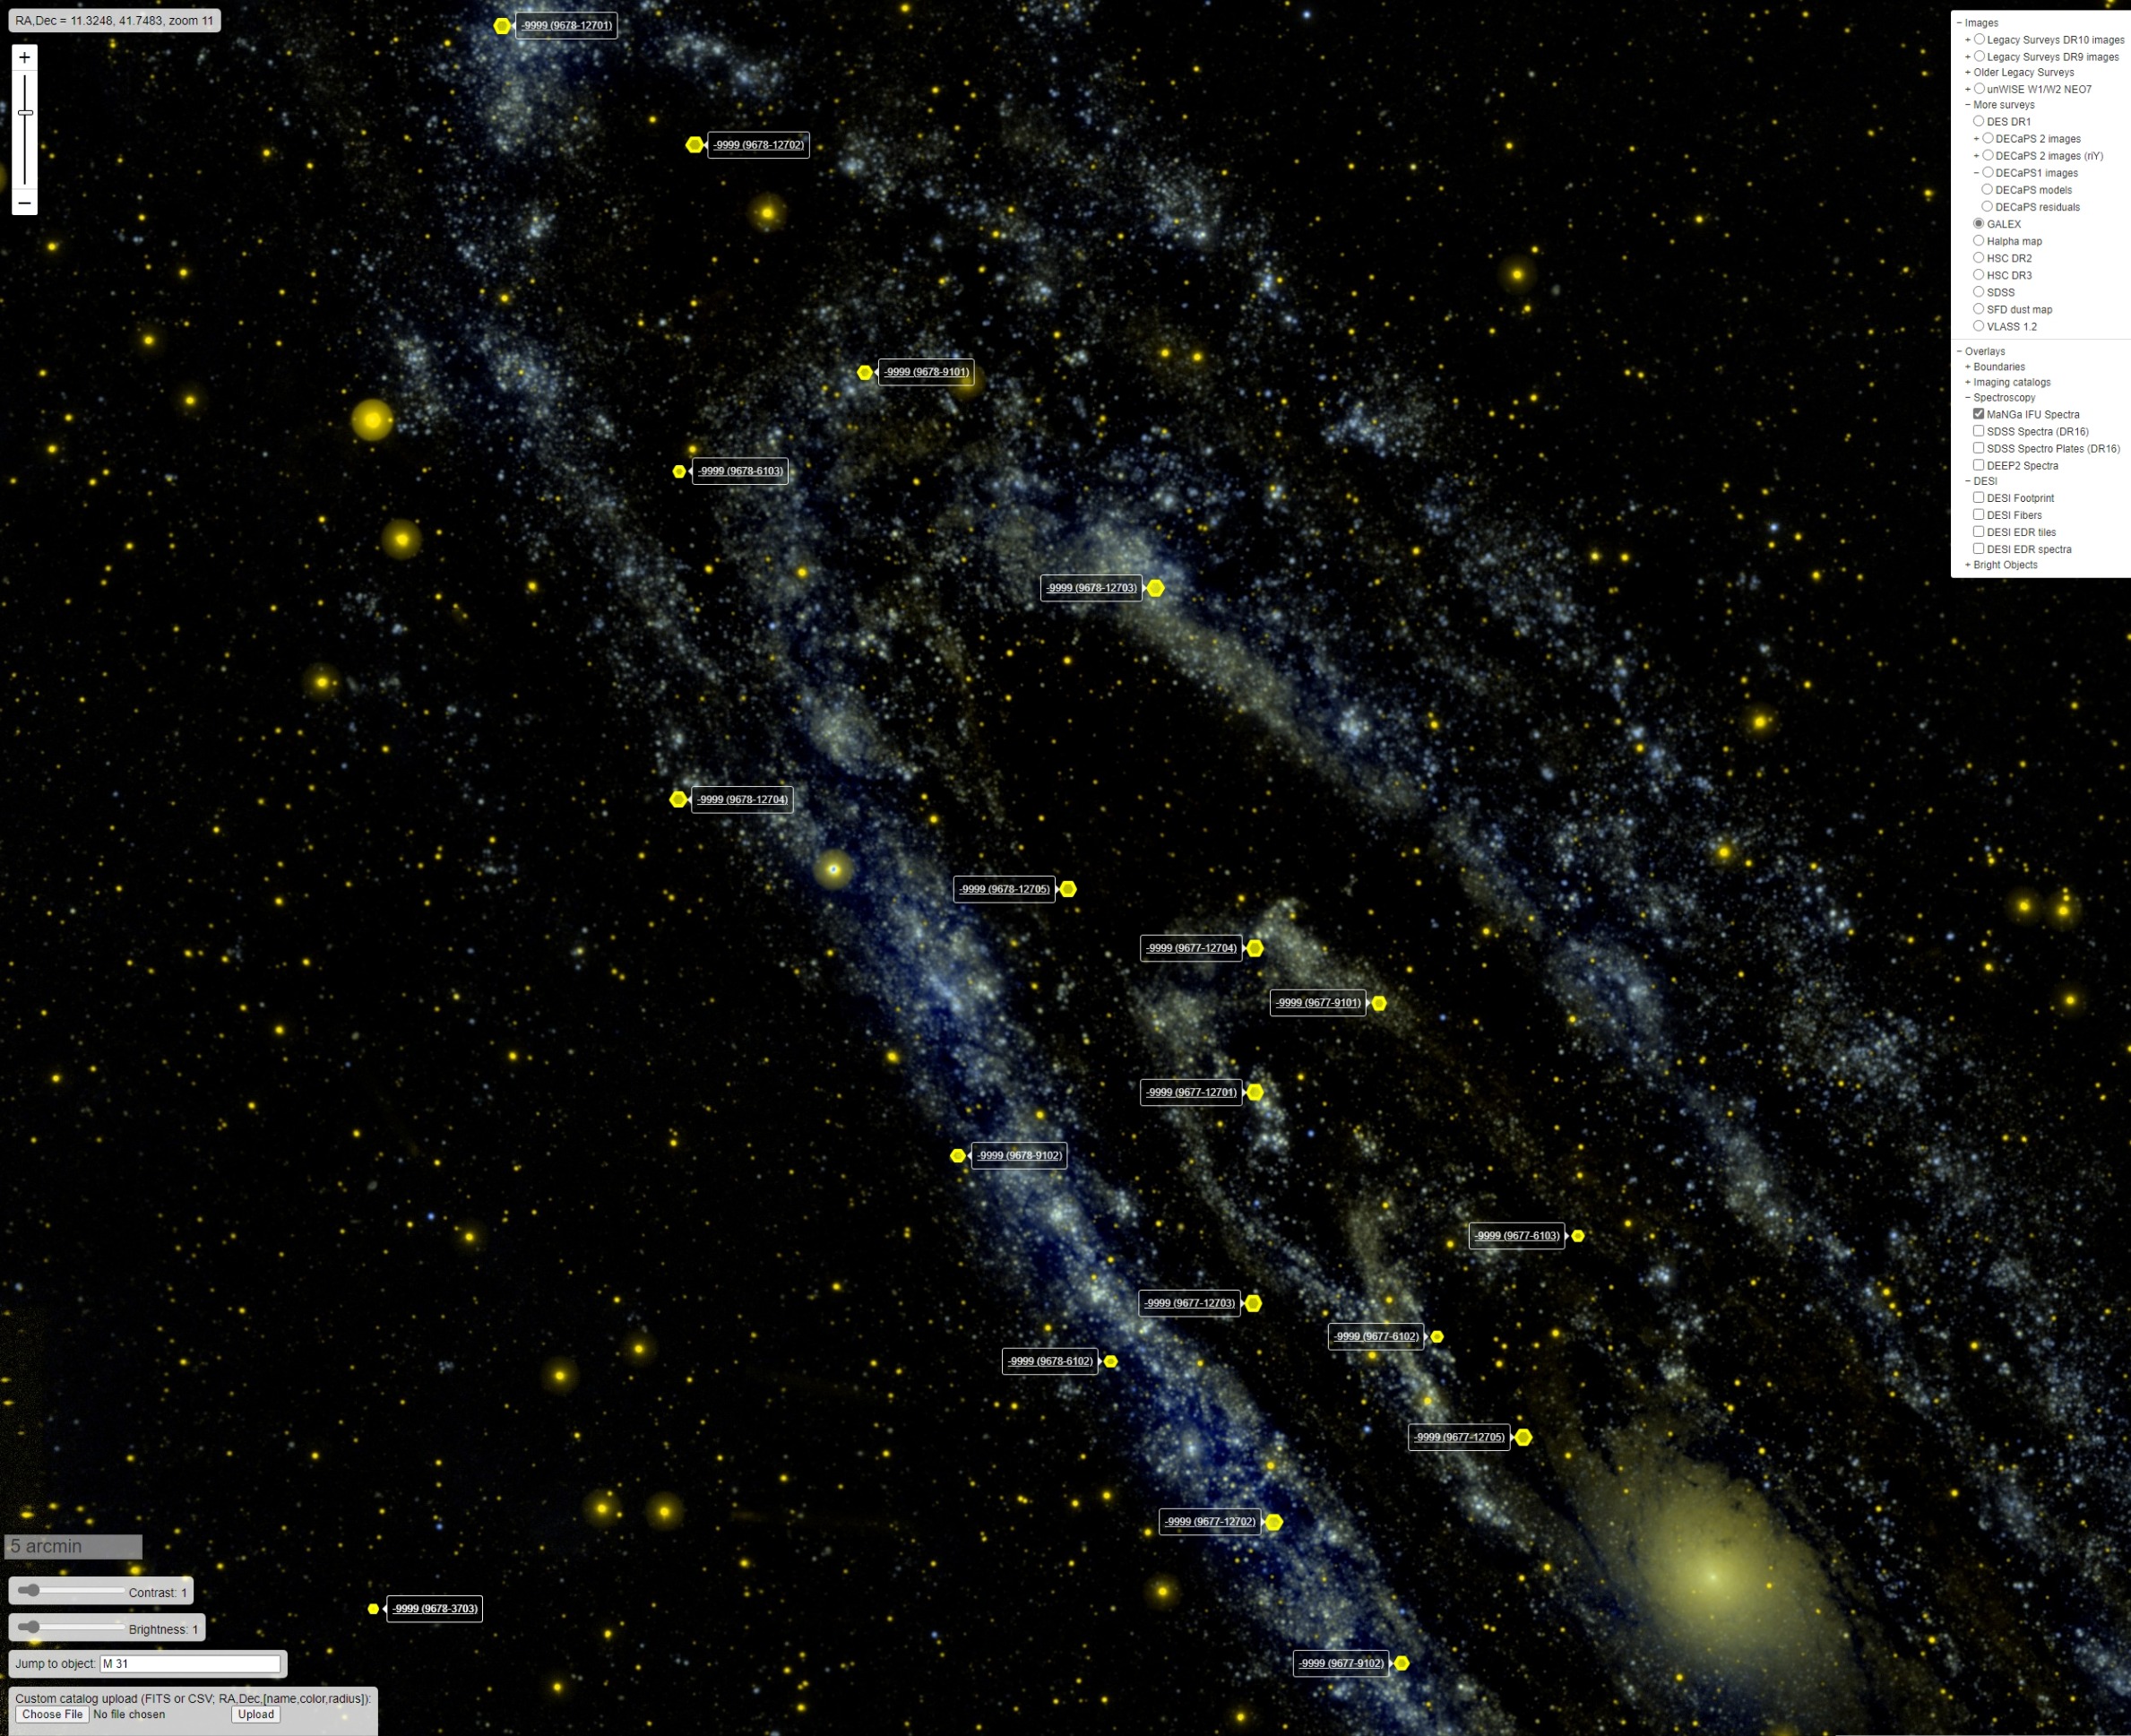
For orientation here’s a screencap of the Legacy Survey sky browser’s false color GALEX image of the northern half of M31 with the IFU positions overlaid and labelled with MaNGA’s plateifu identifiers. As a reminder these are all located within the PHAT survey footprint and specifically within the region for which star formation histories were estimated by Williams et al. (2017).
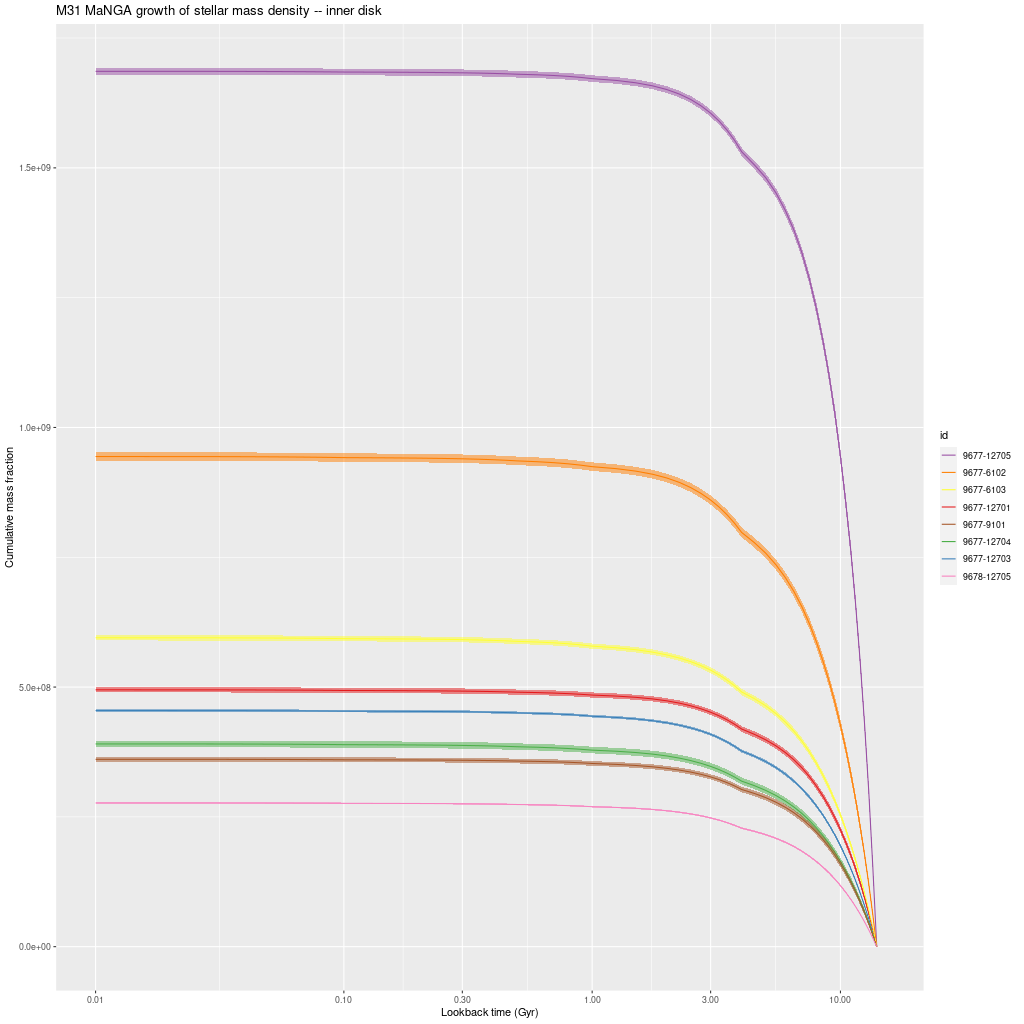
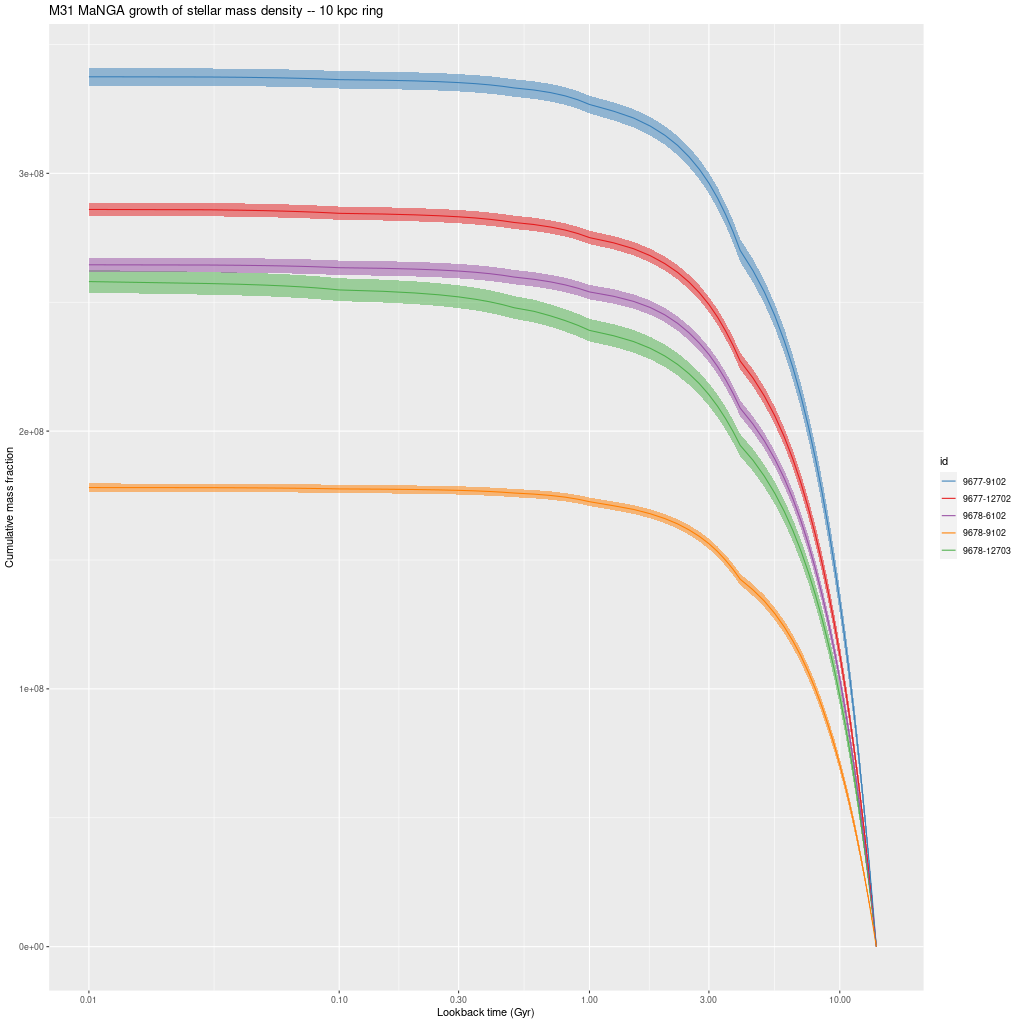
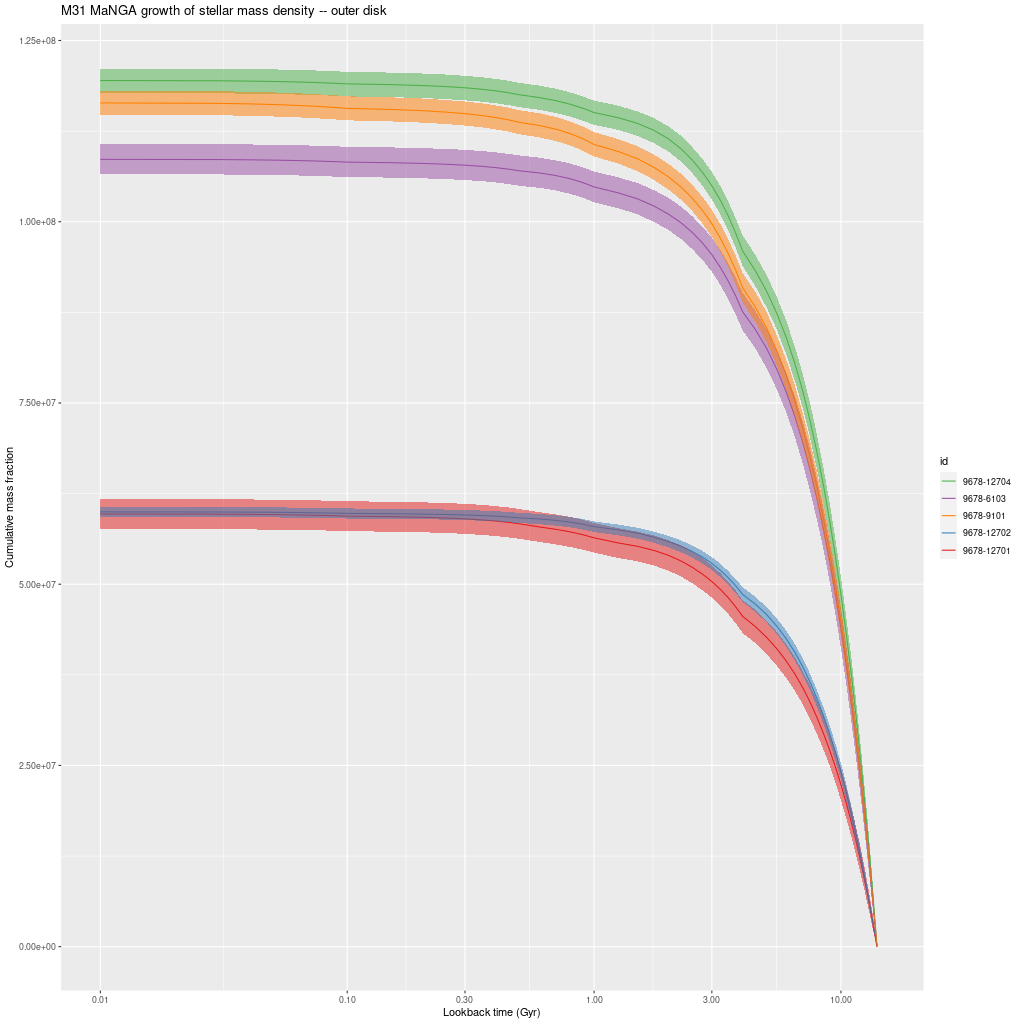
Before getting to individual IFU’s here is one more set of IFU-wide results. The following three graphs are model mass growth histories in units of present day solar mass per kiloparsec2. These are uncorrected for projection effects.
There are a couple interesting points here. There’s a clear stratification of mass density with projected radius, with about a factor 30 decline from the innermost to outermost IFU. This is in fairly good agreement with Williams’ estimate in their Figure 14.
The other thing to note is that all regions had most (> 55%) of their stellar mass in place by 8 Gyr ago and 92-99% in place by 1 Gyr ago. The largest fraction of recent star formation is in the IFU 9678-12703, which is very close to the region with the highest SFR in this half of the galaxy. There is also a trend towards later mass build up with increasing radius, which is completely consistent with the “inside-out” growth paradigm. The outermost IFU, 9678-12701 at about 16kpc radius has formed about 5% of its present day stellar mass in the past Gyr.
As I said in the previous post I don’t see clear evidence for a widespread burst of star formation that’s widely believed to have occurred around 2-4 Gyr ago. A confounding factor in my models is that they invariably show jumps in SFR at times when the interval between SSP model ages change and the two oldest of these occur at 1 and 4 Gyr, so this produces a possibly spurious period of apparently accelerated star formation. I hope to find (or perhaps produce) a set of SSP models with a better age distribution this year.
I think I’m going to hit publish now and resume with inner disk IFU’s next time.