MaNGA in M31 – final word for now and some pitfalls

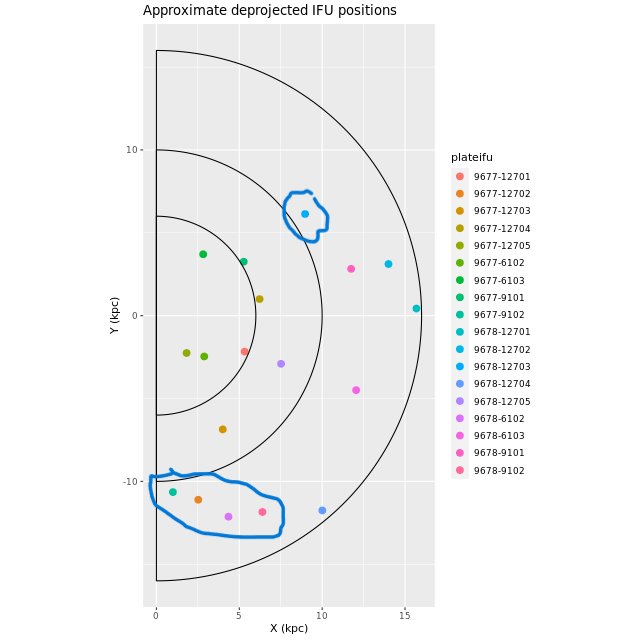
When I was doing my initial fits to the M31 MaNGA spectra I noted two that I initially thought were contaminated by foreground stars, and therefore I masked them to prevent further analysis. One of the two, in MaNGA plateifu 9677-12701 (mangaid 52-8) is a certain foreground star and won’t be discussed further. The other, in plateifu 9678-12703 (mangaid 52-23), turns out to be a luminous red supergiant that’s a genuine resident of M31. This is confirmed by two nearly contemporaneous catalogs of M31 red supergiants: the one by Ren et al. (2021) that I noted previously and Massey et al. (2021), which I stumbled upon more recently.

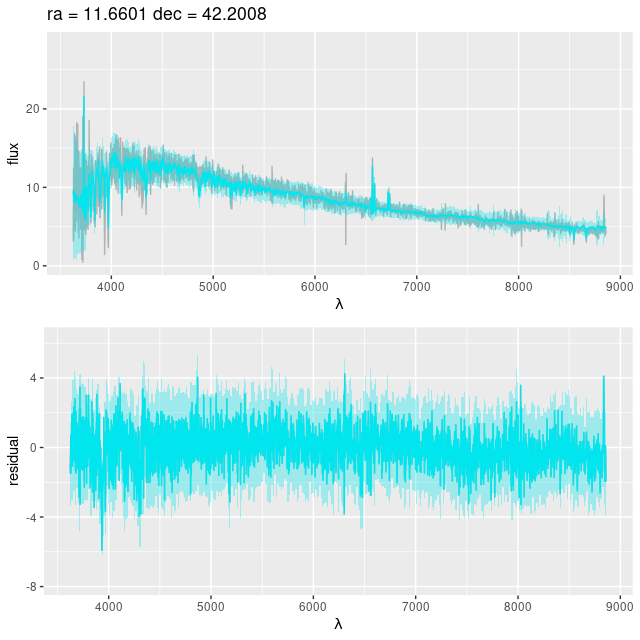
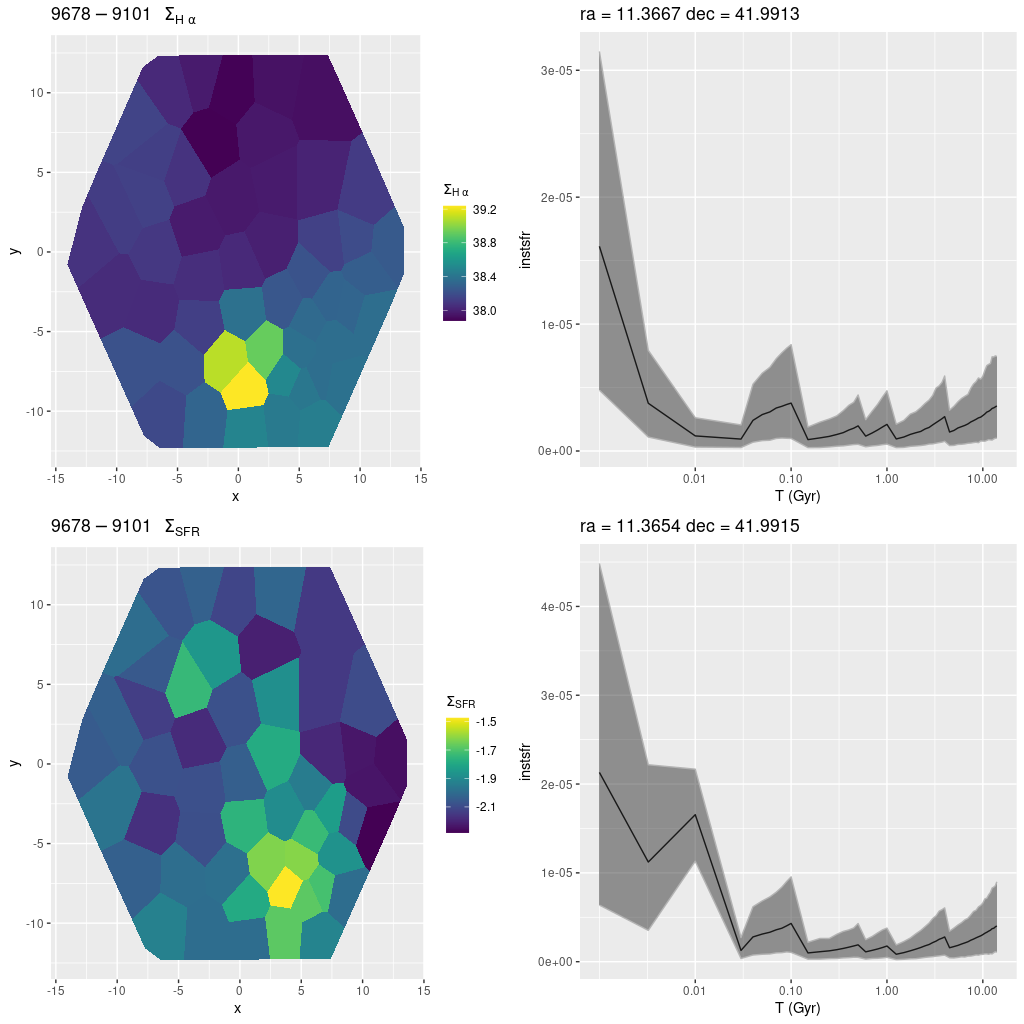
In fact there are two comparably bright red supergiants in this IFU. One that’s about 9″ north of the masked one probably should have been masked by whatever criteria I used, but it’s likely I failed to notice the fit to the data since I don’t have the patience to look at every spectrum and data fit that pops up. So, here is the spectrum, displayed in (negative) magnitudes with arbitrary zero point. The blue spectrum is the closest match in my SSP library, a 10 Myr old population with the highest metallicity I used (2.5 Z. This is one of the theoretical spectra from PyPopstar). This sorta looks right except it’s much too blue. The solution to that is, of course, to add some reddening through dust attenuation.

plateifu 9678-12703 (M31 10 kpc ring) Spectrum contaminated with red supergiant and closest match SSP model spectrum

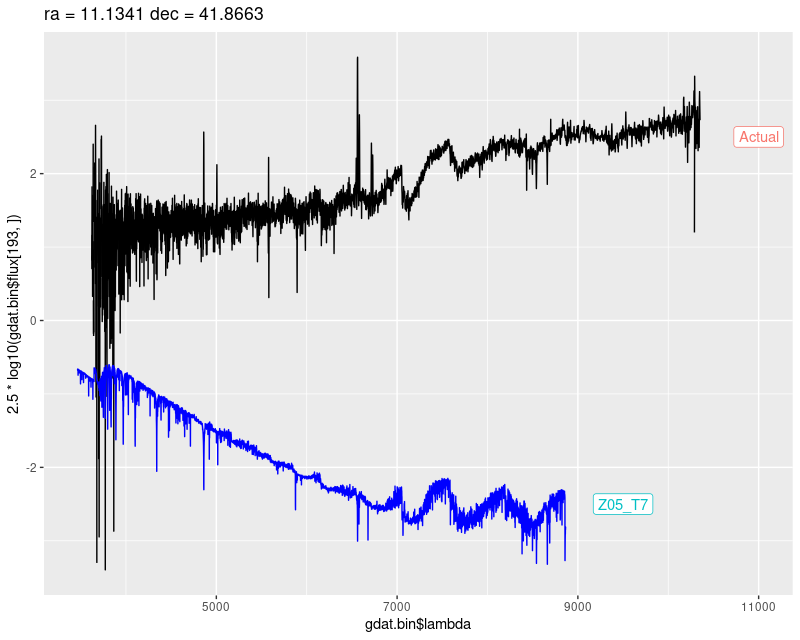
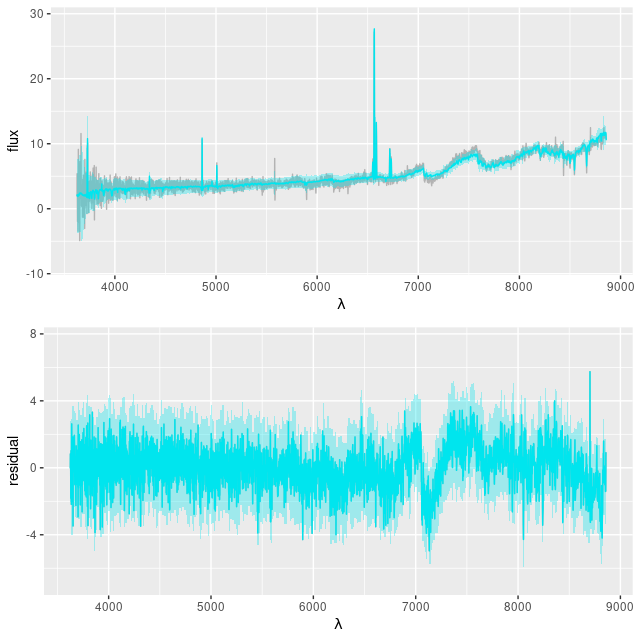
The maximum likelihood (non-negative weighted least squares) fit did just that, with only a single stellar contributor and a very high dust attenuation of τV = 3.0. This still doesn’t quite work: the residuals are rather strongly sloped in the blue and the details of the absorption features in the red aren’t quite right.

plateifu 9678-12703 – NNLS fit to spectrum contaminated with red supergiant

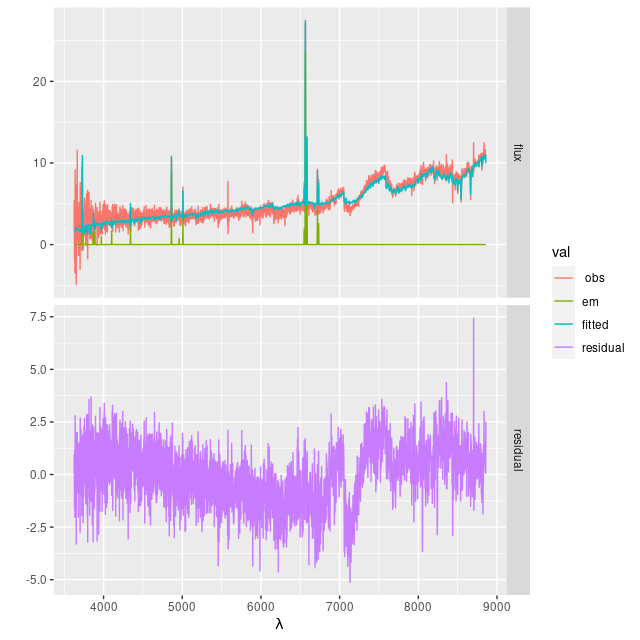
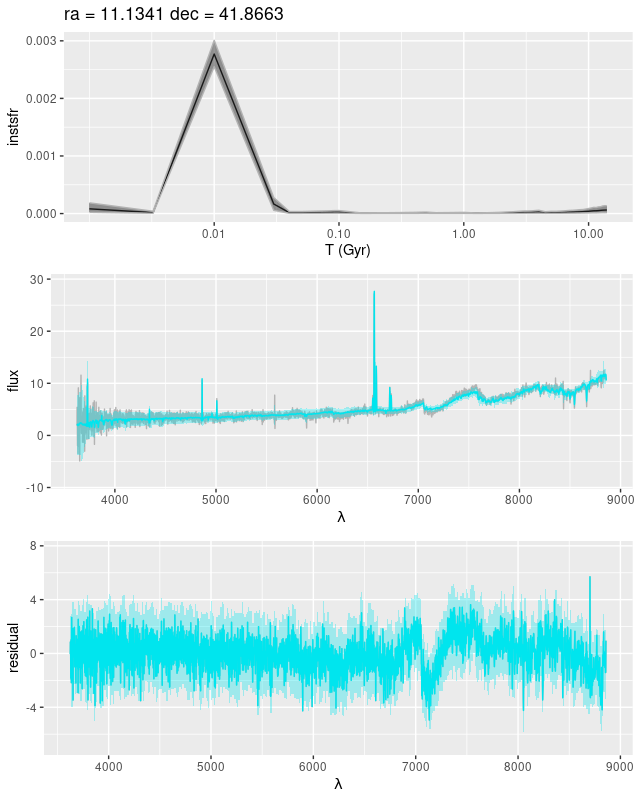
I still use a Calzetti attenuation relation in my NNLS fits. The Bayesian fits using Stan have the more flexible attenuation prescription that I described back in this post, and that helped considerably with the continuum as seen in the plot below. The absorption features in the red still aren’t fit well. The model has an even more extreme attenuation estimate with a much “grayer” than Calzetti slope, with τV = 4.38 ± 0.05 and δ = -0.33 ± 0.011see the link above for the meaning of these parameters.

9678-12703 – posterior predictive fit to spectrum

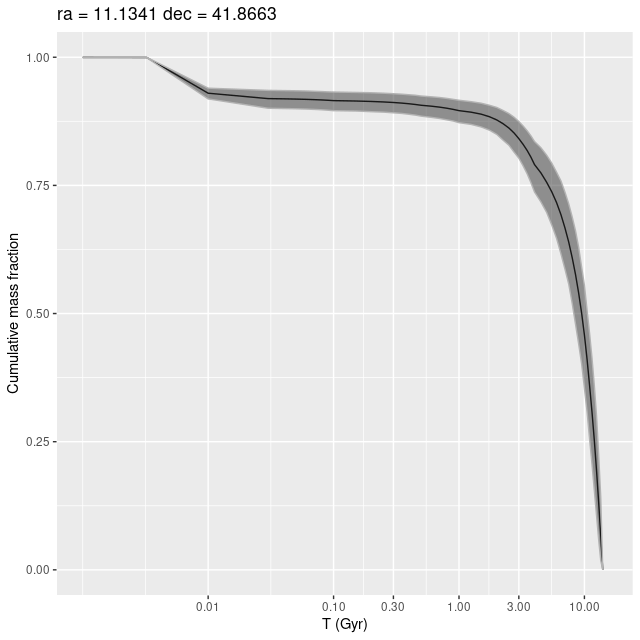
The model star formation history (displayed as a mass growth history below) isn’t completely implausible. The presence of a very luminous evolved star indicates the region is at least some Myr old, and a rapid onset and decline of star formation is typical for star forming regions in mature spirals. The recent episode of star formation added about 7% to the present day stellar mass, while at least 60% was in place by 8 Gyr ago (per the model).

plateifu 9678-12703 (M31 10 kpc ring) Model mass growth history for a region containing a bright red supergiant

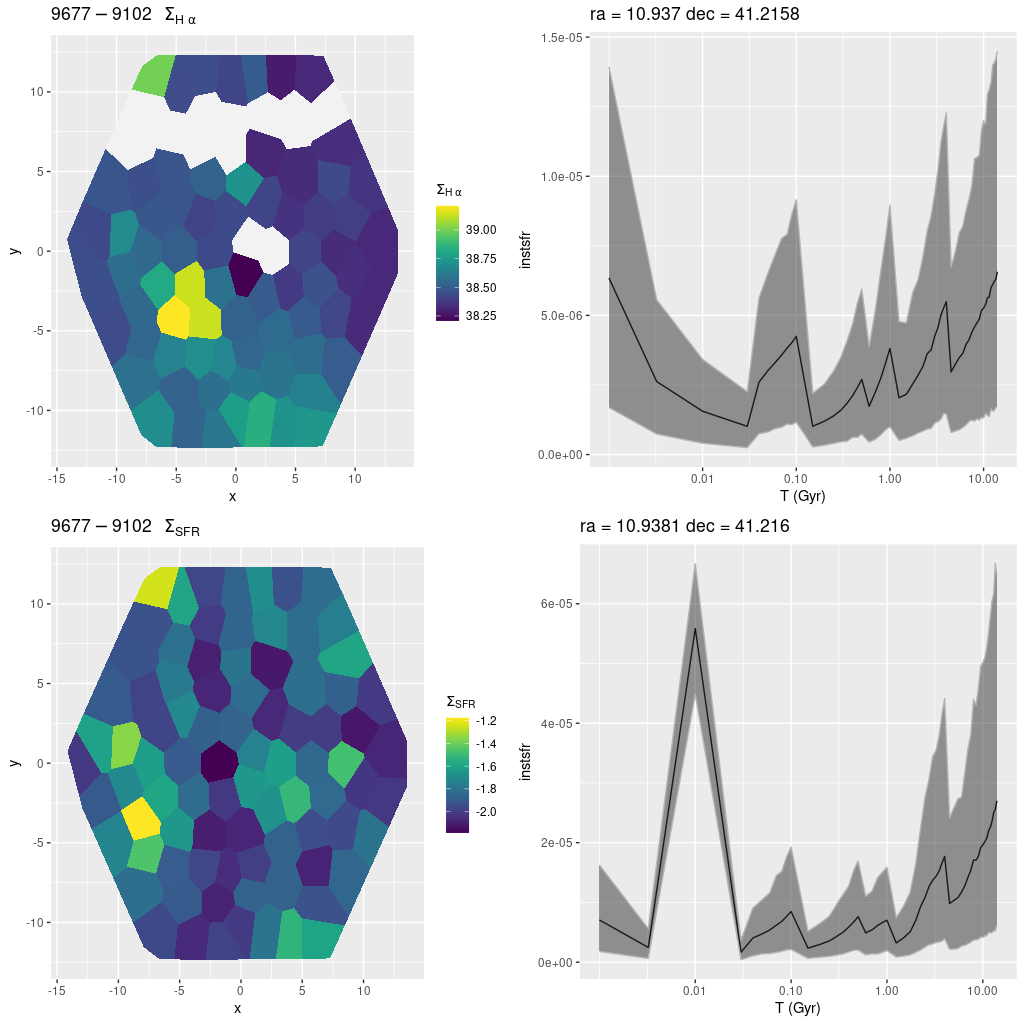
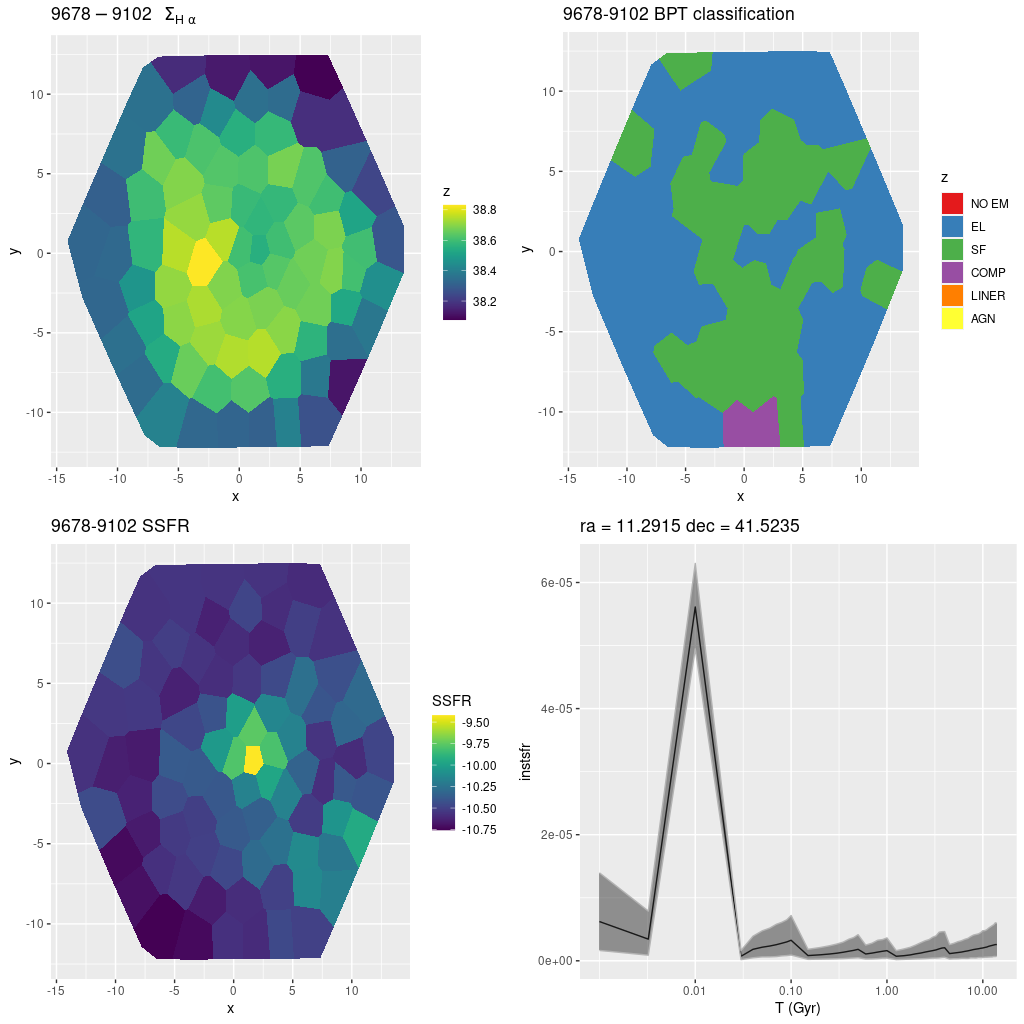
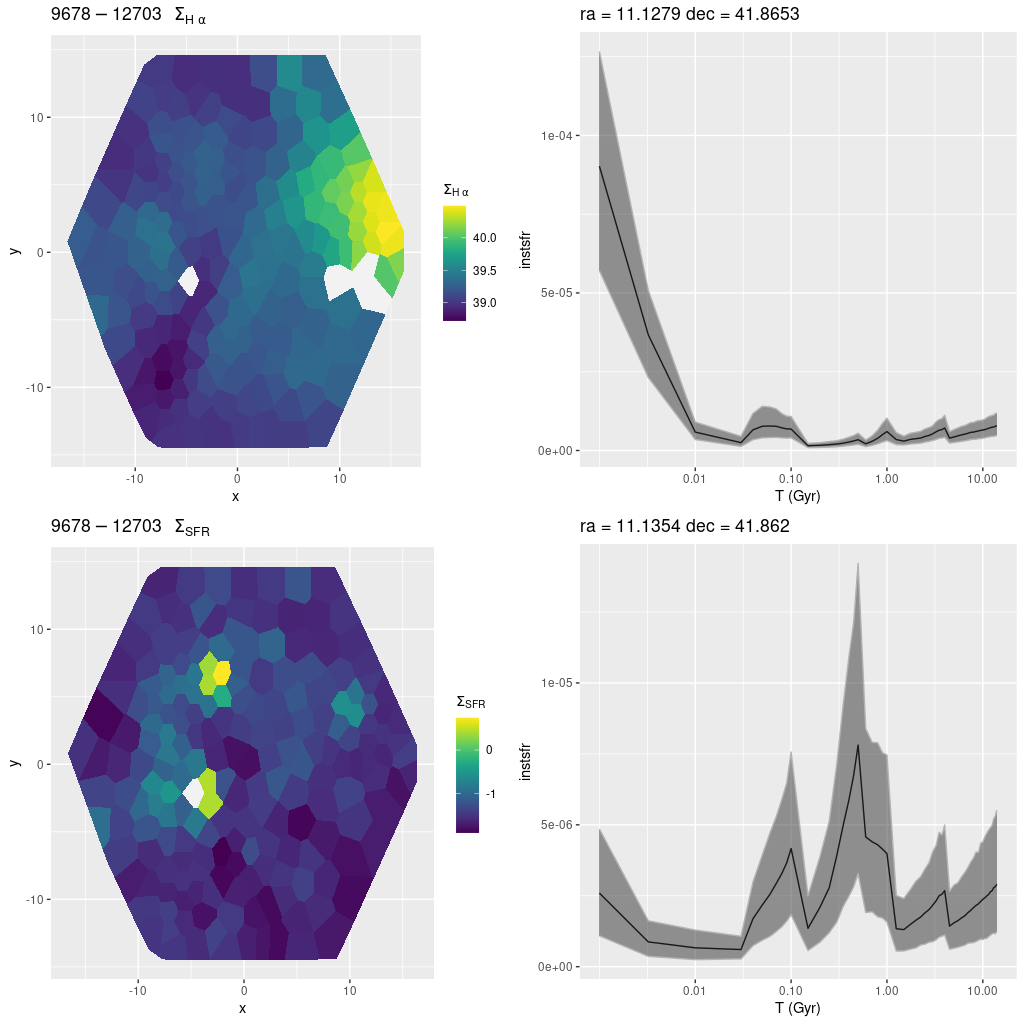
Nevertheless I consider the model results to be highly suspect, mainly based on the very large optical depth. Massey estimates the attenuation for the red supergiant to be AV ≈ 1.18, although this is apparently based on a formula rather than a direct empirical estimate. But another piece of evidence that’s close to a smoking gun is an estimate based on the Balmer decrement of emission. Despite the lack of apparent ionizing sources outside the bright H II regions in the west there is widespread diffuse emission in this region with star-forming like line ratios. The estimated optical depth derived from the Balmer decrement for this region is τV, bd = 1.47 ± 0.23 (1σ), reasonably consistent with the Massey estimate and with the values derived for the rest of the IFU.

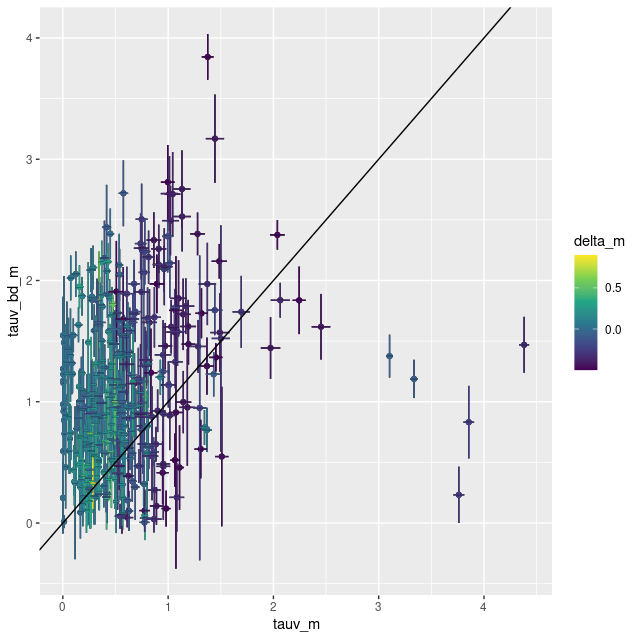
How widespread a problem is this? Below I plot the Balmer decrement derived optical depths against the stellar based estimates for all spectra in M31 MaNGA with star forming emission line ratios, about 11% of the entire sample. The 5 most extreme outliers are in this IFU in the regions surrounding the two bright red supergiants (the masked spectrum would also be in this region of the plot). The same 5 regions are also extreme outliers in the SFR vs. stellar mass and SFR vs. Hα plots that I showed early on. So, even though there are many cataloged supergiants in the study region these two appear to be uniquely bright and to have had the largest impact on model results.

M31 MaNGA – Optical depth off attenuation estimated from Balmer decrement vs. model values of τV

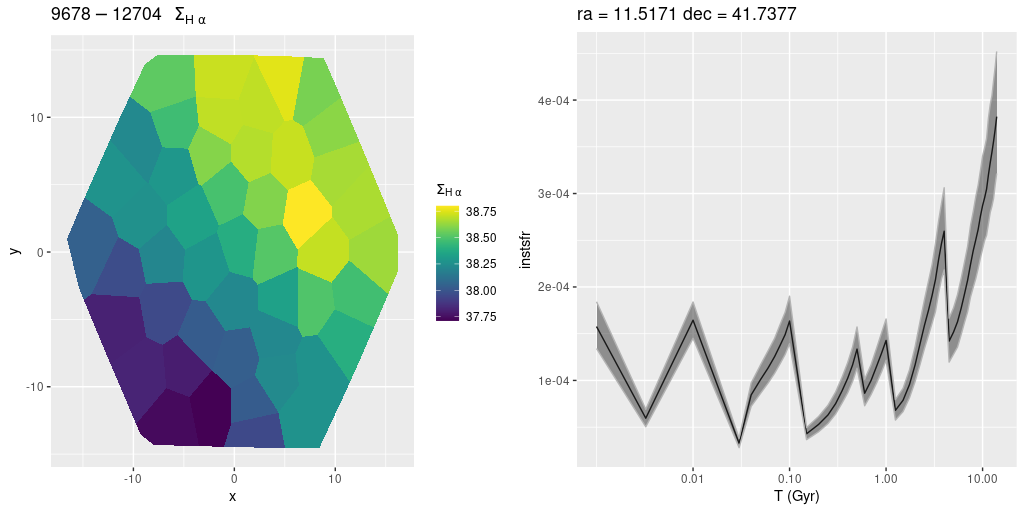
Of course there are hotter bright stars in the study area and these could affect results in different and possibly unexpected ways. For example the outermost IFU contains one bright star that GAIA estimates has a surface temperature of 5500 C, which would make it a G supergiant if it’s in M31. I noted in the last post that the model star formation history for that region looks like a post starburst with an age around 800 Myr. This is, I think, several galactic rotation periods, and stars born that long ago should have dispersed by now unless they’re gravitationally bound. There’s no sign of a star cluster there nor is there a cataloged one nearby, so it seems likely to me that the “starburst” is an artifact. As I noted in the last post though the fit to the data is quite good.

These examples illustrate an issue that’s fairly well known, which is that using simple stellar populations as building blocks of low mass stellar systems are potentially affected by so-called “stochastic” effects, which simply means that the distribution of stellar masses can vary randomly from what’s assumed in the SSP models. Specifically, in M31 there are individual stars luminous enough to affect spectra. One possible solution might be to add some stellar spectra to the library. I might give that a try some day.

I’m going away and won’t be writing for a while. I’m hoping to acquire or build a SSP model library based on SDSS MaStar spectra yet this year. This is a much larger collection of stellar spectra than has been previously available and it has the advantage of having the same flux calibration and (approximately) spectral resolution as the SDSS galaxy spectra. I also plan to return to my study of post-starburst galaxies.

MaNGA in M31 — details part 4

On to the final batch, which I don’t think is going to be very interesting.

plateifu 9678-12704 (mangaid 52-22)

If my calculations reported in the last post are correct this is well in the outer disk at a distance of about 15.4 kpc from the nucleus. Other than that there’s nothing much to say about it. There are no cataloged objects of interest in the IFU footprint. There is diffuse emission with a fairly strong gradient decreasing from northwest to southeast, which is basically moving outward in the disk. There may be low level ongoing star formation.

plateifu 9678-12704 (M31 outer) (L) Hα luminosity density (uncorrected) (R) SFH summed over IFU footprint

plateifus 9678-6103 and 9678-12702 (mangaid 52-19 and 52-24)

These are both in interarm regions with absolutely no cataloged objects of interest and complete blanks in the Galex false color image. Even diffuse emission is too weak to detect confidently. All regions in both show very low recent star formation with a long period of quiescence.

plateifu 9678-12701 (mangaid 52-25)

Finally, this is the outermost IFU in the program, located an estimated 15.7 kpc from the nucleus and very close to the major axis. Somewhat oddly it’s close to the most vigorously star forming region in this segment of the outer disk but offset by a little more than an IFU width. In fact in the Galex image it appears to be in a sort of notch with few UV bright sources.

MaNGA plateifu 9678-12701 (M31 outer disk) Cutout from PHAT color image retrieved in Aladin.

No H II regions are cataloged within the IFU footprint but there is diffuse emission throughout with mostly starforming-like line ratios. The region with the highest modeled star formation rate is in the western corner of the IFU, where a number of blue stars can be seen in the PHAT color cutout. There is a single, somewhat isolated bright star near the center of the IFU. The SFH model for that region is in the lower right panel below. The model indicates a rather strong and short burst of star formation a little less than a Gyr ago. How much the model is influenced by the star is hard to say. The fit to the data is actually rather good. The star may be in the foreground: In Gaia DR3 (data retrieved through Aladin) its distance is listed as 2395 pc, which would obviously place it in the Galaxy. But that is based on estimates of its surface temperature and gravity rather than parallax, which is measured as negative and consistent with 0.

MaNGA plateifu 9678-12701 (M31 outer disk) (TL) Hα luminosity density (uncorrected) (BL) model star formation rate density (TR) Star formation history for region with highest SFR density (BR) SFH for a region with a bright star
MaNGA plateifu 9678-12701 (M31 outer disk) posterior predictive fit to the spectrum of a region with a bright star

After looking through all the data again I have to say I’m puzzled by some of the choices of IFU locations. All but 5 are in or very close to spiral features visible in Galex, but most are offset by as little as an IFU width from regions with more star forming activity. Even plateifu 9678-12703, which is very close to the most active starforming region in the PHAT coverage area, only captures the edge of a series of bright H II regions.

Overall I think the SFH models are successful with some caveats. Areas associated with bright Hα emission are generally showing increasing recent star formation rates reasonably consistent with the level of emission. It’s interesting that there are often nearby regions (separations ~10 pc or so) that have recently peaked but with high 100 Myr averaged SFR. This suggests we can actually see propagation of star formation over short distances and time scales.

A big concern is the effect of sampling small stellar mass regions, and in particular the effect of exceptionally luminous stars on model results. I plan to address this in a follow-up sometime soon.

MaNGA in M31 — details part 3

Before I get into details of the individual IFUs here is the result of a little exercise I did to estimate the deprojected positions of the IFU centers using the canonical values of 77° for the inclination and 38° for the major axis position angle, and applying the coordinate conversions I outlined way back in this post with slight modifications. These are fairly rough estimates since Andromeda’s disk is apparently warped and rather thick, but this may help give some perspective on relative positions in the plane of the galaxy. For reference I’ve drawn semcircles at 6, 10, and 16 kpc, and circled the IFUs that I had placed in the 10 kpc ring. Two of the IFUs — plateifus 9678-6102 and 9678-9102 — now appear to be at or beyond its outer edge at radii of 12.9 and 13.5 kpc, while plateifu 9678-9101 which I had assigned to the outer desk is a bit closer at 12.1 kpc. But, no matter. I will discuss them in the same order as I presented the IFU wide star formation histories several posts ago.

Approximate deprojected coordinates of M31 MaNGA IFUs. Coordinates are in kiloparsecs relative to the galaxy center, with the X axis parallel to the major axis and increasing to the northeast.

plateifu 9677-9102 (mangaid 52-1)

This is already a recurring theme. There is a single cataloged H II region within the IFU footprint that coincides with the highest (uncorrected) Hα luminosity density bin below. The bin with the highest (100 Myr) SFR density is displaced by several parsecs to the northeast. The first region has an increasing star formation rate over the last ~30 Myr, while the second shows a sharp peak and rapid decline over the last 10 Myr. If the models are remotely correct this is clear evidence for propagation of star formation over short distances.

plateifu 9677-9102 (M31 10 kpc ring). (TL) Hα luminosity density. (BL) SFR density (100 Myr average) (TR) SFR history for the region with highest Hα density. (BR) SFR history for the region with highest SFR density.

plateifu 9677-12702 (mangaid 52-7)

Despite being right in the middle of the 10 kpc ring there’s nothing very interesting in this IFU, with just a single cataloged red supergiant and a small and rather faint H II region that’s at or beyond the edge of the footprint. Only weak diffuse emission is seen in the MaNGA data. Nevertheless there are a few areas with evidence for recent star formation:

9677-12702_sfr_2bins
plateifu 9677-12702 (M31 10 kpc ring) (L) map of SFR density (R) star formation histories for 2 regions with higher than average SFR density.

I recently noticed that one of the imaging products available in Aladin is a color composite assembled from the PHAT F475W and F814W ACS/WFC observations. One thing these are good for is they give you a very rough idea of stellar temperatures. To my eyes at least stars appear orange, white, or blue. Bright blue stars must be young; bright orange ones are evolved (or reddened by dust perhaps) and might be young or old. Notice below that the two areas with relatively high star formation have a sprinkling of bright blue stars, while the bulk of the field contains predominantly orange ones.

The other optical wavelength imaging I look at comes from SDSS. Even though the imaging in this area is incomplete and the processing leaves something to be desired it does have the virtue that Hα is, at low redshift, in the r filter, which forms the green channel in their images. M31 H II regions then are identifiable by their green color. Also, red supergiants look distinctly red since their brightness is still increasing into the near IR.

plateifu 9677-12702 (M31 10 kpc ring) Cutout of PHAT color composite taken from Aladin

plateifu 9678-6102 (mangaid 52-20)

This lies on the outer edge of the 10 kpc ring, some distance from UV bright sources and H II regions. There is one cataloged planetary nebula and that shows up in my modeling as a region with “AGN” like emission line ratios. One fiber has a much higher modeled specific star formation rate than its surroundings. A map of SSFR and star formation history for that region are shown below. There are bright red and yellow stars in the region which might be (uncatalogued?) red supergiants.

MaNGA plateifu 9678-6102 (M31 10 kpc ring) (L) map of model specific star formation rate (R) star formation history for the region with highest SSFR

9678-9102 (mangaid 52-18)

This is the final IFU on the eastern side of the 10 kpc ring. Once again it lies at the outer edge, well away from active star forming regions. There is weak emission throughout, with star forming line ratios through much of the IFU footprint despite the lack of evident star forming regions. There’s some unresolved UV emission in the GALEX color image that roughly corresponds in location to the area of brighter Hα.

The region with the greatest recent star formation has some fairly bright blue and yellow stars in the PHAT color image

plateifu 9678-9102 (M31 10 kpc ring) (TL) Hα luminosity density (TR) BPT classiication by [N II]/Hα vs {O III]]/Hβ diagnostic (BL) 100Myr average specific star formation rate (BR) model star formation history for the region with highest SSFR

By the way I do check observational quantities in my models against the SDSS product Marvin now and then. Here’s their rendering of the Hα flux:

9678-9101 (M31 10 kpc ring) Marvin measurement of Hα flux [link]

Qualitatively at least the agreement is excellent. I’d have to check if their fluxes are consistent with my log-luminosities.

plateifu 9678-12703 (mangaid 52-23)

Finally we get to the most interesting IFU in the project, plateifu 9678-12703, which lies very close to the region with the highest recent star formation in the northeastern half of the galaxy. It also appears to coincide in position with one of the regions that Lewis et al. (2015) highlighted (their Figure 2). As can be seen in the Aladin cutouts (from SDSS and PHAT color images) below there are several young stellar objects within and near the IFU footprint: at least two red supergiants (which are a problem); 3 catalogued H II regions, one of which is bright and extended; some OB associations that are centered outside the footprint; and one open star cluster. There are a number of bright blue stars scattered throughout as can be seen in the color PHAT image.

9678-12703_cutouts
plateifu 9678-12703 (M31 10 kpc ring) Symbols: yellow circle: H II region red circle: red supergiant purple oval: star cluster blue rhombus: OB association blue squares: IFU outline

Plotted below are maps of Hα luminosity density and model star formation rate density, along with model star formation histories for two regions. The first is for the bins in the brightest part of the H II region along the western edge of the IFU. The second is for two bins at the position of a cataloged open cluster (Johnson et al. 2016) that’s fairly obvious in the PHAT cutout. The cataloged (log) age of the cluster is 8.4-0.1+0.3 with a mass around 104 M. The peak star formation rate in the model history below (bottom right) is at about 500 Myr lookback time with several hundred Myr of enhanced star formation, so this is pretty good agreement.

plateifu 9678-12703 (M31 10 kpc ring) (TL) Hα luminosity density (uncorrected) (BL) model star formation rate density (TR) star formation history for areas with highest Hα luminosity. (BR) SFH for a region covering a cataloged open cluster

When I did my initial fitting runs on this IFU I noticed one fit that was rather poor which I attributed to a foreground star, and therefore I masked it for subsequent analysis. It turned out though the culprit was not a foreground star but instead a local red supergiant that’s been cataloged (for example) by Ren et al. (2021). Their catalog lists its G band magnitude from Gaia DR2 as 19.1 which makes its absolute magnitude around -5.3, a reasonable value for its presumed spectral type.

This raises an issue that’s fairly well known. Simple stellar population models assume the age zero main sequence is fully occupied according to a well defined initial mass function. This is a fairly innocuous assumption (although the choice of IMF is not) when we’re sampling ~billion solar mass regions, but it’s not so innocuous for cluster size agglomerations, which is what we’re sampling here1the typical binned region has a present day stellar mass around 104 M per my models. The particular problem here is that a single red supergiant is making a significant contribution to the spectrum in the red, and that could be biasing the model SFH in as yet unexplored ways.

The bin at the position of the other bright supergiant in the footprint was analyzed, so lets take a quick look. In the top pane below is the model star formation history, and in the two below the (posterior predictive) fit to the data and the residuals from same. The fit doesn’t look so bad except for a region around 7200 Å, which often seems to be a problem with EMILES spectra.

Superficially the model star formation history looks not implausible, and similar to others I’ve shown. The presence of an evolved star indicates a stellar age in the right general range, as does the relative lack of H II emission. Despite the strength of the burst it adds only about 7% to the present day stellar mass, with as elsewhere the majority of the stellar mass was in place by 8 Gyr ago (per the model, as always).

But, there’s at least one indicator of a problem: the modeled optical depth of attenuation is extraordinarily high at τV ≈ 4.4, compared to the optical depth estimated from the Balmer decrement of τVbd = 1.47 ± 0.23. I plan to discuss this in more detail in a future post, but for now I’m moving on.

plateifu 9678-12703 (M31 10 kpc ring) model star formation history for a region with high recent SFR

plateifu 9678-9101 (mangaid 52-26)

As mentioned at the top this appears to be in a spur off the 10 kpc ring. There is just one cataloged H II region within the footprint that appears to be compact. Just to the west there is a sprinkling of bright blue stars and an unresolved blob in the Galex color image. The H II region is evident in the map below. Once again the regions with the highest Hα luminosity and highest (100 Myr averaged) star formation rate are slightly offset from each other. The model star formation histories are very similar though.

plateifu 9678-9101 (M31 10 kpc ring) (TL) Hα luminosity density (uncorrected) (BL) model star formation rate density (TR) star formation history for area with highest Hα luminosity. (BR) SFH for area with highest recent star formation rate

I’m going to stop for now and cover the last 4 outer disk IFUs in (probably) the next post.