
It took a few months but I did manage to analyze 28 of the 29 galaxies in the sample I introduced last time. One member — mangaid 1-604907 — hosts a broad line AGN and has broad emission lines throughout. That’s not favorable for my modeling methods, so I left it out. It took a while to develop a more or less standardized analysis protocol, so there may be some variation in S/N cuts in binning the spectra and in details of model runs in Stan. Most runs used 250 warmup and 750 total iterations for each of 4 chains run in parallel, with some adaptation parameters changed from their default values1I set target acceptance probability adapt_delta to 0.925 or 0.95 and the maximum treedepth for the No U-Turn Sampler max_treedepth to 11-12. A total post-warmup sample size of 2000 is enough for the inferences I want to make. One of the major advantages of the NUTS sampler is that once it converges it tends to produce draws from the posterior with very low autocorrelation, so effective sample sizes tend to be close to the number of samples.
I’m just going to look at a few measured properties of the sample in this post. In future ones I may look in more detail at some individual galaxies or the sample as a whole. Without a control sample it’s hard to say if this one is significantly different from a randomly chosen sample of galaxies, and I’m not going to try. In the plots shown below each point represents measurements on a single binned spectrum. The number of binned spectra per galaxy ranged from 15 to 153 with a median of 51.5, so a relatively small number of galaxies contribute disproportionately to these plots.
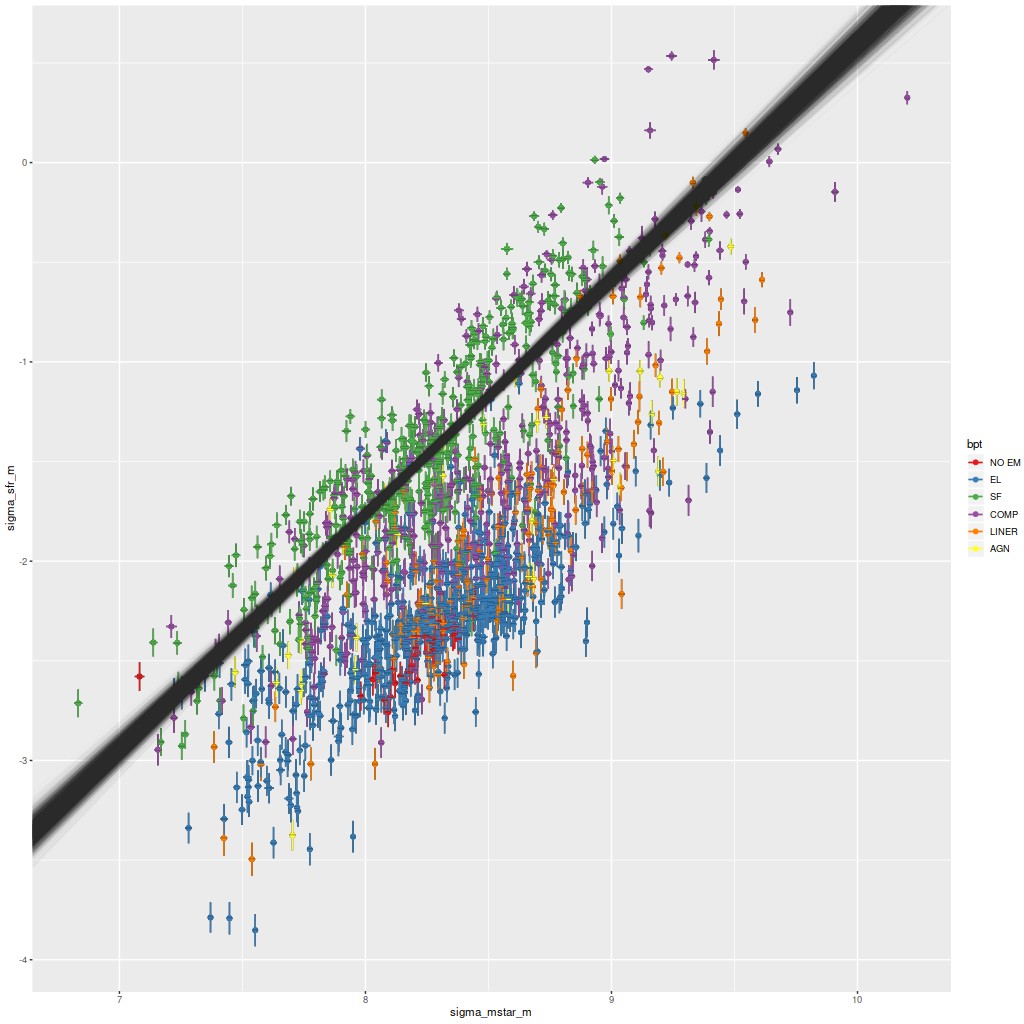
One of the more important empirical results in extragalactic astrophysics is the existence of a fairly well defined and approximately linear relationship between stellar mass and star formation rate for star forming galaxies, which has come to be known as the “star forming main sequence.” Thanks to CALIFA and MaNGA it’s been established in recent years that the SFMS extends to subgalactic scales as well, at least down to the ∼kpc resolution of these surveys. This first plot is of the star formation rate surface density vs. stellar mass surface density, where recall my estimate of SFR is for a time scale of 100 Myr. Units are \(\mathrm{M_\odot /yr/kpc^2} \) and \(\mathrm{M_\odot /kpc^2} \), logarithmically scaled. These estimates are uncorrected for inclination and are color coded by BPT class using Kauffmann’s classification scheme for [N II] 6584, with two additional classes for spectra with weak or no emission lines.
If we take spectra with star forming line ratios as comprising the SFMS there is a fairly tight relation: the cloud of lines are estimates from a Bayesian simple linear regression with measurement error model fit to the points with star forming BPT classification only (N = 428). The modeled relationship is \(\Sigma_{sfr} = -11.2 (\pm 0.5) + 1.18 (\pm 0.06)~ \Sigma_{M^*}\) (95% marginal confidence limits), with a scatter around the mean relation of ≈ 0.27 dex. The slope here is rather steeper than most estimates2For example in a large compilation by Speagle et al. (2014) none of the estimates exceeded a slope of 1., but perhaps coincidentally is very close to an estimate for a small sample of MaNGA starforming galaxies in Lin et al. (2019). I don’t assign any particular significance to this result. The slope of the SFMS is highly sensitive to the fitting method used, the SFR and stellar mass calibrators, and selection effects. Also, the slope and intercept estimates are highly correlated for both Bayesian and frequentist fitting methods.
One notable feature of this plot is the rather clear stratification by BPT class, with regions having AGN/LINER line ratios and weak emission line regions offset downwards by ~1 dex. Interestingly, regions with “composite” line ratios straddle both sides of the main sequence, with some of the largest outliers on the high side. This is mostly due to the presence of Markarian 848 in the sample, which we saw in recent posts has composite line ratios in most of the area of the IFU footprint and high star formation rates near the northern nucleus (with even more hidden by dust).
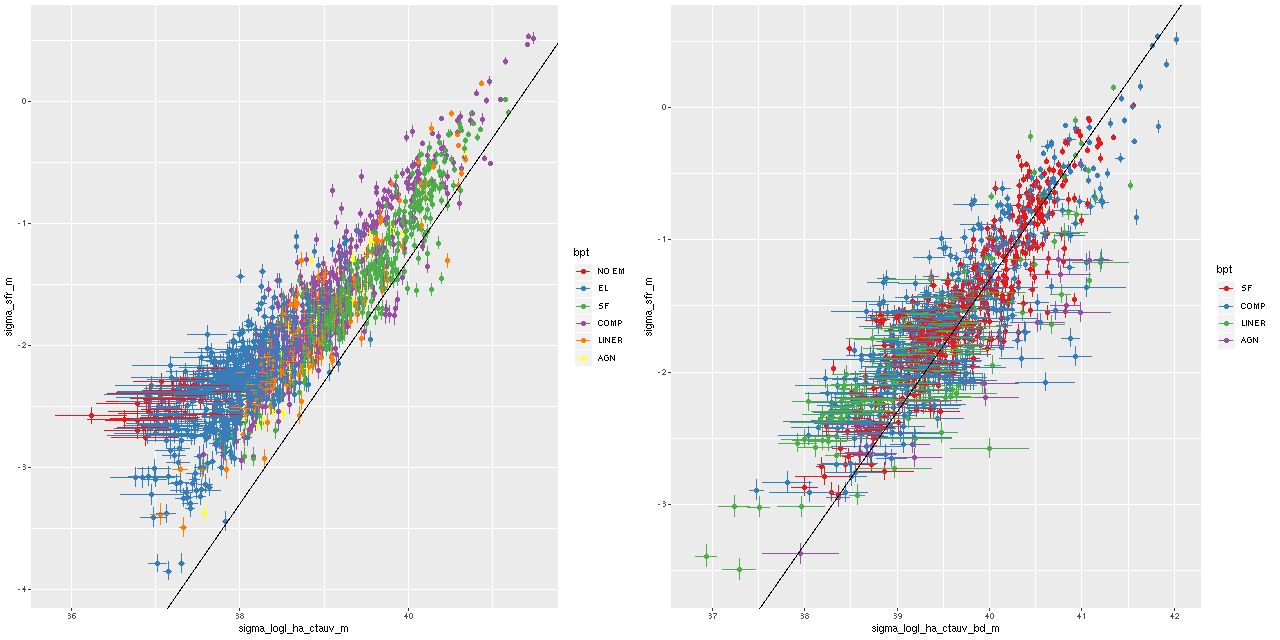
Another notable relationship that I’ve shown previously for a few individual galaxies is between the star formation rate estimated from the SFH models and Hα luminosity, which is the main SFR calibrator in optical spectra. In the left hand plot below Hα is corrected for the estimated attenuation for the stellar component in the SFH models. The straight line is the SFR-Hα calibration of Moustakas et al. (2006), which can be traced back to early ’90s work by Kennicutt.
Most of the sample does follow a linear relationship between SFR density and Hα luminosity density with an offset from the Kennicutt-Moustakas calibration, but there appears to be a departure from linearity at the low SFR end in the sense that the 100 Myr averaged SFR exceeds the amount predicted by Hα (which recall traces star formation on 5-10 Myr scales). This might be interpreted as indicating that the sample includes a significant number of regions that have been very recently quenched (that is within the past 10-100 Myr). There are other possible interpretation though, including biased estimates of Hα luminosity when emission lines are weak.
In the right hand panel below I plot the same relationship but with Hα corrected for attenuation using the Balmer decrement for spectra with firm detections in the four lines that go into the [N II]/Hα vs. [O III]/Hβ BPT classification, and therefore have firm detections in Hβ. The sample now nicely straddles the calibration line over the ∼ 4 orders of magnitude of SFR density estimates. So, the attenuation in the regions where emission lines arise is systematically higher than the estimated attenuation of stellar light. This is a well known result. What’s encouraging is it implies my model attenuation estimates actually contain useful information.
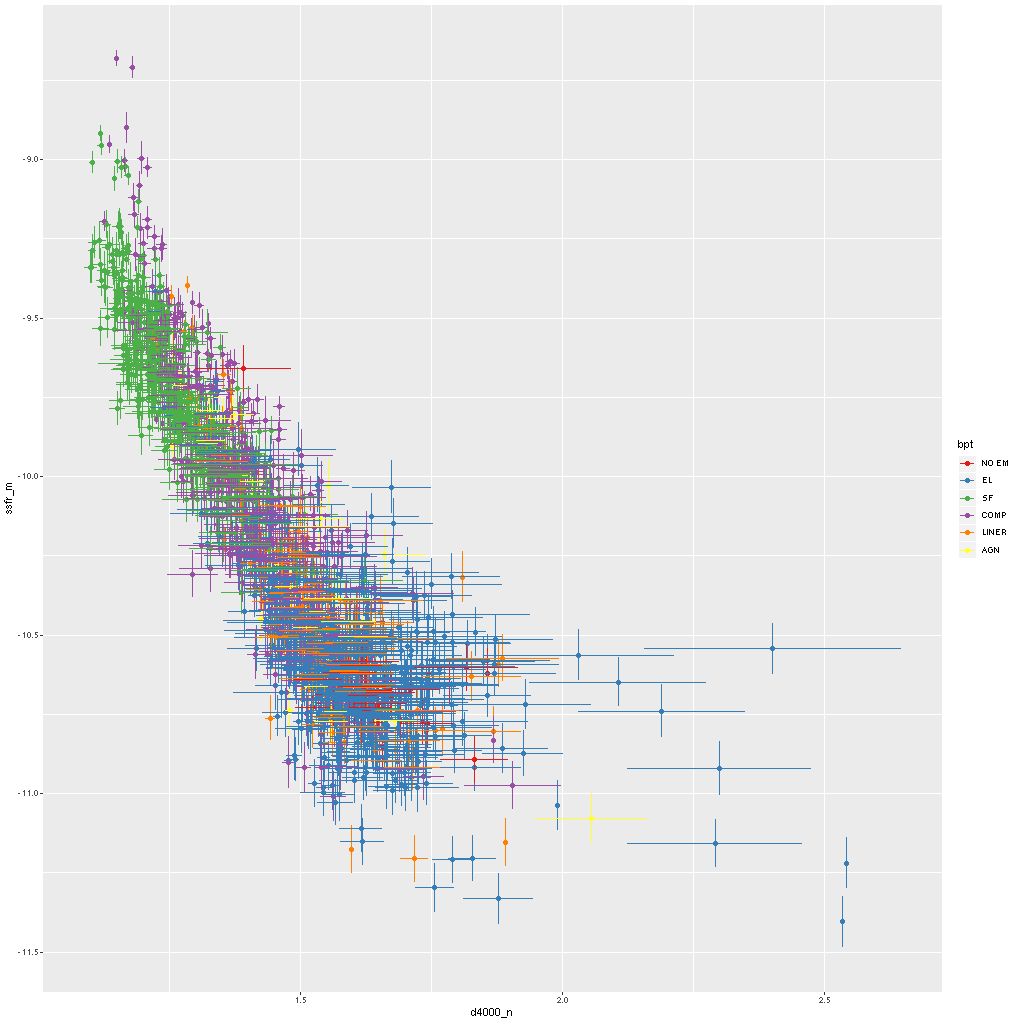
One final relation: some measure of the 4000Å break strength has been used as a calibrator of specific star formation rate since at least Brinchmann et al. (2004). Below is my version using the “narrow” definition of D4000. I haven’t attempted a quantitative comparison with any other work, but clearly there’s a well defined relationship. Maybe worth noting is that “red and dead” ETGs typically have \(\mathrm{D_n(4000)} \gtrsim 1.75\) (see my previous post for example). Very few of the spectra in this sample fall in that region, and most are low S/N spectra in the outskirts of a few of the galaxies.
Two obvious false positives in this sample were a pair of grand design spirals (mangaids 1-23746 and 1.382712) with H II regions sprinkled along the full length of their arms. To see why they were selected and verify that they’re in fact false positives here are BPT maps:
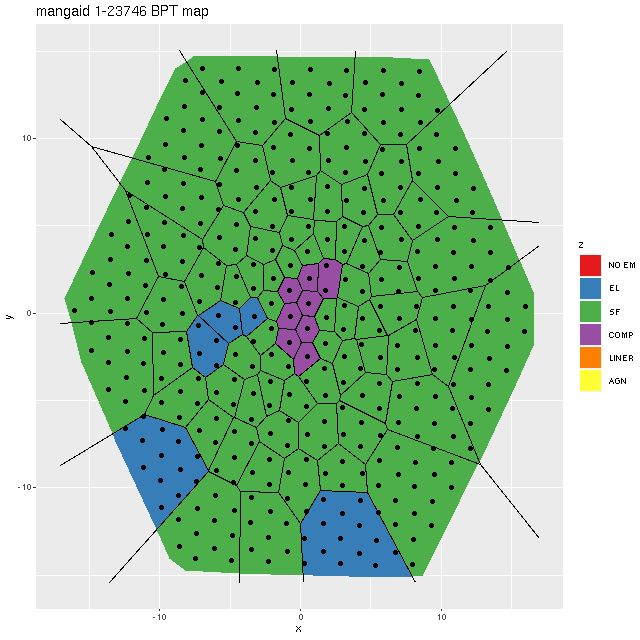
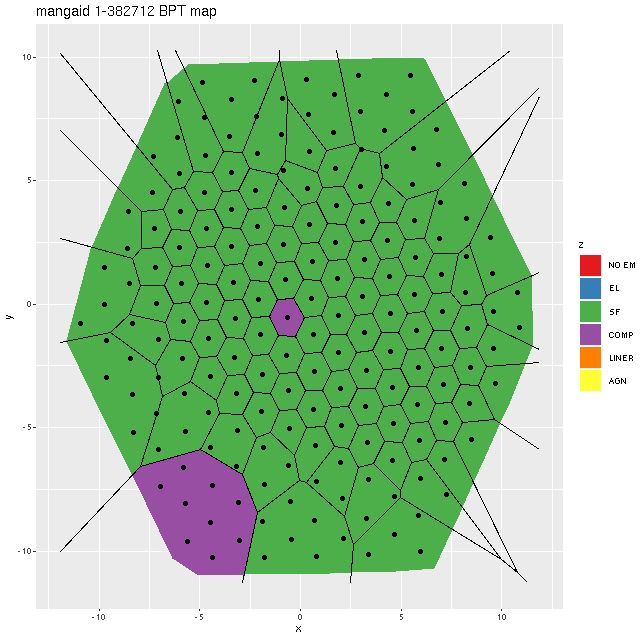
These are perfect illustrations of the perils of using single fiber spectra for sample selection when global galaxy properties are of interest. The central regions of both galaxies have “composite” spectra, which might actually indicate that the emission is from a combination of AGN and star forming regions, but outside the nuclear regions star forming line ratios prevail throughout.
These two galaxies contribute about 45% of the binned spectra with star forming line ratios, so the SFMS would be much more sparsely populated without their contribution. Only one other galaxy (mangaid 1-523050) is similarly dominated by SF regions and it has significantly disturbed morphology.
I may return to this sample or individual members in the future. Probably my next posts will be about Bayesian modelling though.