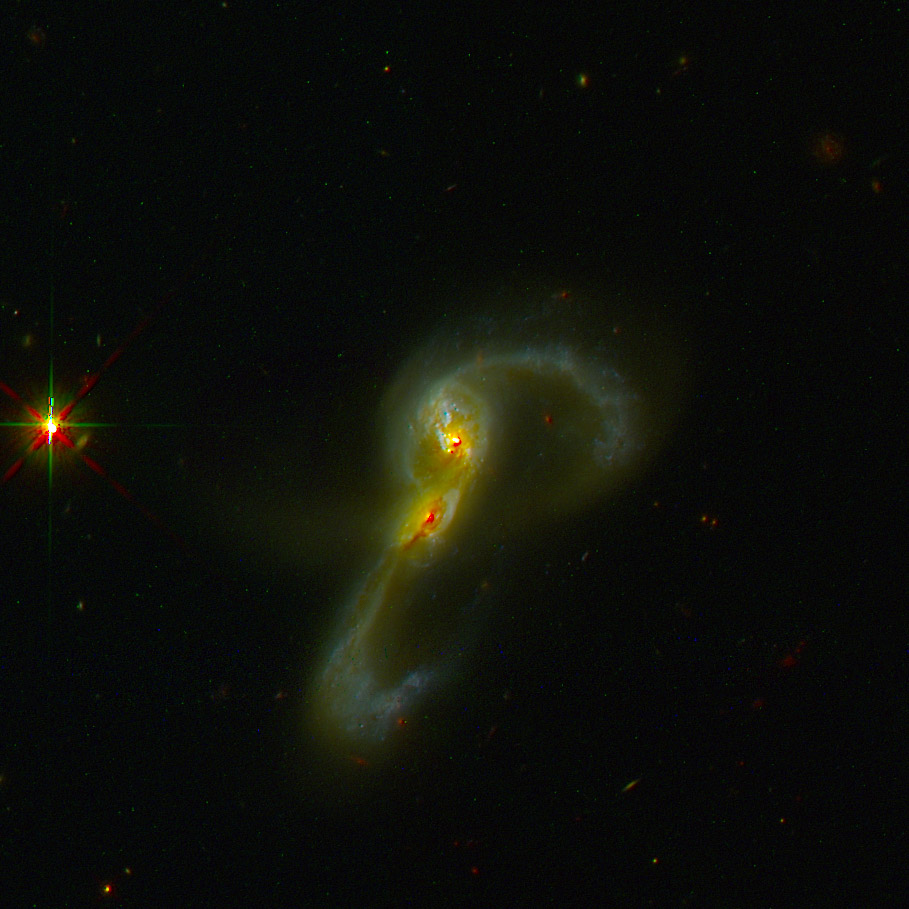
In this post I’m going to take a quick look at detailed, spatially resolved star formation histories for this galaxy pair and briefly compare to some of the recent literature. Before I start though, here is a reprocessed version of the blog’s cover picture with a different crop and some Photoshop curve and level adjustments to brighten the tidal tails a bit. Also I cleaned up some more of the cosmic ray hits.
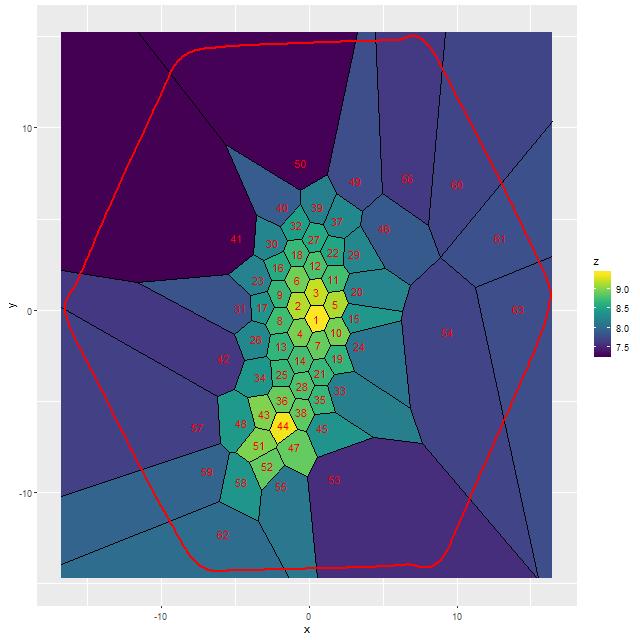
The SFH models I’m going to discuss were based on MaNGA data binned to a more conservative signal to noise target than in the last post. I set a target S/N of 25 — Cappellari’s Voronoi binning algorithm has a hard coded acceptance threshold of 80% of the target S/N, which results in all but a few bins having an actual S/N of at least 20. This produced a binned data set with 63 bins. The map below plots the modeled (posterior mean log) stellar mass density, with clear local peaks in the bins covering the positions of the two nuclei. The bins are numbered in order of increasing distance of the weighted centroids from the IFU center, which corresponds with the position of the northern nucleus. The center of bin 1 is slightly offset from the northern nucleus by about 2/3″. For reference the angular scale at the system redshift (z ≈ 0.040) is 0.8 kpc/” and the area covered by each fiber is 2 kpc2.
Although there’s nothing in the Voronoi binning algorithm that guarantees this it did a nice job of partitioning the data into physically distinct regions, with the two nuclei, the area around the northern nucleus, and the bridge between them all binned to single fiber spectra. The tidal tails are sliced into several pieces while the very low surface brightness regions to the NE and SW get a few bins.
I modeled star formation histories with my largest subset of the EMILES library consisting of SSP model spectra for 54 time bins and 4 metallicity bins. As in previous exercises I fit emission lines and the stellar contribution simultaneously, which is riskier than usual in this system because some regions, especially near the northern nucleus, have complex velocity structures producing emission line profiles that are far from single component gaussians. I’ll look at this in more detail in a future post, but for now let’s just take these SFH models at face value and see where they lead. As I’ve done in several previous posts what’s plotted below are star formation rates in solar masses/year over cosmic time, counting backwards from “now” (now being when the light left the galaxies about 500Myr ago). This time I’ve used log scaling for both axes and for the first time in these posts I’ve displayed results for every bin ordered by increasing distance from the IFU center. The first two rows cover the central ~few kpc region surrounding the northern nucleus. The southern nucleus covered by bin 44 is in row 8, second from left. Both the time and SFR scales are the same for all plots. The black lines are median posterior marginal estimates and the ribbons are 95% posterior confidence intervals.
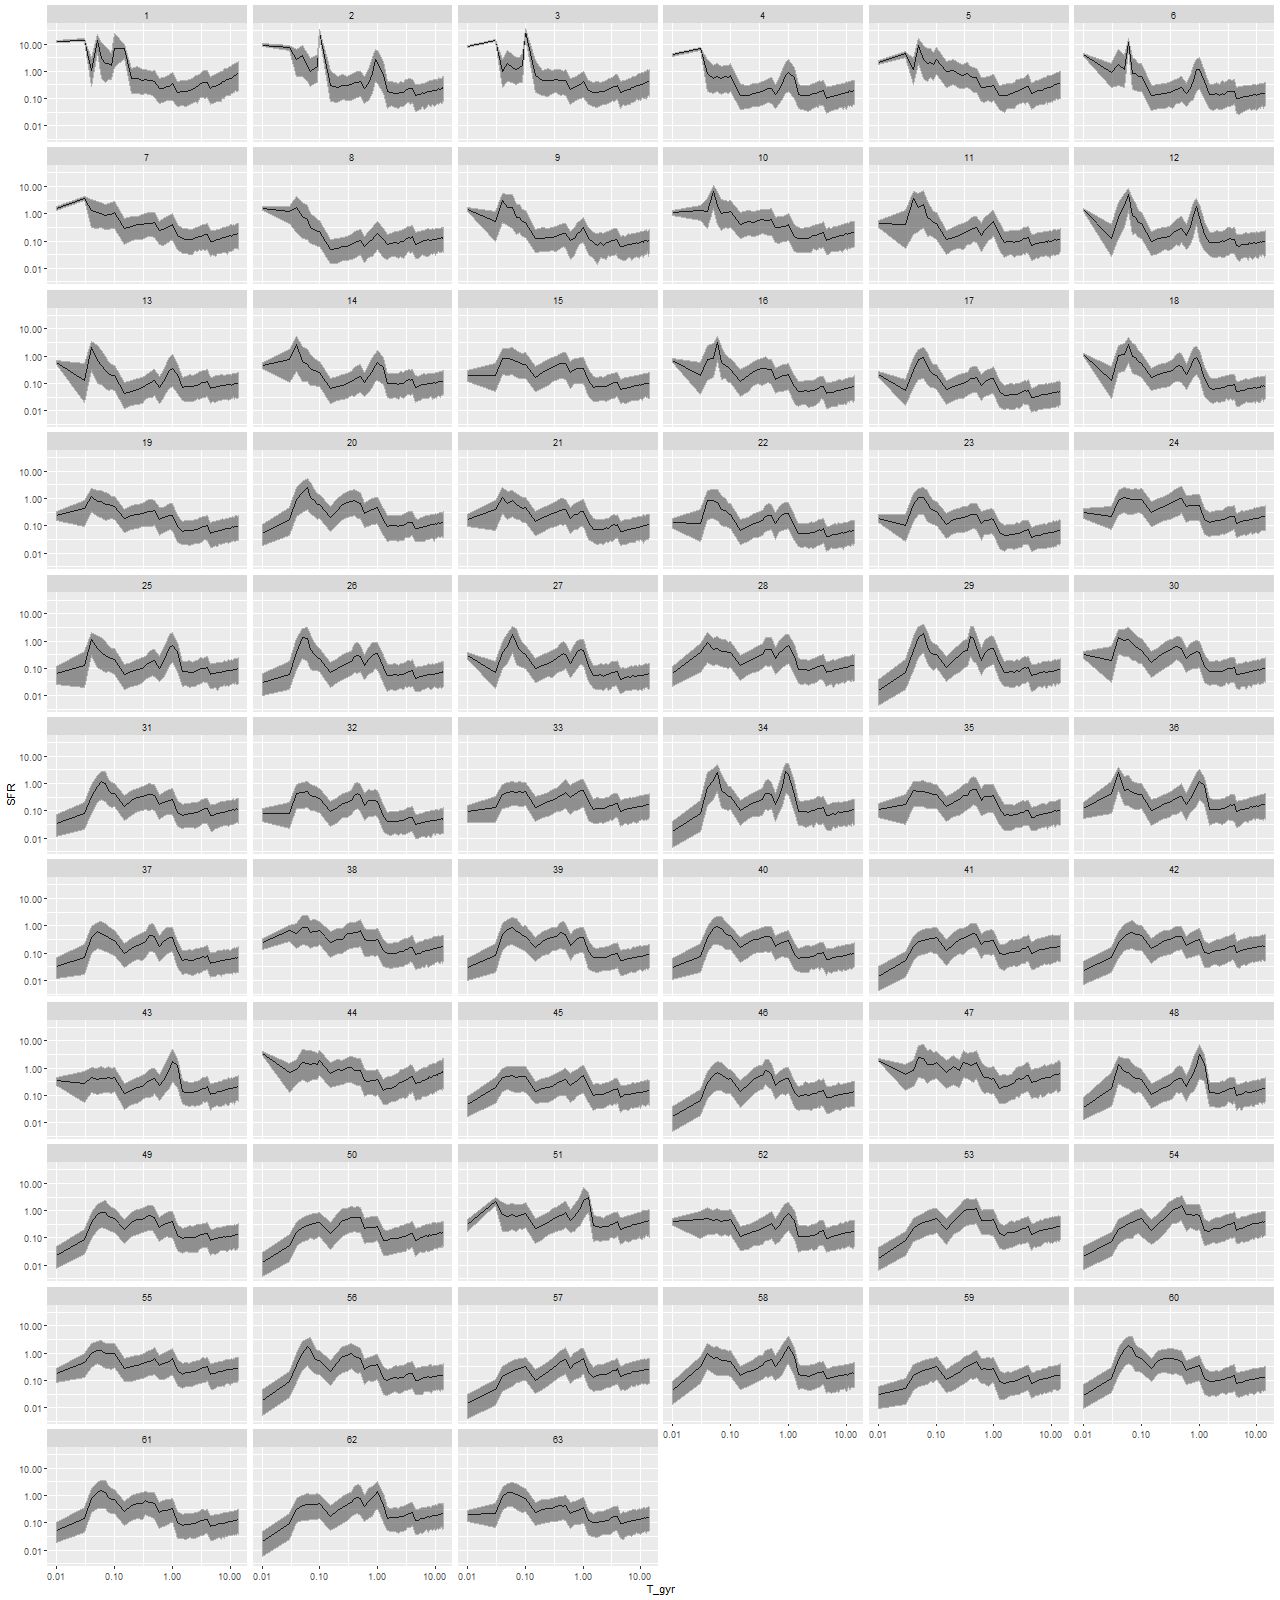
Browsing through these, all regions show ∼constant or gradually decreasing star formation up to about 1 Gyr ago1You may recall I’ve previously noted there is always an uptick in star formation rate at 4 Gyr in my EMILES based models, and that’s seen in all of these as well. This must be spurious, but I still don’t know the cause.. This of course is completely normal for spiral galaxies.
Most regions covered by the IFU began to show accelerated and in some areas bursts of star formation at ∼1 Gyr. In more than half of the bins the maximum star formation rate occurred around 40-60 Myr ago, with a decline or in some areas cessation of star formation more recently. In the central few kpc around the northern nucleus on the other hand star formation accelerated rapidly beginning ~100 Myr ago and continues at high levels. The southern nucleus has a rather different estimated recent star formation history, with no (visible) starburst and instead gradually increasing SFR to a recent maximum. Ongoing star formation at measurable levels is much more localized in the southern central regions and weaker by factors of several than the northern companion.
Here’s a map that I thought would be too noisy to be informative, but turns out to be rather interesting. This shows the spatial distribution of the lookback time to the epoch of maximum star formation rate estimated by the marginal posterior mean. The units displayed are log(age) in Myr; recall that I added unevolved SSP models from the 2013 update of the BC03 models to the BaSTI based SSP library, assigning them an age of 10Myr, so a value of 1 here basically means ≈ now.
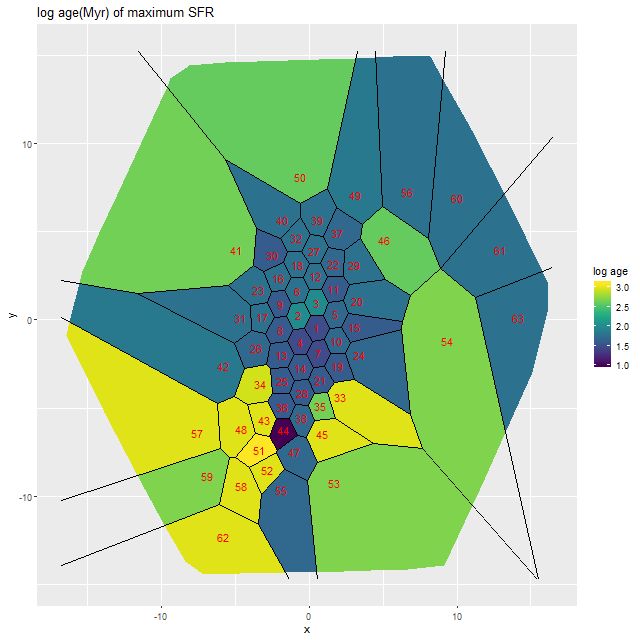
To summarize, there have been three phases in the star formation history of this system: a long period of normal disk galaxy evolution; next beginning about 1 Gyr ago widespread acceleration of the SFR with localized bursts; and now, within the past 50-100 Myr a rapid increase in star formation that’s centrally concentrated in the two nuclei (but mostly the northern one) while the peripheral regions have had suppressed activity.
I previously reviewed some of the recent literature on numerical studies of galaxy mergers. The high resolution simulations of Hopkins et al. (2013) and the movies available online at http://www.tapir.caltech.edu/~phopkins/Site/Movies_sbw_mgr.html seem especially relevant, particularly their Milky Way and Sbc analogs. They predict a general but clumpy enhancement of star formation at around the time of first pericenter passage; a stronger, centrally concentrated starburst at the time of second pericenter passage, with a shorter period of separation before coalescence. Surprisingly perhaps, the merger timescales for both their MW and Sbc analogs are very similar to my SFH models, with ∼ 1 Gyr between first and second perigalactic passage and another few 10’s of Myr to final coalescence.
I’m going to wrap up with maps of the (posterior mean estimates) of star formation rate density (as \(\log10(\mathsf{M_\odot/yr/kpc^2})\)) and specific star formation rate, which has units log10(yr-1). These are 100Myr averages and recall are based solely on the SSP template contributions.
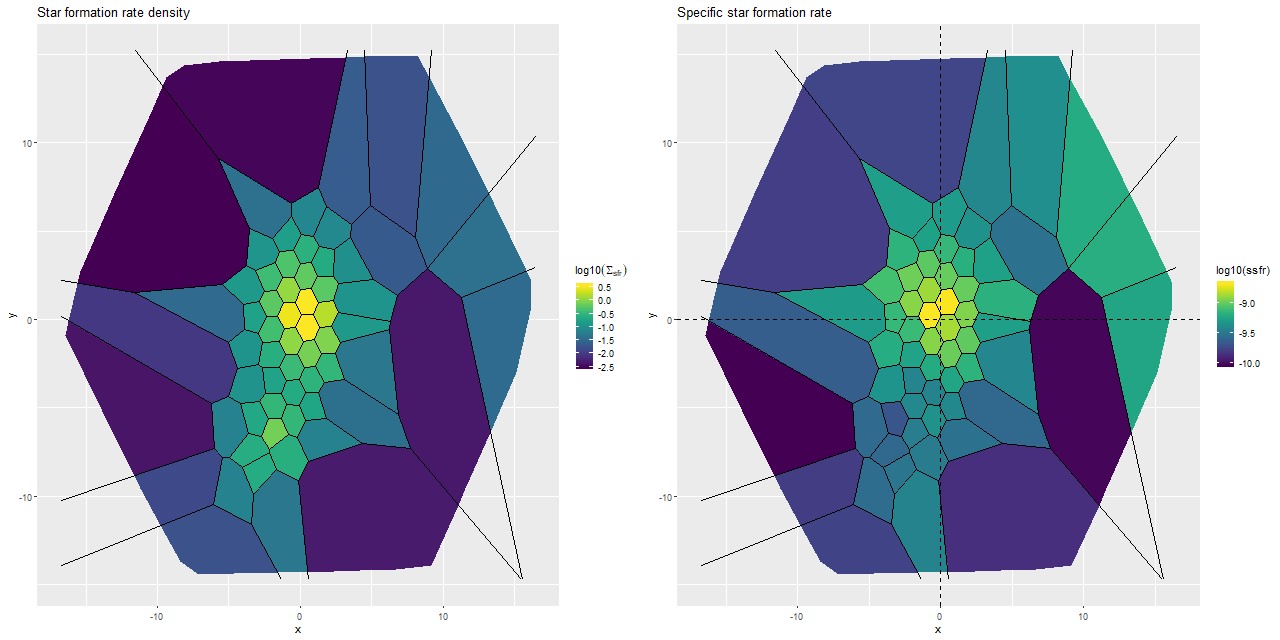
Several recent papers have made quantitative estimates of star formation rates in this system, which I’ll briefly review. Detailed comparisons are somewhat difficult because both the timescales probed by different SFR calibrators differ and the spatial extent considered in the studies varies, so I’ll just summarize reported results and compare as best as I can.
Yuan et al. (2018) modeled broad band UV-IR SED’s taking data from GALEX, SDSS, and Spitzer; and also did full spectrum fitting using ppxf on the same MaNGA data I’ve been examining. They divided the data into 5″ (≈ 4 kpc) radius regions covering the tidal tails and each nucleus. The broadband data were fit with parametric SFH models with a pair of exponential bursts (one fixed at 13Gyr, the other allowed to vary). From the parametric models they estimated the SFR in the northern and southern nuclei as 76 and 11 \(\mathsf{M_\odot/yr}\) (the exact interpretation of this value is unclear to me). For comparison I get values of 33 and 13 \(\mathsf{M_\odot/yr}\) for regions within 4 kpc of the two nuclei by calculating the average (posterior mean) star forming density and multiplying by π*42. They also calculated 100Myr average SFRs from full spectrum fitting with several different dust models and also from the Hα luminosity, deriving estimates that varied by an order of magnitude or more. Qualitatively we reach similar conclusions that the tails had earlier starbursts and are now forming stars at lower rates than their peak, and also that the northern nucleus has recent star formation a factor of several higher than the southern.
Cluver et al. (2017) were primarily trying to derive SFR calibrations for WISE W3/W4 filters using samples of normal star forming and LIRG/ULIRGs (including this system) with Spitzer and Herschel observations. Oddly, although they tabulate IR luminosities for the entire sample they don’t tabulate SFR estimates. But plugging into their equations 5 and 7 I get star formation rate estimates of just about 100 \(\mathsf{M_\odot/yr}\). These are global values for the entire system. For comparison I get a summed SFR for my models of ≈ 45 \(\mathsf{M_\odot/yr}\) (after making a 0.2 dex adjustment for fiber overlap).
Tsai and Hwang (2015) also used IR data from Spitzer and conveniently present results for quantities I track using the same units. Their estimates of the (log) stellar mass density, SFR density, and specific star formation rate in the central kpc of (presumably) the northern nucleus were 9.85±0.09, 0.43±0.00, and -9.39±0.09 respectively. For comparison in the fiber that covers the northern nucleus my models return 9.41±0.02, 0.57±0.04, and -8.84±0.04. For the 6 fibers closest to the nucleus the average stellar mass density drops to 9.17 and SFR density to about 0.39. So, our SFR estimates are surprisingly close while my mass density estimate is as much as 0.7 dex lower.
Finally, Vega et al. (2008) performed starburst model fits to broadband IR-radio data. They estimated a burst age of about 60Myr for this system, with average SFR over the burst of 225 \(\mathsf{M_\odot/yr}\) and current (last 10 Myr) SFR 87 \(\mathsf{M_\odot/yr}\) in a starforming region of radius 0.27kpc. Their model has optical depth of 33 at 1 μm, which would make their putative starburst completely invisible at optical wavelengths. Their calculations assumed a Salpeter IMF, which would add ≈0.2 dex to stellar masses and star formation rates compared to the Kroupa IMF used in my models.
Overall I find it encouraging that my model SFR estimates are no worse than factors of several lower than what are obtained from IR data — if the Vega+ estimate of the dust optical depth is correct most of the star formation is well hidden. Next time I plan to look at Hα emission and tie up other loose ends. If time permits before I have to drop this for a while I may look at two component dust models.
