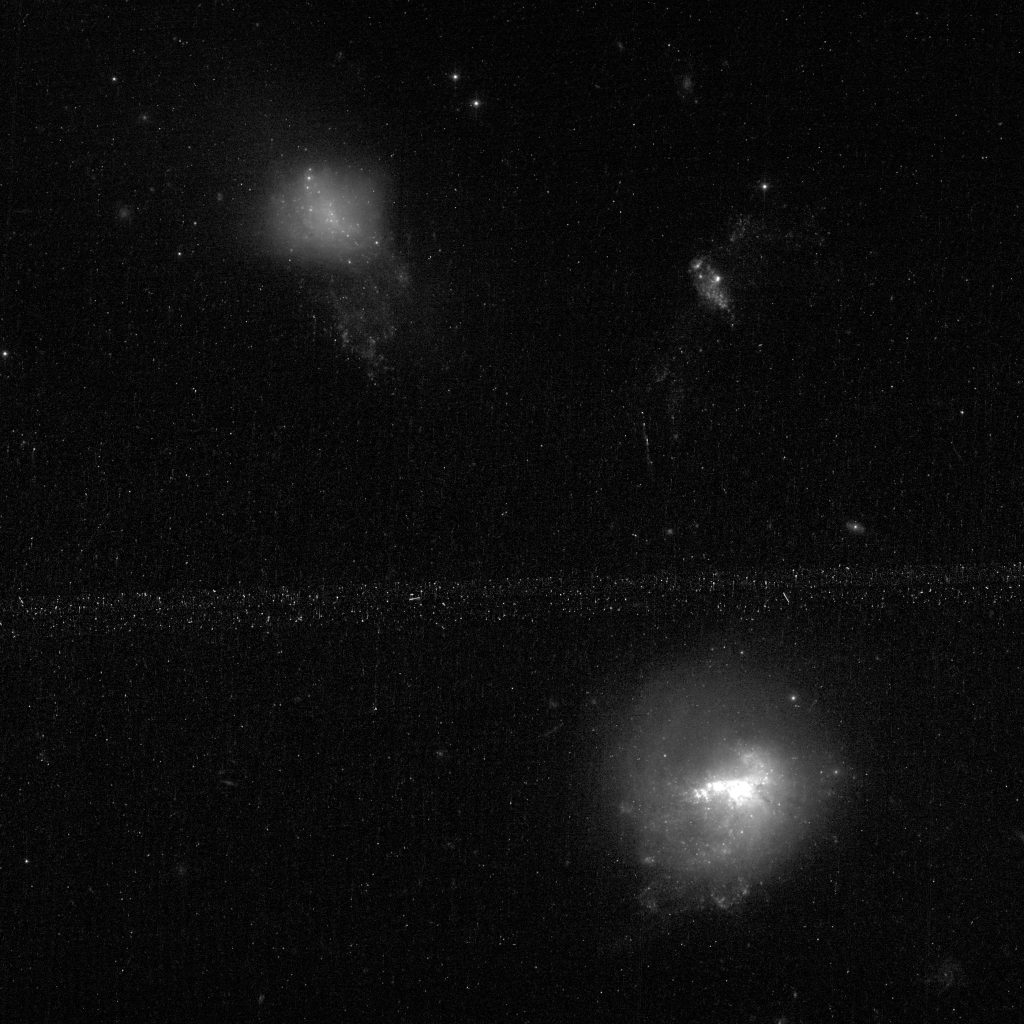
The Hubble Space Telescope “gap filler” program “Gems of the Galaxy Zoos” (proposal ID 15445, PI William Keel) had several prospective targets that I played a small role in selecting, and this recent HST observation was one of them. The actual target was the small disturbed galaxy at top left, which I will refer to as MCG +07-33-040. I don’t know if it was fortuitous that the larger and brighter UGC 10200 was also imaged in the same ACS field, but these are clearly interacting or at least have in the recent past, as is the small system in the upper right, which is identified as a blue compact galaxy with redshift z=0.00556 in Pustilnik et al. (1999). I’m going to focus on the top left galaxy in this post.
What interested me wasn’t the galaxy image so much as its SDSS spectrum, which has three interesting characteristics:
First, this is a classic post starburst galaxy spectrum with extremely strong Balmer absorption lines1My code measures the Lick index HδA as an exceptionally strong 8.06 ± 0.41 Å. and no obvious evidence of emission. In fact, although this designation isn’t used much anymore, it’s actually a classic “A+K” spectrum which reverses the usual “K+A” terminology to indicate the light is dominated by early type (i.e. young) stars. Second and third, the spectrum was misclassified as coming from a white dwarf star, and the redshift was erroneously estimated as around 0.004 which was the maximum allowed for stars in the SDSS data reduction pipeline. Using a variation of the code that I use to measure redshift offsets I get a robust value of z = 0.006682 ± 9E-06
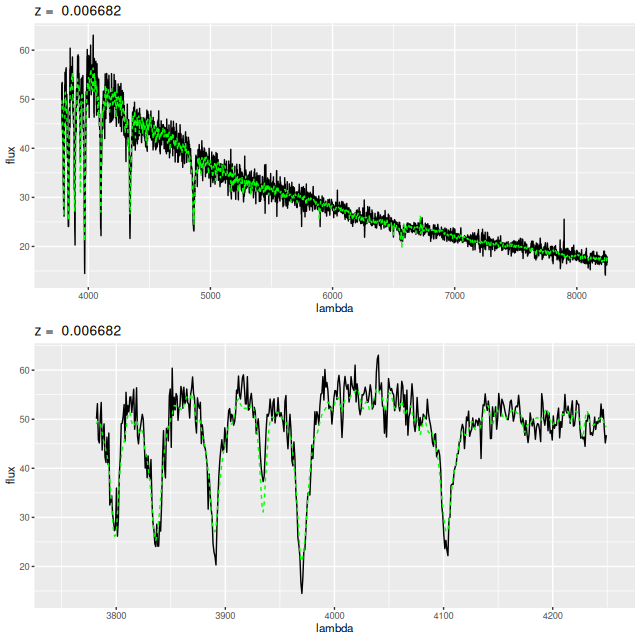
This is almost exactly the same redshift as its nearby companion UGC 10200 (also in the HST image above), which has a securely determined z = 0.00664
For the rest of this post I’m going to assume the Hubble flow redshift is the measured one, which with my adopted cosmological parameters2which for the record are H0 = 70 km/sec/Mpc, Ωm = 0.27, Ωλ = 0.73. make the luminosity distance 28.8 Mpc, the distance modulus m-M = 32.3 mag, and the angular scale 138 pc/” or about 7 pc per ACS pixel. The projected distance between the centers of the two bright galaxies in the HST image is about 96″ or 13.2 kpc.
I spent some time last weekend downloading and starting to learn the software Aperture Photometry Tool (APT), which is interactive software for manually performing aperture photometry. Zooming in on the center of the presumed post starburst galaxy I located the reported position of the SDSS fiber as closely as I could. In the screenshot below the aperture radius was set to 30 pixels, the same size as the SDSS spectroscopic fibers. I measured the F475W AB magnitude to be 17.90 ± 0.013 without sky subtraction, which is close enough to the SDSS g band fiberMag estimate of 18.05. The SDSS g band Petrosian magnitude estimate is 15.16, so the fiber contains about 7% of the total galaxy light.
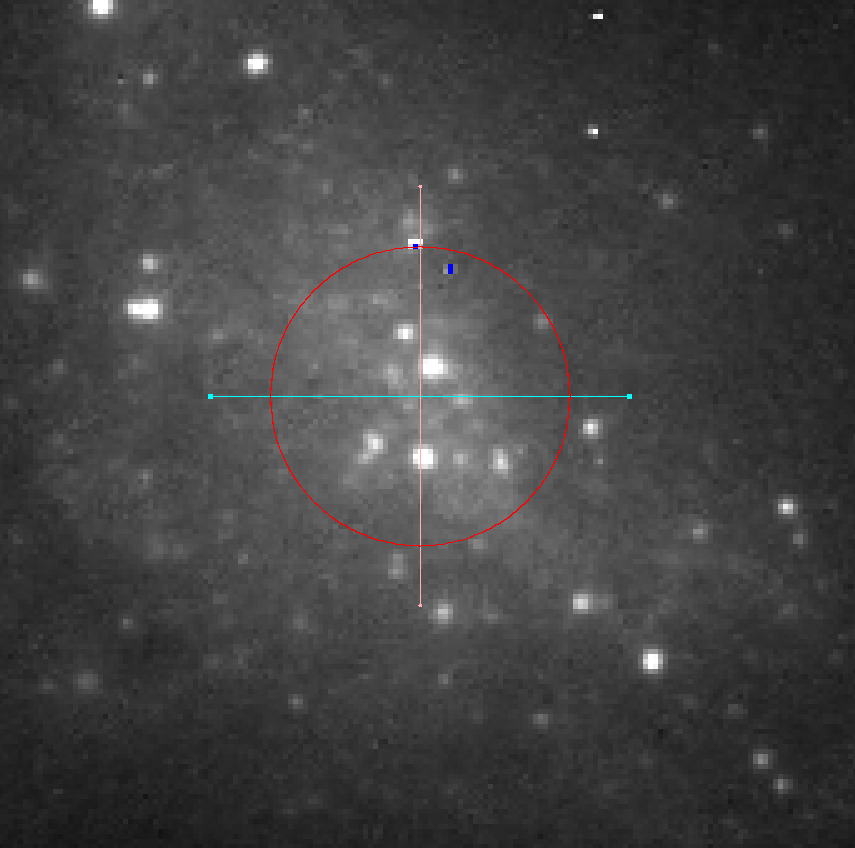
A striking feature of the HST image is there are many point-like symmetrical objects embedded within the otherwise nearly featureless diffuse light of the galaxy. Within the SDSS fiber footprint I count about 8-10 of these (the range being due to some uncertainty about what to call point-like and symmetrical). In order to get a handle on their contribution to the spectrum I did aperture photometry on them using a 3 pixel radius aperture with median sky subtraction from a 5 to 8 pixel radius annulus. The apparent magnitudes of the 5 brightest objects range from about 22.6 to 23.1. The summed luminosity of those 5 amounts to only 3.5% of the total light in the fiber, so the spectrum is mostly telling us something about the diffuse starlight. Even if one or more of those objects are foreground stars they can’t be a significant source of contamination. Clicking around the blank regions of the HST field I found fewer than one star per SDSS fiber size region, so it’s likely there are few if any foreground stars within the visible extent of the galaxy.
There is plenty of observational and theoretical evidence that massive star clusters are formed in mergers and close encounters of galaxies. As a coincidental example the merger remnant NGC 3921 — which was one of the 4 galaxies in my last post — has over 100 young globular clusters located both in the main body and southern tidal tail (Schweizer et al. 1996; Knierman et al. 2003). The brightest source in this galaxy (near the southern edge of the visible fuzz) has an apparent magnitude of m ≈ +21.7, which for the adopted distance modulus is M ≈ -10.6. With a solar g band absolute magnitude of 5.11 this corresponds to L ≈ 1.9×10⁶ L☉ . The 5 brightest objects within the fiber have absolute magnitudes between about -9.7 and -9.2. These would be quite luminous for galactic globular clusters, but they’re likely to be fairly young and would fade by at least a few magnitudes as they age.
I haven’t tried a more sophisticated analysis of these objects’ sizes, but using the APT radial profile tool the presumed clusters look little different from nearby foreground stars and all that I’ve examined have FWHM diameters around 2-2.5 pixels. A strict upper limit to their sizes is therefore around 14 pc.
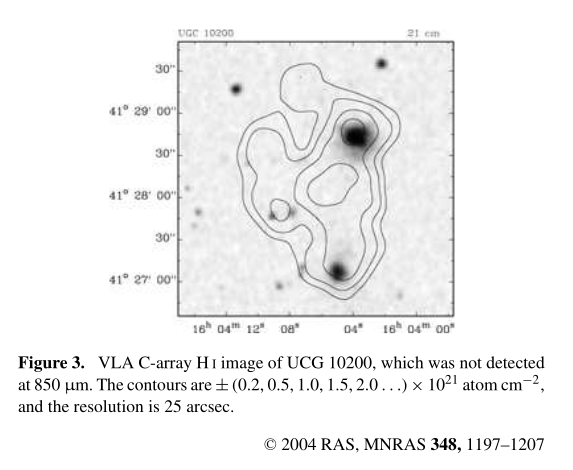
Someday I may undertake a complete census and luminosity function of the cluster system in this galaxy, and perhaps also look at the neighboring starburst galaxy UGC 10200. These systems by the way are cataloged as an interacting dwarf galaxy pair by Paudel et al. (2018) with a total stellar mass of log(M*) = 9.5 and a 3:1 mass ratio, which makes the estimated stellar mass of this galaxy just under 109 M☉. The system is very gas rich, with a neutral hydrogen mass estimated (by the same source) of 109.69 M☉. There are actually at least two published HI maps of this system. The one below, from Thomas et al. (2004) shows that atomic hydrogen extends over essentially the entire extent of the Hubble image above, including the target galaxy.
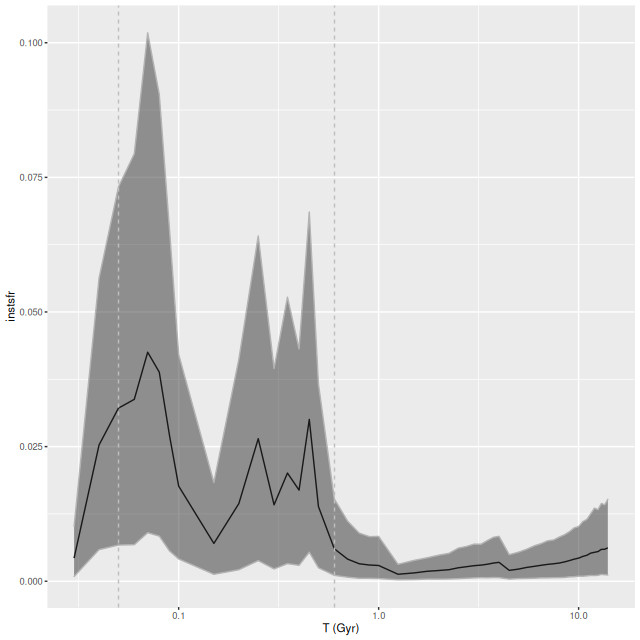
Next I turn to star formation history models for the post starburst spectrum at the top of the post. This uses the same Stan model code as my MaNGA investigations with some minor pre- and post-processing adjustments. I ran two separate models. One used a metal poor subset of the EMILES SSP libraries with Z ∈ {[-2.27], [-1.26], [-0.25]} with, as usual, Kroupa IMF and BaSTI isochrones. I did not attempt to append younger models, so the youngest age is 30Myr. For completeness I also ran a model with my usual EMILES subset + PYPOPSTAR models and Z ∈ {[-0.66], [-0.25], [+0.06], [+0.40]}. First, here is the modeled star formation history with the metal poor subset. I’ve again used a logarithmic time scale and linear star formation rate scale.
Next is the metal rich subset:
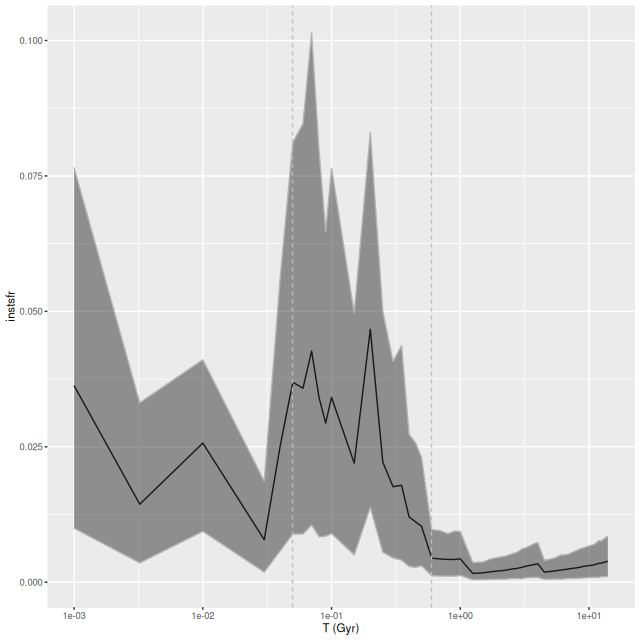
Both model runs show a fairly steep ramp up in star formation beginning at about 600Myr lookback time and a steep decline around 50Myr ago. The lingering star formation in the metal rich model might be a manifestation of the infamous “age metallicity degeneracy” since Balmer Hα emission is too low to support this level of star formation. Comparing the mass growth histories exposes a more subtle effect: the metal poor models have a consistently higher mass fraction at any given epoch. Also, the period of accelerated star formation involved a slightly smaller fraction of the present day stellar mass.

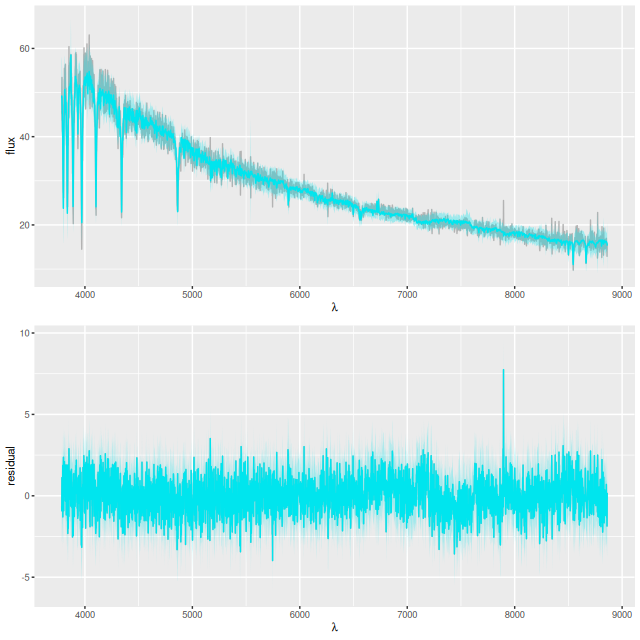
Both models fit the data well. In terms of mean log-likelihood the metal poor model outperformed the metal rich, but only by about 0.4%. The proper Bayesian way to compare models is through the “evidence,” which is hard to estimate accurately. I suspect the metal poor model would be at least slightly flavored because it has fewer parameters than the metal rich one.
The duration of accelerated star formation (about which both models agree) is a little surprising in light of simulations that usually show a fairly short SF burst in the first passage in mergers. But, simulations have only explored a small range of the potential parameter range. Studies of low mass galaxies with extended, massive HI haloes might be of interest.
One more sanity check. Suppose the closest approach between our target and UGC 10200 was 60Myr ago, allowing another 10Myr before (presumably) supernova feedback quenched star formation. Assuming the relative motion is transverse to our line of sight traveling 13.2 kpc in 60Myr implies an average separation speed of ≈215 km/sec. This is a perfectly reasonable value for a galaxy pair or loose group.
Finally for this spectrum, here is a quick look at emission line fluxes. Even though visually not at all obvious several lines were detected at marginal (>2σ) to high (>5σ) confidence. A couple of surprises are the [O I] 6300Å line, which is often only marginally detected even in star forming systems, is a firm (3σ) detection and stronger than the usually more prominent [O III] doublet. Also, the [S II] 6717-6730 doublet is a firm detection while the [N II] doublet is not. What this means is unclear to me. Most of the “strong emission line” metallicity indicators that I have formulae for include [N II] (or [O II] which are out of the wavelength range of these spectra), so it isn’t really possible to make a gas metallicity estimate. It’s a safe guess it’s subsolar though.
| line | [Ne III] 3869 | Hζ | [Ne III] 3970 | Hε | Hδ | Hγ | Hβ | [O III] 4959 | [O III] 5007 | [O I] 6300 | [O I] 6363 | [N II] 6548 | Hα | [N II] 6584 | [S II] 6717 | [SII] 6730 |
| mean | 17.1 | 2.3 | 1.5 | 1.6 | 1.9 | 2.1 | 7.9 | 2.4 | 4.9 | 8.2 | 2.8 | 2.9 | 39.1 | 2.5 | 14.4 | 14.2 |
| s.d. | 6.3 | 2.0 | 1.4 | 1.4 | 1.6 | 1.8 | 3.1 | 2.0 | 2.9 | 2.8 | 1.9 | 2.0 | 2.6 | 1.8 | 2.8 | 2.8 |
| ratio | 2.7 | 1.1 | 1.1 | 1.1 | 1.2 | 1.2 | 2.6 | 1.2 | 1.7 | 3.0 | 1.5 | 1.5 | 15.2 | 1.4 | 5.2 | 5.2 |
There are at least two questions about this galaxy that it would be nice to have answers for. First, since the SDSS fiber only includes about 7% of the luminosity and a similar fraction of the stellar mass we really don’t know if it is recently quenched globally or just where SDSS happened to target. My guess from this HST image is that it is globally quenched because its companion UGC 10200 shows clear evidence of dust lanes and extended star forming regions even in this monochromatic image, while the diffuse light in this galaxy looks relatively featureless. A definitive answer would require IFU spectroscopy though.
A second question is whether the star cluster system is truly young or primordial (or both). This would require color measurements from a return visit by HST using at least one more filter in the red. Estimating a luminosity function is feasible with the existing data, although it would have rather shallow coverage. From my casual clicking around the image it appears to be possible to reach magnitudes a little larger than +24 with reasonable precision.
When this topic first came up on the old Galaxy Zoo talk I thought these might comprise a new and overlooked category of galaxies. In fact though all of the examples I investigated belonged to cataloged galaxies and most of the spectra were of small regions in much larger nearby galaxies. A few galaxies that were in the original Virgo Cluster Catalog and excluded from the EVCC because of lack of redshift confirmation should be added back. There were probably only a few like this one with large errors in redshift estimates and high signal to noise spectra. I haven’t spent enough time with the literature to know if rapidly quenched dwarf galaxies are especially interesting. Maybe they are.
