
I’m going to continue my discussion of the models for the MaNGA observation of NGC 2623 (aka Arp 243, etc.) in MaNGA plateifu 9507-12704 (mangaid 1-605367). First I’ll look at emission lines and line ratios. I don’t have any fresh insights to offer, but it’s useful for me at least to compare to earlier IFU based studies by Lipari et al. (2004) and Cortijo-Ferrero et al. (2017).
Next I’ll turn to stellar populations and star formation histories. This will prove to be quite interesting: there are several distinct regions in different evolutionary states. That will be in my next post.
Emission line properties
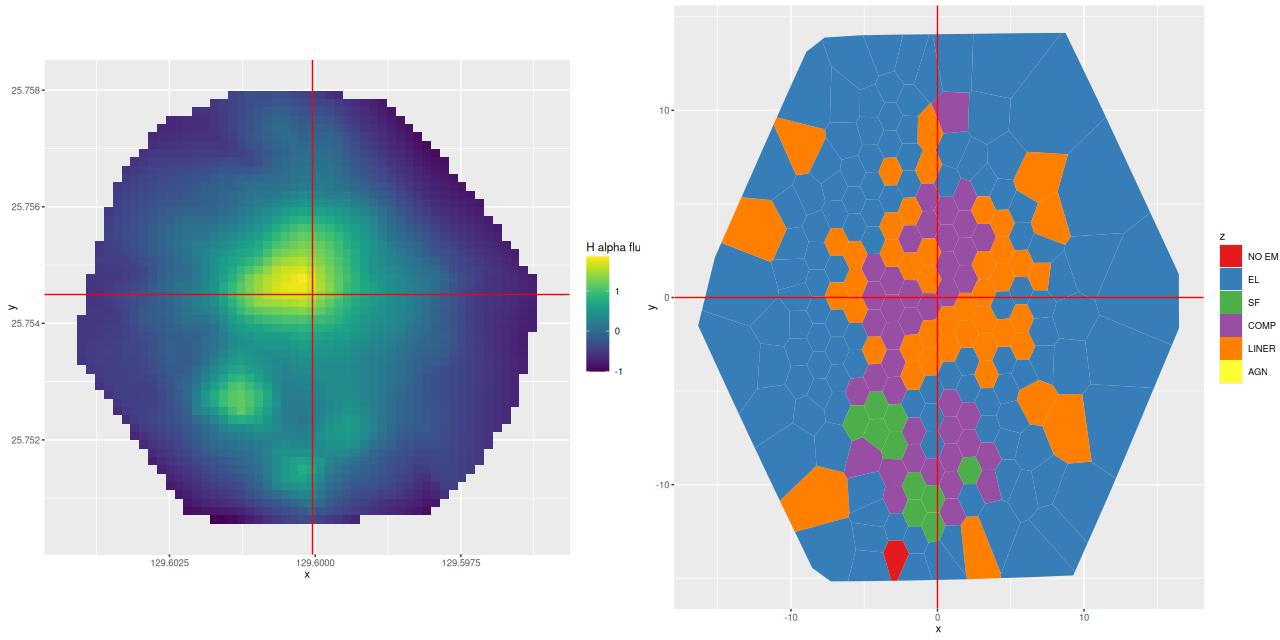
For an overview the plot below maps the Hα flux density1I think I made a factor of 4 error, but that doesn’t affect relative values and hence the color rendering. uncorrected for attenuation. The values are logarithmically scaled. The brightest region by some margin is just NE of the nucleus, with a secondary peak a short distance to the east. The three brighter areas to the south of the nucleus are H II regions.
The right hand panel shows BPT classifications from the [O III] 5007/Hβ vs [N II] 6584/Hα diagnostic following Kauffmann (2003), augmented with a weak line class for spectra without firm detections in one or more of those lines or [O II] 3727-3729 (labelled “EL” in the graph), and another (“NO EM”) for spectra with no firm detections at all. Just over half of the spectra have too weak lines to classify, while 40% fall in the LINER or “composite” bins mostly in a connected region surrounding the nucleus. The three regions in the south have unambiguously starforming BPT classifications.
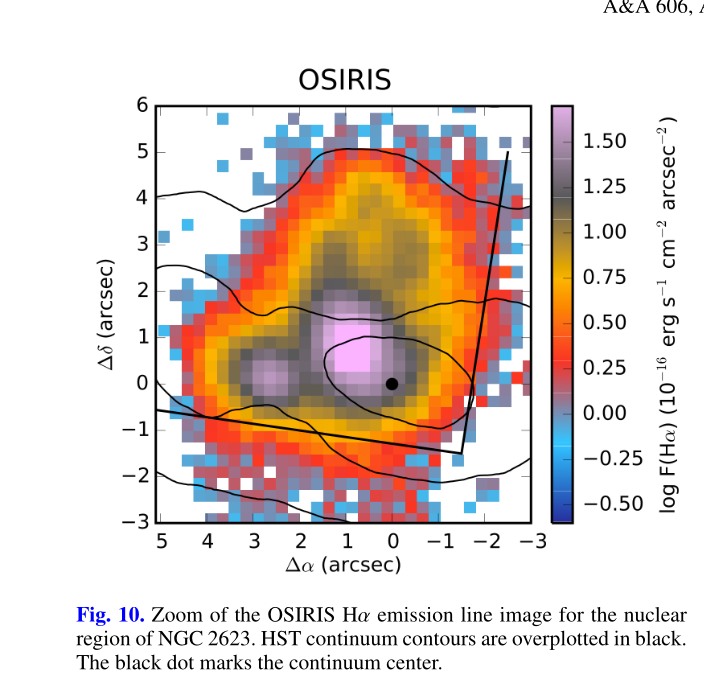
The shape and relative values of the Hα flux near the nucleus agree very well with a higher resolution map published by Cortijo-Ferrero:
Taking a closer look I plotted line ratios for the 3 BPT diagnostics that are commonly used with SDSS data, namely [O III] 5007/Hβ vs. [N II] 6584/Hα, {S III] 6717+6730/Hα, and [O II] 6300/Hα. Only points with 3σ detections in the relevant lines are plotted. Lines marking the boundaries between star forming and something else are from Kewley et al. (2006) and Kauffmann (2003). Note that in all 3 plots the regions with star forming line ratios stay on the star forming side of the boundaries, as do the areas with LINER like ratios. The “composite” regions on the other hand are in the star forming side of the boundary in the [SII/Hα plot while many shift into the LINER region in [O I]/Hα.
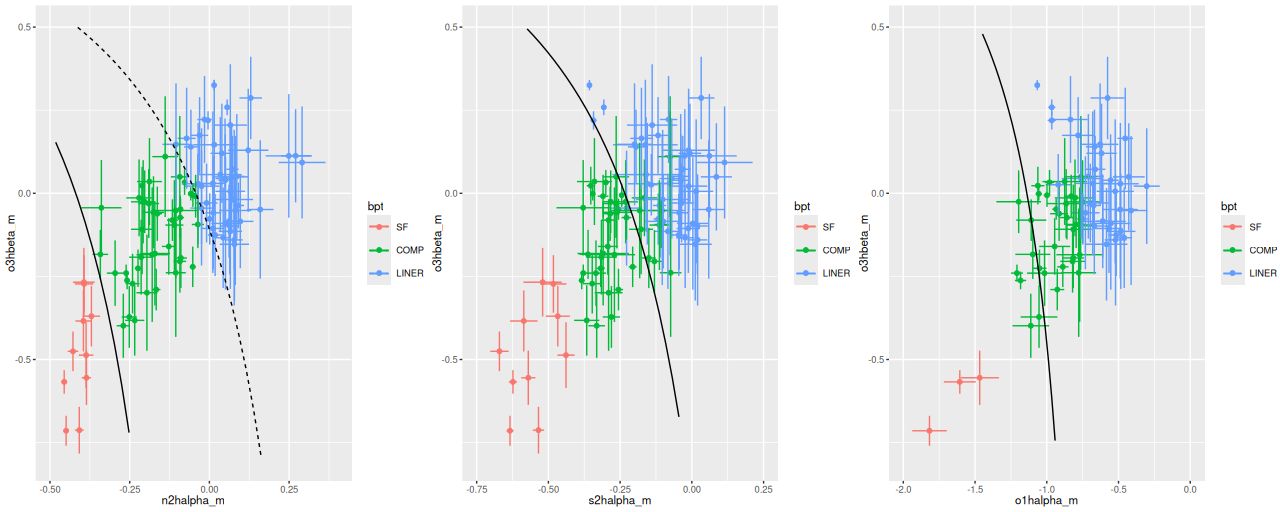
There’s a fairly general consensus on the likely ionization sources. X ray observations demonstrate the existence of a heavily obscured low luminosity AGN (e.g. Yamada et al. 2021 and many others) along with a nuclear starburst. Just outside the nucleus shock excitation was proposed as the main ionizing source already by Lipari, and confirmed by Cortijo-Ferrero’s CALIFA observations, although they also emphasize the possible role of recent star formation.
Alatalo et al. (2016) commented that “[O I]/Hα is a particularly good tracer of shock excitation,” citing Rich et al. (2010) and another source. The latter is particularly interesting because they performed a detailed IFU based analysis of a galaxy (NGC 839) that, while not being involved in a merger, shows similar properties of moderately high velocity outflow probably driven by a nuclear starburst with extensive regions of post-starburst spectra. Their BPT plots look remarkably similar to mine, with most spectra in the “composite” region in the [N II]/Hα plot shifting into the LINER region in [O I]/Hα.
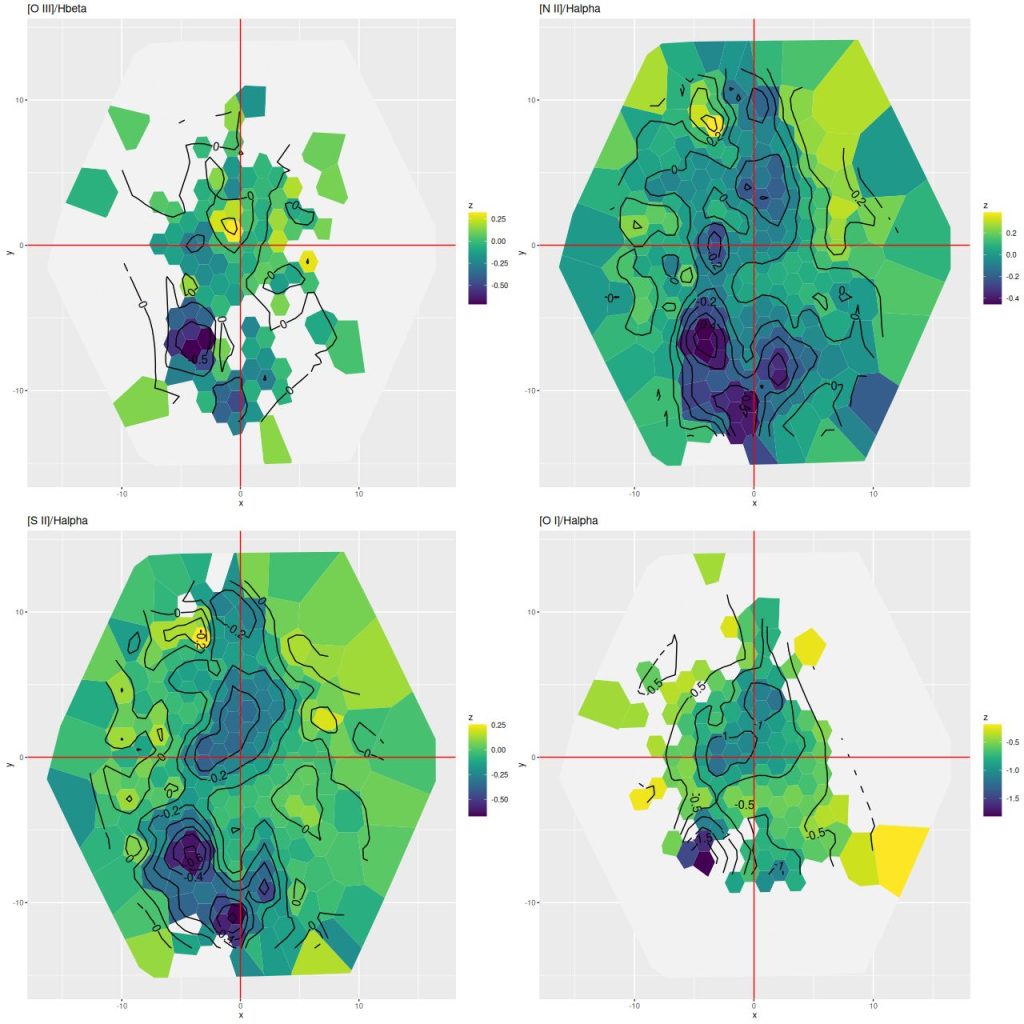
Maps of the line ratios are shown below: again only regions with 3σ detections in the relevant lines are shown, which considerably limits the spatial coverage of [O III]/Hβ and [O I]/Hα. A few points to note: the peak value of [O III]/Hβ is just NE of the nucleus and likely near the source driving the outflow. All of the line ratios generally increase away from the nucleus to the NW and NE. To the south the three H II regions are prominent.
The main result of this analysis is it validates my approach of modeling emission line and stellar contributions simultaneously. This is uncommon but not unheard of in the spectral fitting industry2I believe Capellari’s ppxf has this capability. Since some form of stellar template is needed to get unbiased estimates of emission line properties, from my point of view it makes sense to model both at once. My results for this galaxy agree very well with the two earlier major studies.
I’m going to hit publish now and continue with stellar populations in my next post. I may actually have something new to say about them.