
One simple way to quantify the burstiness of star formation is just to estimate the average star formation rate over large time intervals divided by the average SFR over cosmic time. Of particular interest is the time interval between ~100 Myr and ~1 Gyr since this is roughly the time interval that a post-starburst galaxy is recognizable as such.
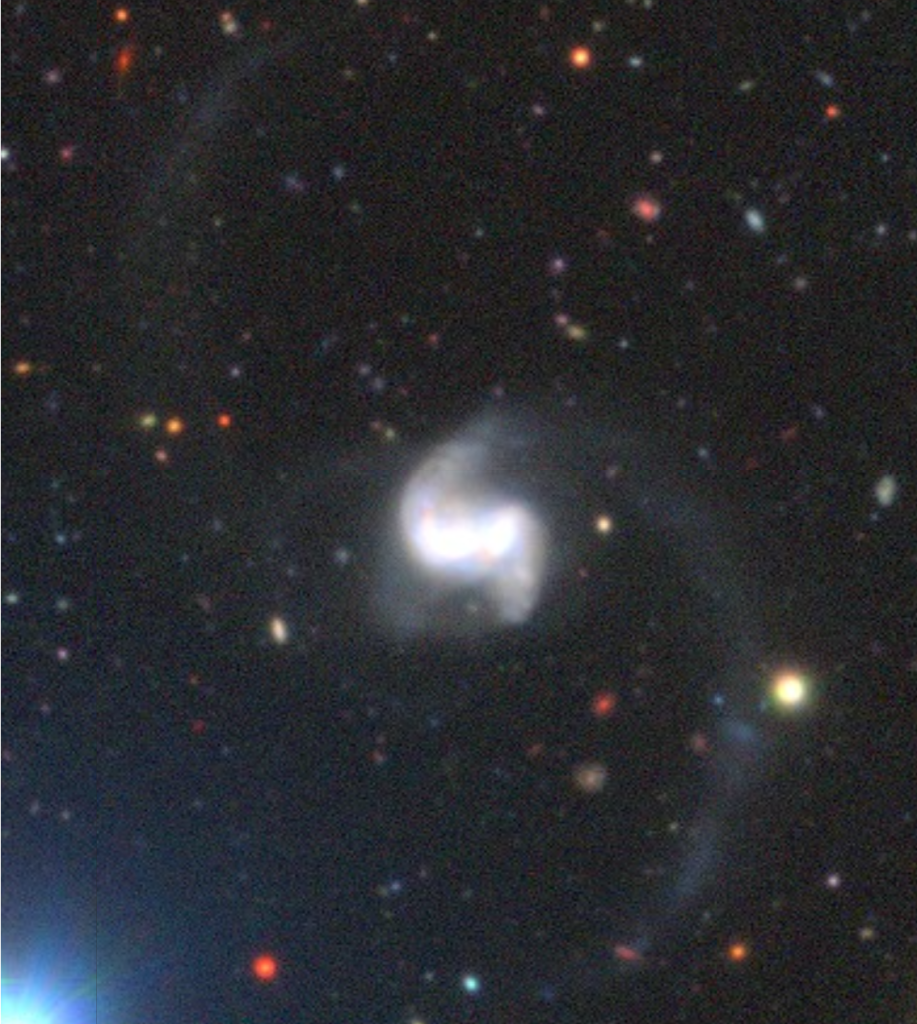
Partly because it happens to still be in my active workspace and partly because it’s really interesting I’m going to take another look at SDSS J095343.89-000524.7 (MaNGA mangaid 1-897). This was in the post-starburst ancillary sample, selected from the catalog by Pattarakijwanich et al.
This image from the Subaru HSC-SSP survey1retrieved as a screenshot from the Legacy Survey sky browser. is much deeper than SDSS imaging and clearly shows extended tidal tails and debris, suggesting that these galaxies have been interacting for some time.
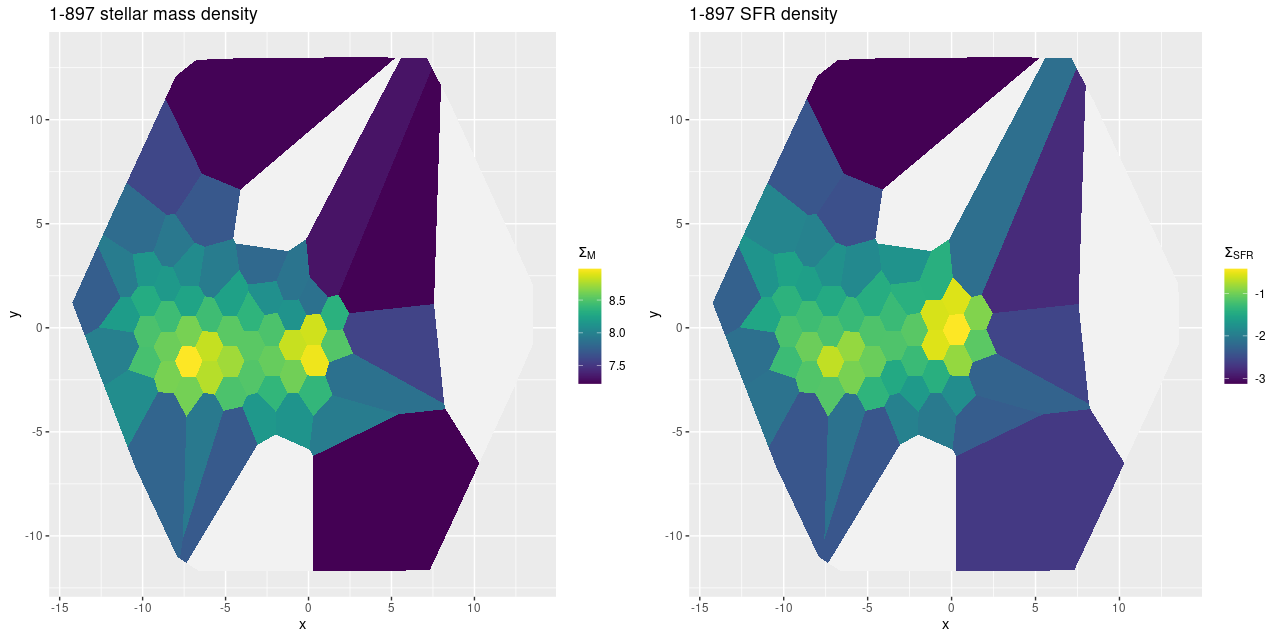
Moving on to various properties derived from the MaNGA spectroscopy and my SFH models with, still, EMILES based SSP models. First here are maps of stellar mass density and 100 Myr averaged star formation rate density. Note that I rebinned the spectra from two posts ago to try to capture more of the tidal tails while excluding the truly blank regions of sky. There are two clear peaks in the stellar mass density separated by a projected distance of about 11 kpc. The central stellar mass densities are nearly the same at about 108.95 M☉/kpc2 . Interestingly enough the bright white peak in surface brightness appears not to coincide with the western peak in stellar mass density, but is offset by a small amount to the north.
Note also that the highest recent star formation is offset to the north of the apparent western nucleus. I’ll look at that in more detail below.
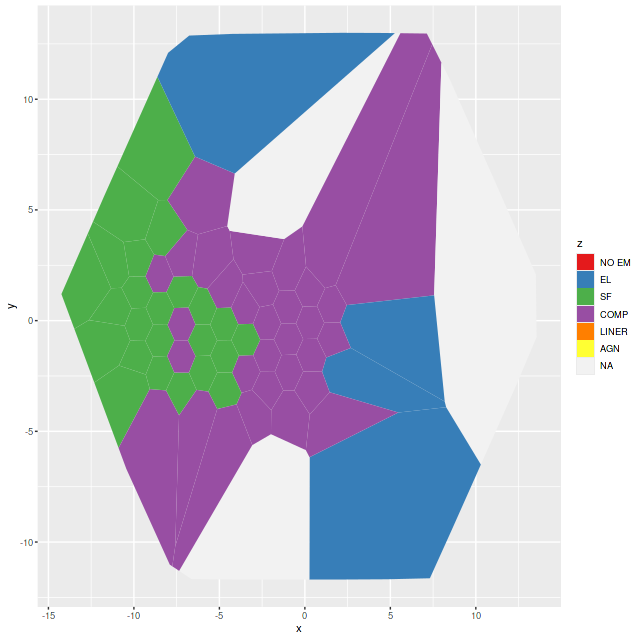
The ionized gas properties are rather different in the two galaxies. Below are BPT classifications using, as usual for me, just the [O III]/Hβ vs. [N II]/Hα diagnostics and Kauffmann’s classification scheme. Emission line fluxes are generally stronger in the eastern galaxy with mostly star forming line ratios. Note two spectra with “composite” line ratios are near the eastern nucleus and might therefore actually be due to a mix of stellar and AGN ionization.
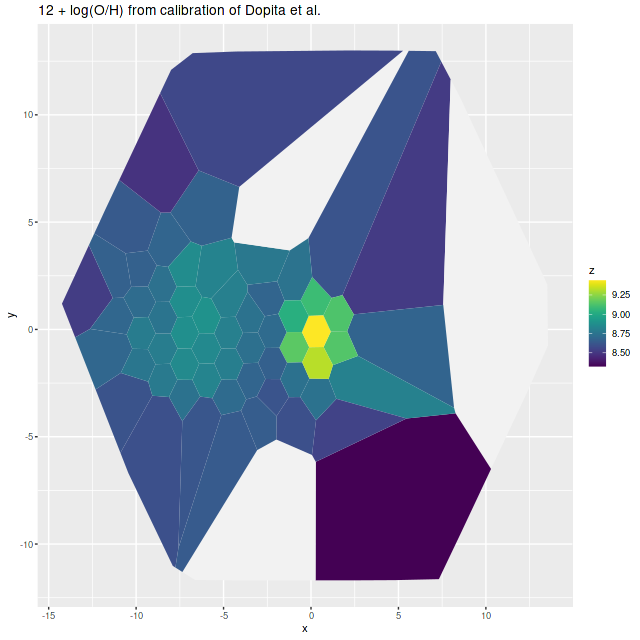
I calculate a few “strong line” gas metallicity estimates from standard literature sources. The one that seems to produce the most consistent estimates is the calibration of Dopita et al. (2016) based on the ratios of [N II 6548]/[S II 6717, 6731] and [N II]/Hα. The eastern galaxy shows a fairly smooth radial gradient while the west is considerably metal enriched in the region with the strongest starburst. The highest metallicity is right at the center of the IFU at the position of the bright white source.
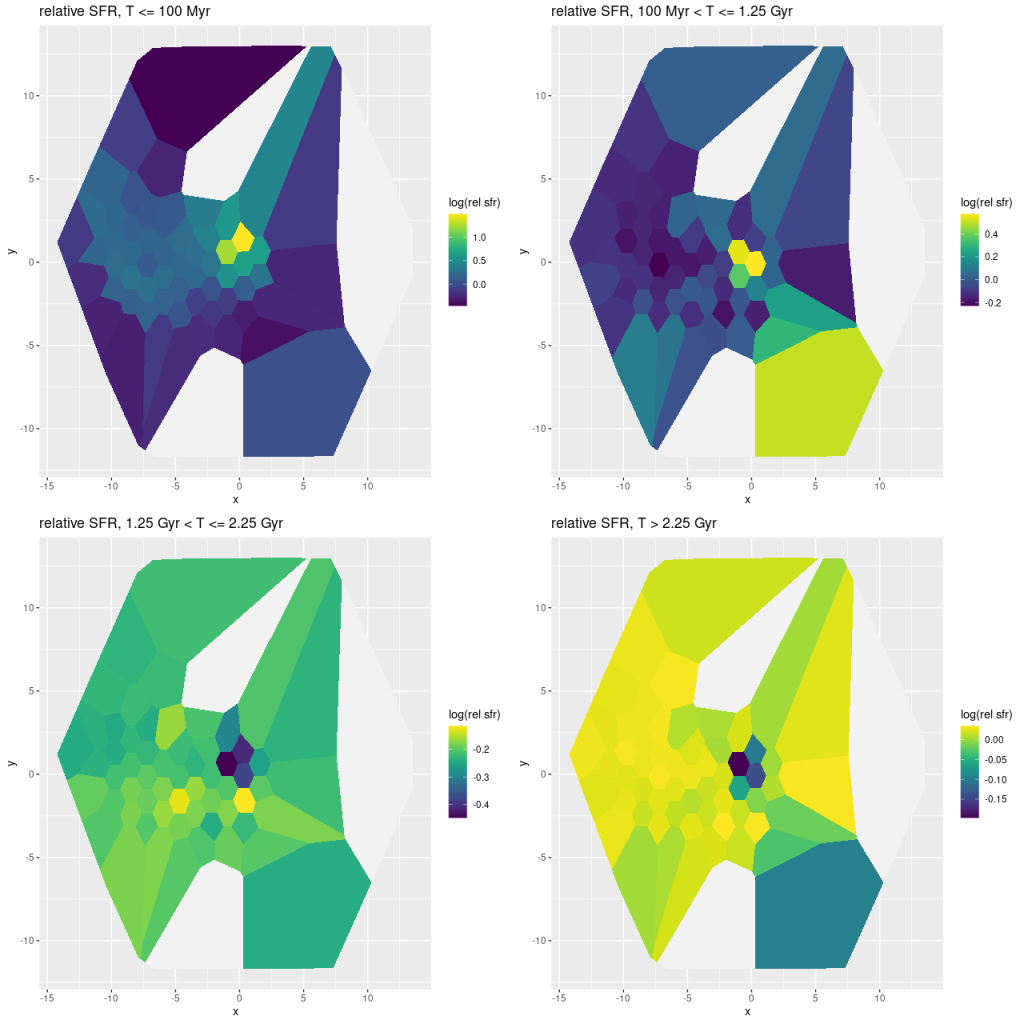
Let’s return to the idea I had at the top of the post to look at star formation rates in broad time intervals relative to the mean star formation rate over cosmic time. For this exploratory exercise I used just 4 bins with upper age limits of 0.1, 1.25, 2.25, and (nominally) 14 Gyr. There seems no point being too fastidious about calculating the bin widths: I just used the difference in nominal ages between the endpoints. I did take into account the lookback time to the galaxy, which for this one is about 1 Gyr (z = 0.083), so the final bin has a calculated width of 10.5Gyr. I chose to make the 3rd, intermediate age bin a rather short 1 Gyr wide to look for aging starbursts that might be missed using the typical selection criterion of strong Balmer absorption. In this case there’s no evidence of that: both galaxies seem to have had uneventful histories up until ~1 Gyr ago.
The top row of the plot below is the most interesting: there appear to have been two major bursts of recent star formation, both highly localized to the central region of the western galaxy. If the model estimate of the location of the peak stellar mass density is correct the fiber with the largest star formation excess in the 100 Myr – 1.25Gyr interval is offset just to the north and coincident with the IFU center. The more recent burst is also offset from the older one. There is a hint of recent accelerated star formation over most of both galaxies.
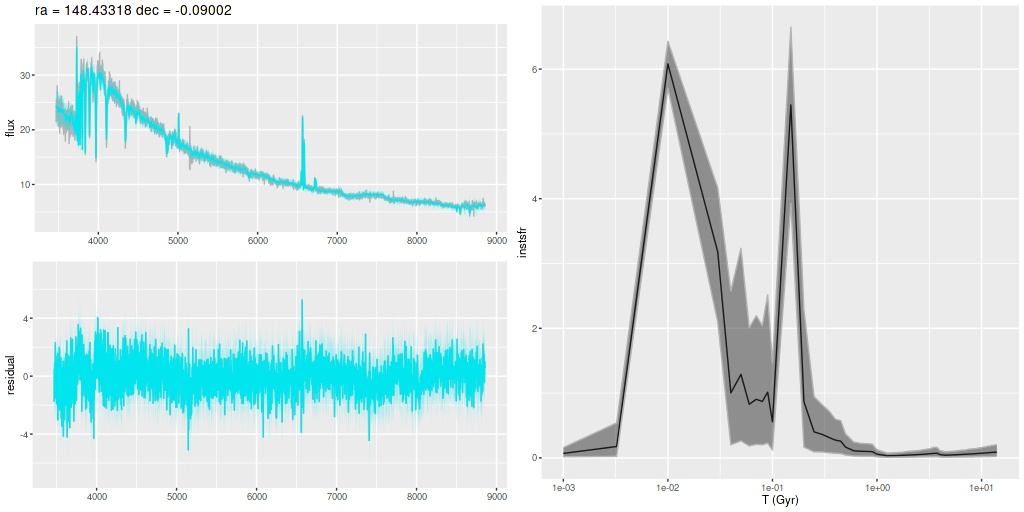
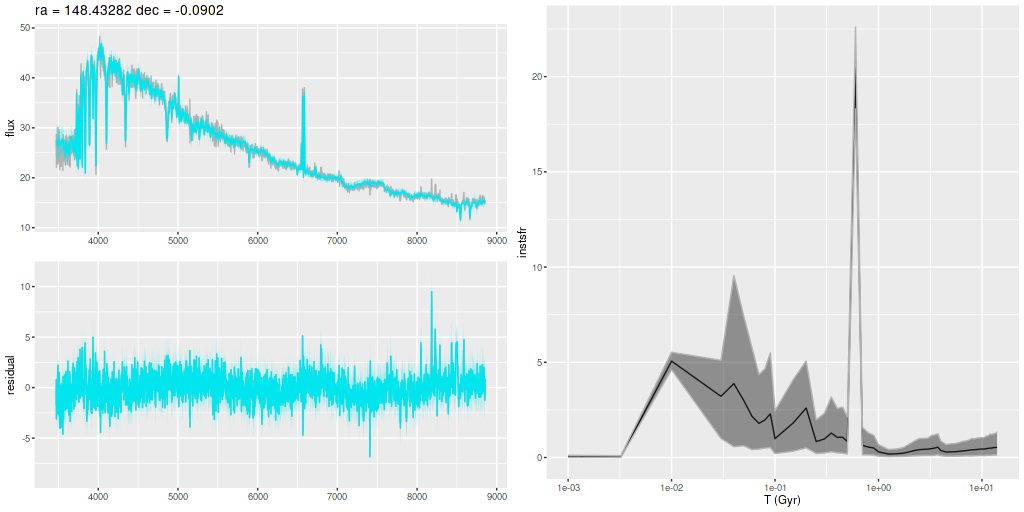
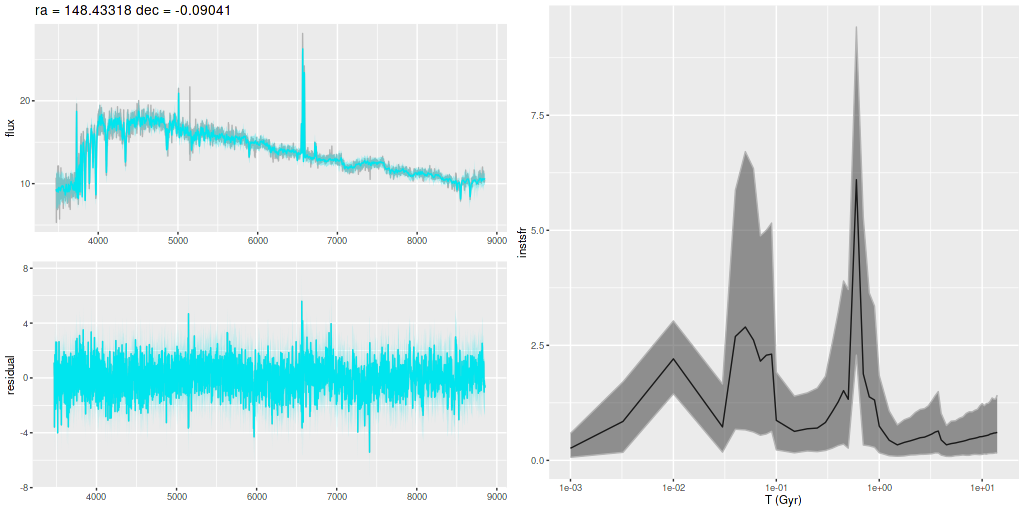
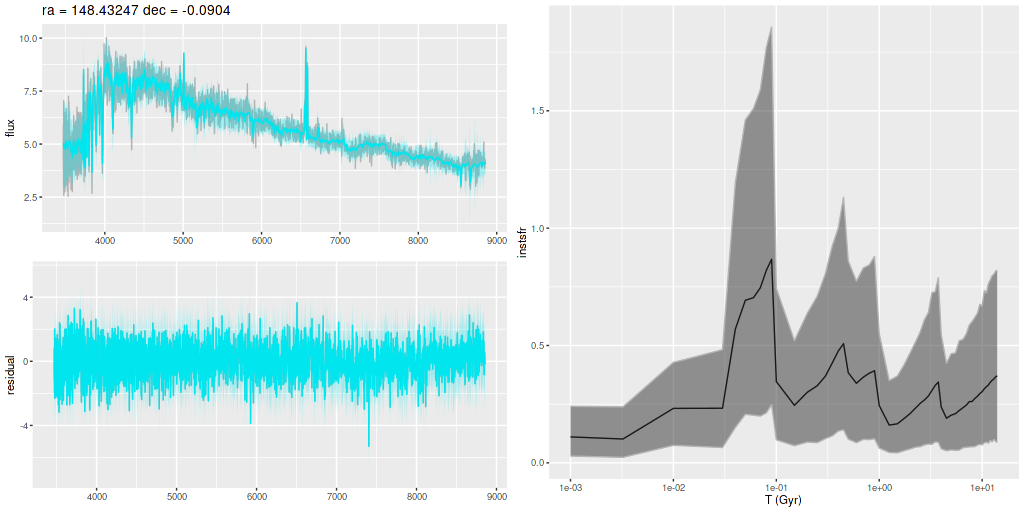
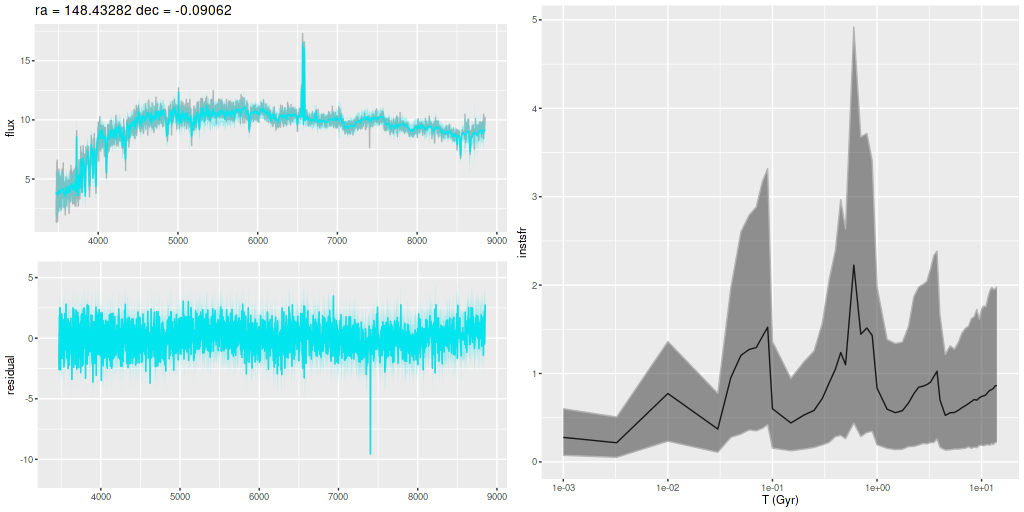
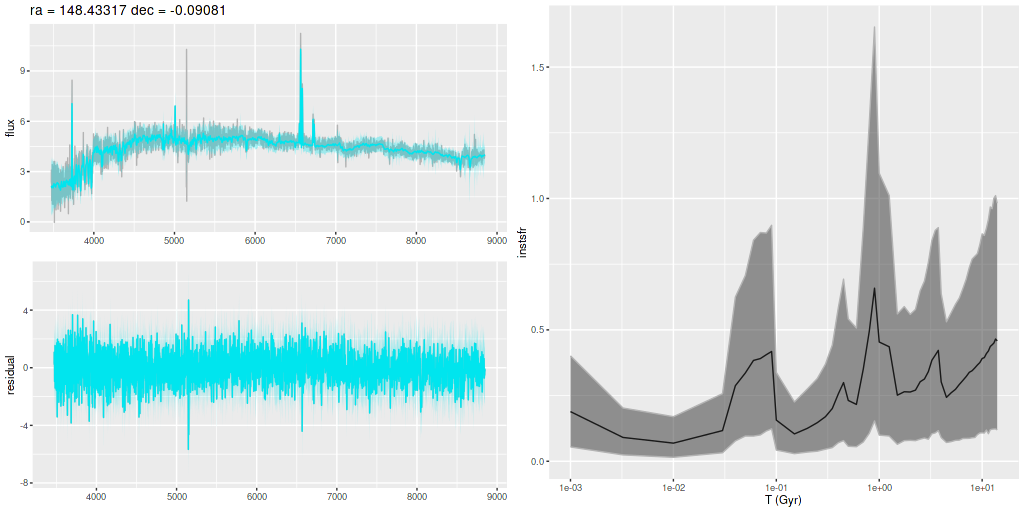
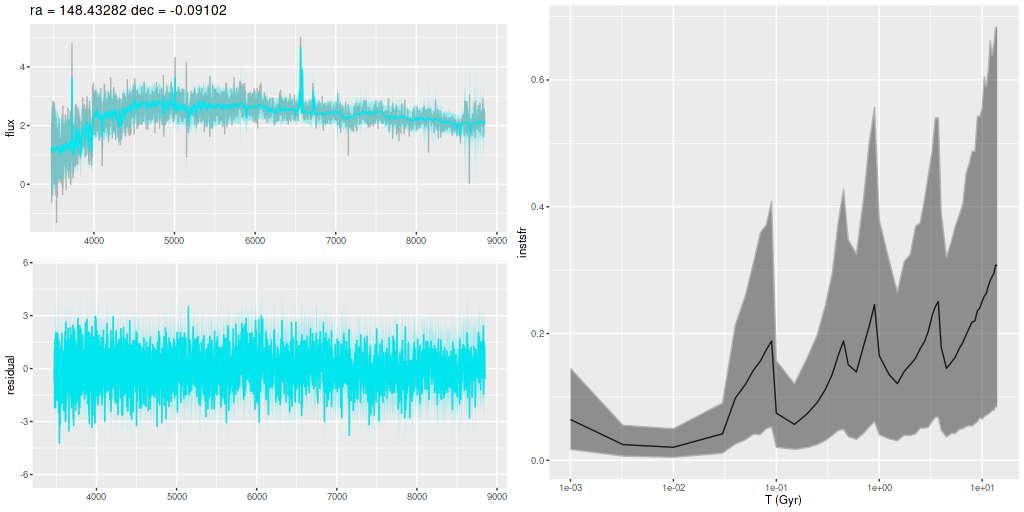
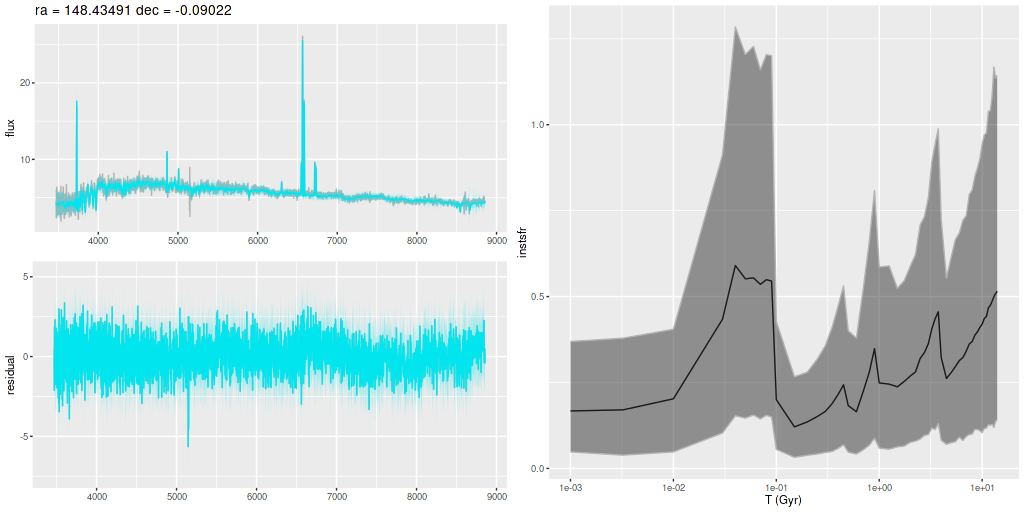
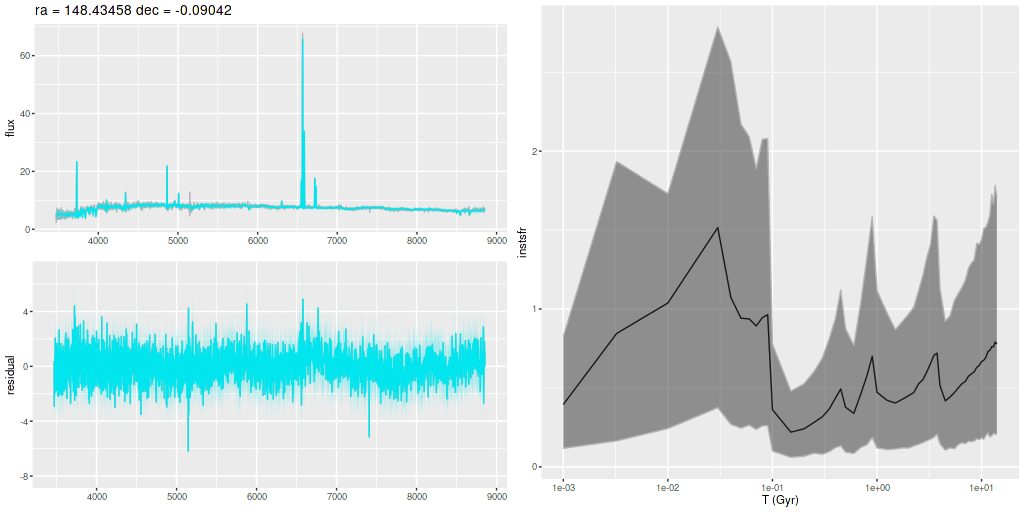
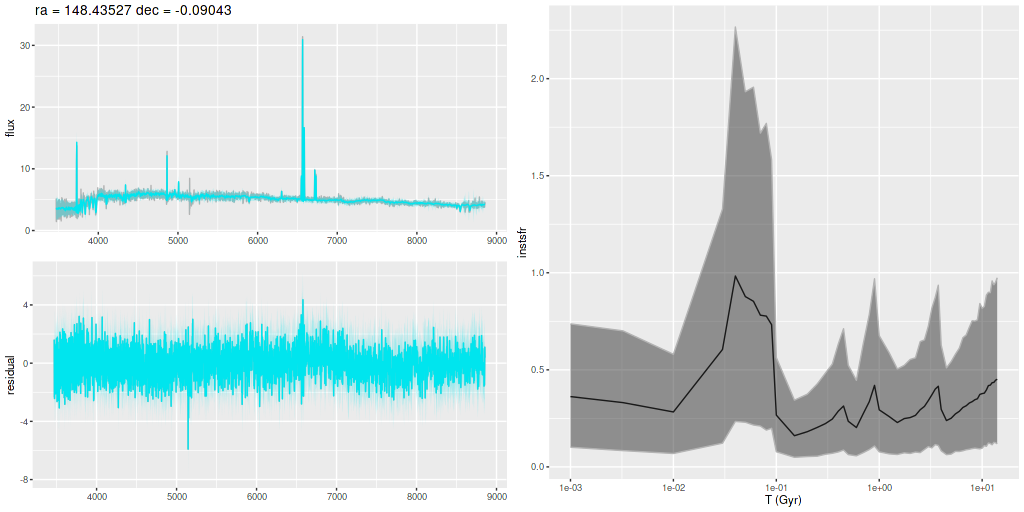
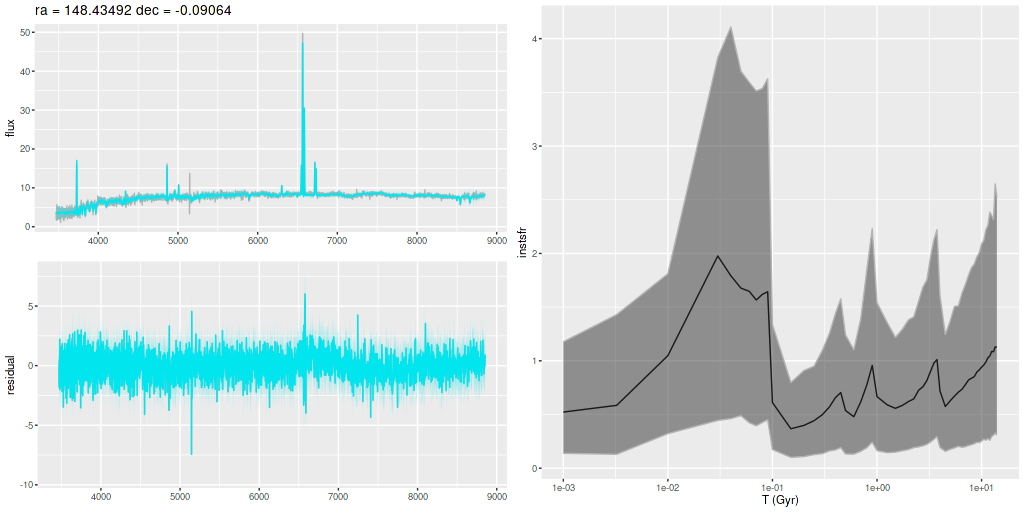
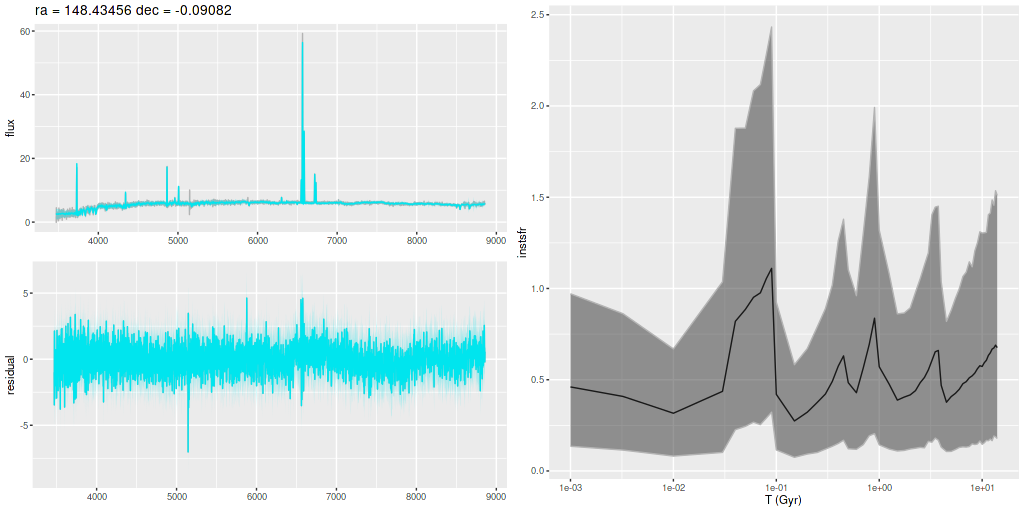
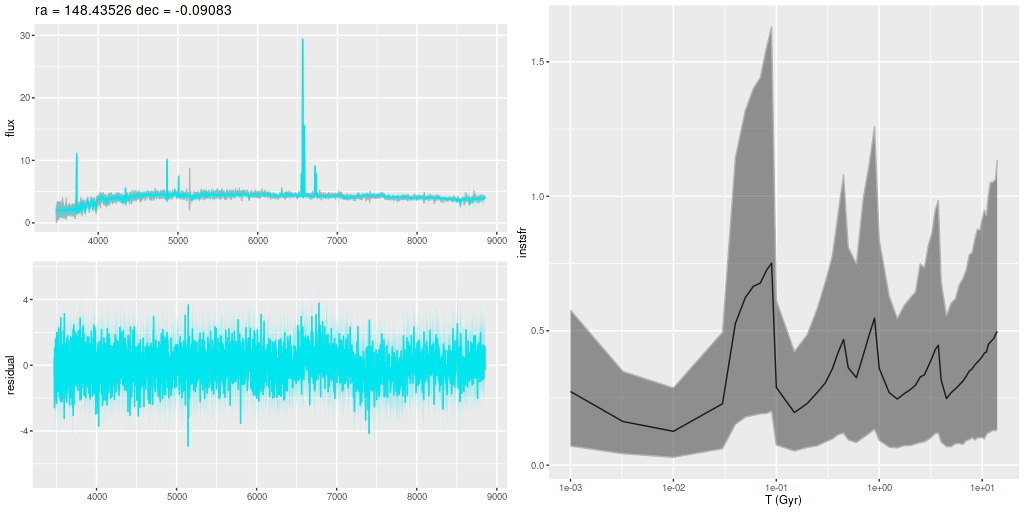
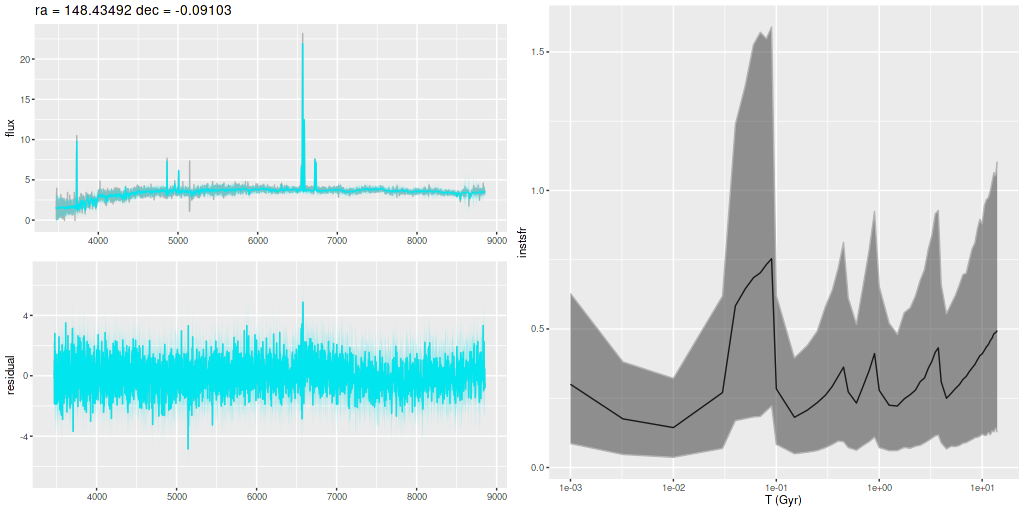
For the rest of this post I plot model fits to the spectra and star formation histories for the fibers surrounding the two nuclei. These are ordered approximately from north to south and west to east. For reference the IFU center is at (ra, dec) = (148.43291, -0.09018). The model has the peak stellar mass density in the western system at (ra, dec) = (148.4328, -0.09062). The eastern galaxy’s nucleus is at (ra, dec) = (148.4349, -0.09064).
Note below that the plots have different vertical scales. The horizontal scales are the same for both spectra and star formation histories, but at least one SFH plot is slightly misaligned.
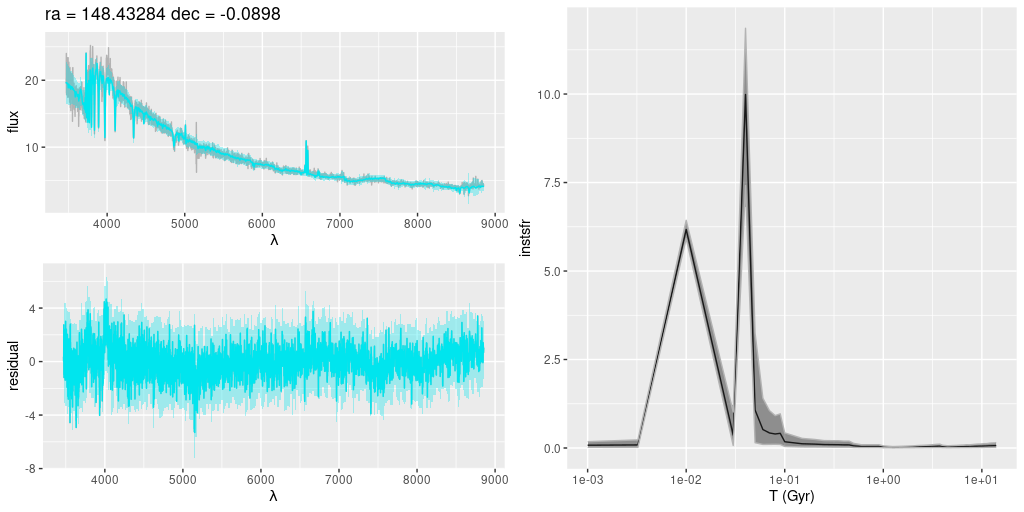
Central region – western galaxy
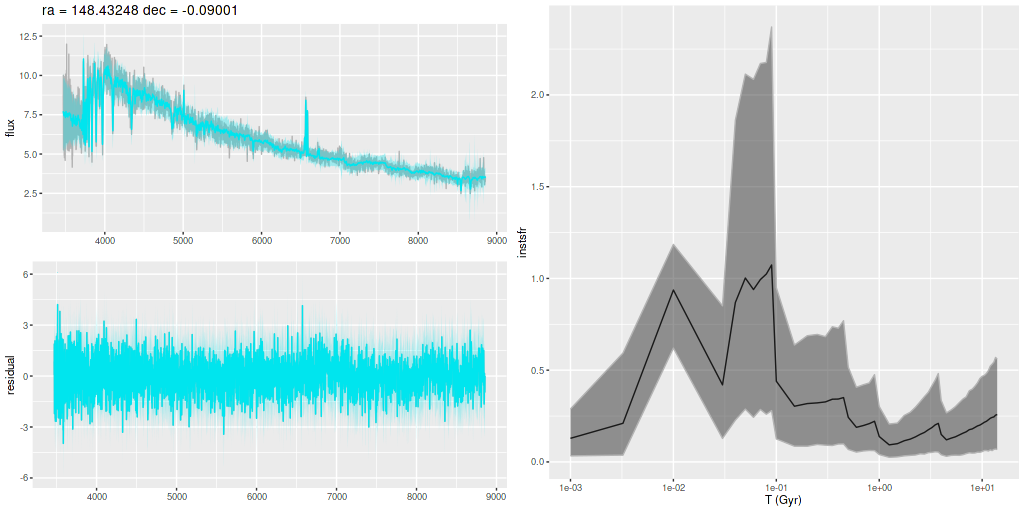
Central region – eastern galaxy
In an earller post I mentioned a MaNGA related paper by Cheng et al. who found nearly 500 systems with post-starburst characteristics that fell in 3 broad categories: centrally concentrated PSB regions, ring-like, and irregularly located. Clearly any galaxy that was selected based on SDSS spectroscopy that’s not a false positive will have a central PSB region, although that of course doesn’t preclude extended post-starburst conditions. This particular galaxy appears to have a remarkably compact post-starburst region.
When time permits again I plan to look at the remaining 40 galaxies in this sample. Unfortunately the larger sample of Cheng et al. appears to have no published catalog.