
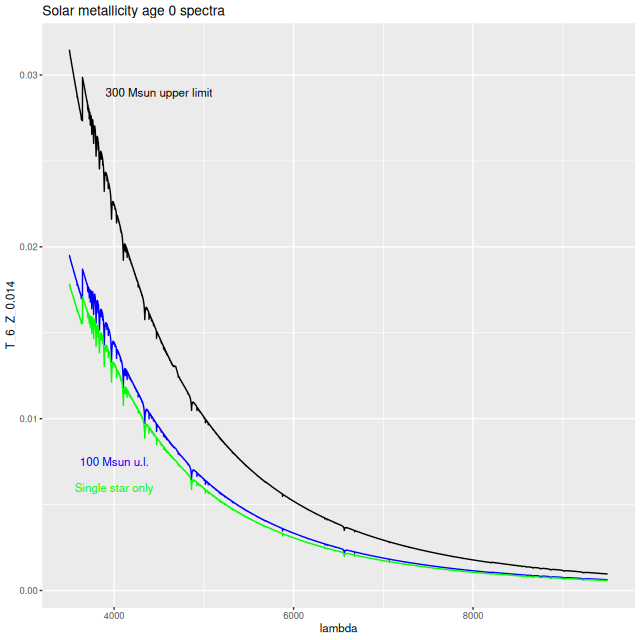
Three posts ago I did a brief comparison of my usual EMILES based models with the most recent version of Stanway and Eldridge’s BPASS models, which are the first purely theoretical model spectra that seem possibly suitable for full spectrum fitting. I mentioned then that I used a set of models with an age zero upper mass limit of 300 M☉, while most model libraries adopt an upper mass limit of 100 M☉. As is customary in this industry their website contains a number of additional model libraries, including with upper stellar mass limits of 100 M☉ and some with single star evolution only. These alternate sets of models have the same structure as the baseline models, so I just used the same scripts to create R readable data sets with the same ages and subset of metallicities..
Not surprisingly the 1 Myr models with 300 M☉ upper limit are considerably more luminous than either the binary or single star models with 100 M☉ limits, but the latter are still somewhat more luminous than my standard library at the same age. Stars >100 M☉ evolve very rapidly and the difference in model spectra disappears by log(T) = 6.6 (4 Myr).
To test the differences in model star formation histories I just ran one set of models on the post-starburst galaxy WISEA J080218.38+323207.8 (MaNGA plateifu 10220-3704, mangaid 1-201936). And here’s the comparison:
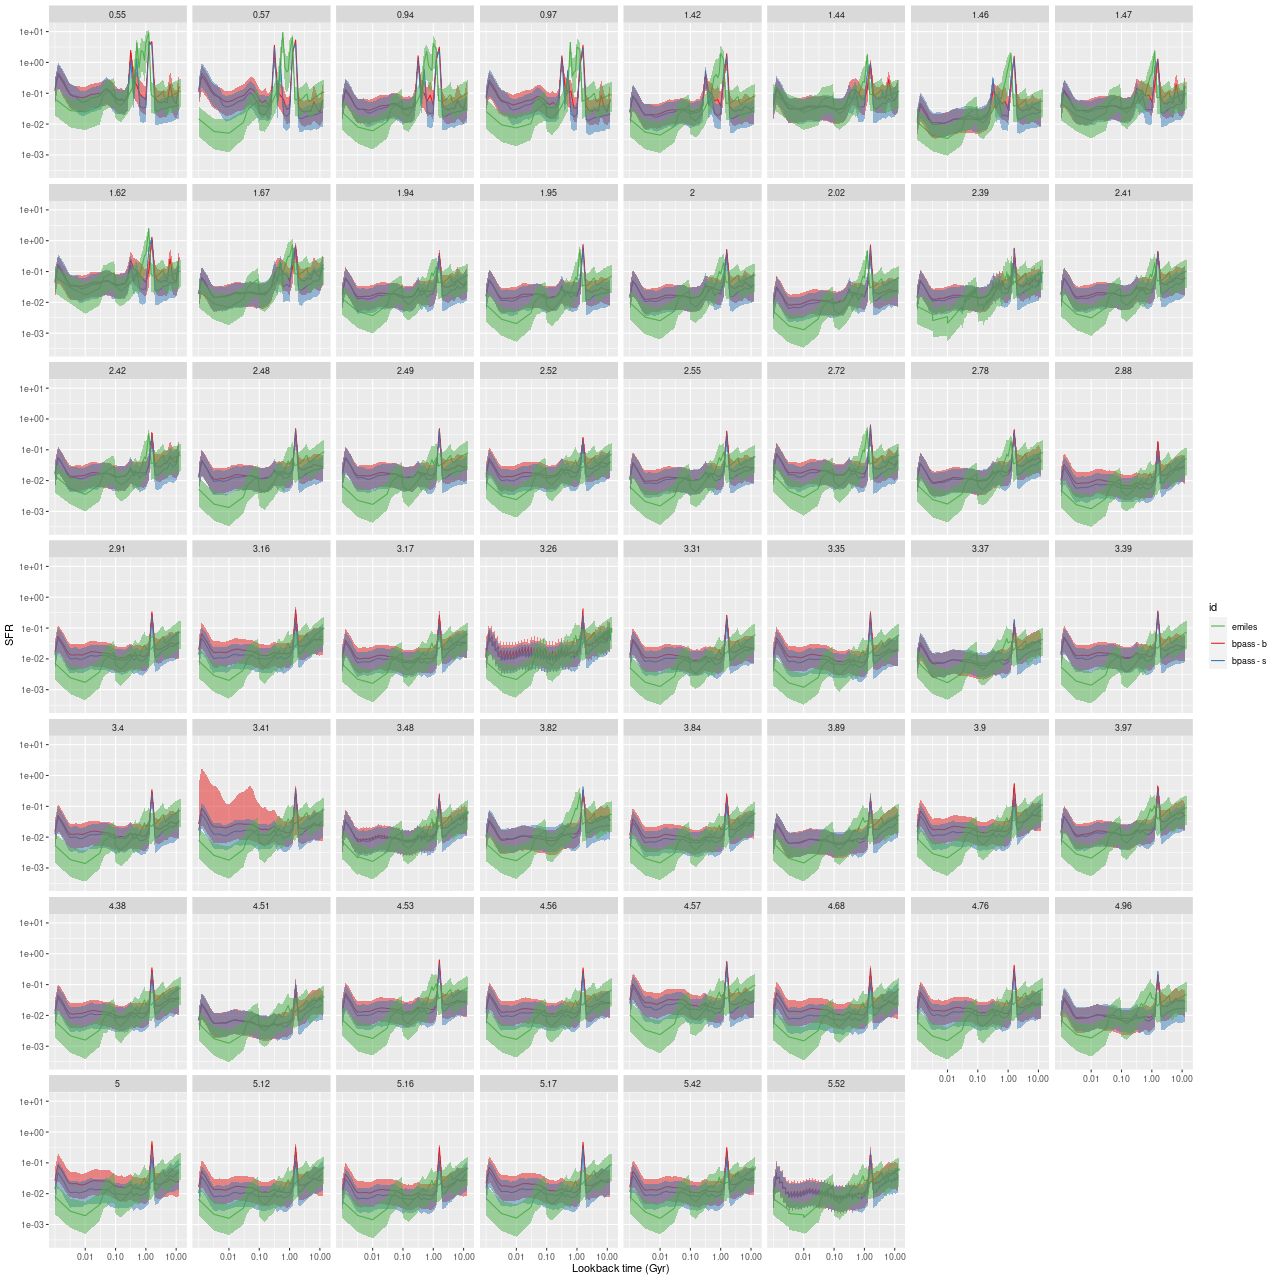
The basic result is there’s no real difference either with the 300 M☉ upper limit models or between the binary and single star evolution models1note that one spectrum in the fifth row above has a rather different model SFH for the binary library. This turned out to be from a convergence failure of the sampler in one chain. Again there’s a sharp downturn in star formation rate at the youngest ages and again there’s that peculiar spike at 1.6 Gyr in all model runs. That feature has serious consequences for the interpretation of the model star formation histories in these post-starburst galaxies. In this case the EMILES based models indicate a strongly centrally concentrated burst that began ~1 Gyr ago and lasted several hundred Myr in the center, while fading away to no significant enhancement outside a few kpc from the center. The BPASS models on the other hand have two distinct bursts near the center that straddle those of EMILES, with a significant amount of mass in a short burst throughout the galaxy. While not necessarily implausible the persistence of the 1.6Gyr spike (and as noted before not just in this galaxy) makes me suspect an artifact of some sort.
As a little bit of an aside this galaxy has one published estimate of a detailed star formation history by French et al. (2018) based on GALEX and SDSS photometry and SDSS spectra (not MaNGA). Their best fit model has two bursts at ~500 Myr and 1.5 Gyr with a total mass contribution of ~20 – 65%. Since the SDSS spectra were 3″ diameter this would be for the central region only. This at least broadly agrees with either the EMILES or BPASS based models. I have roughly 75% of the mass in the burst (EMILES) in the central fiber with somewhat more in the BPASS models, but that drops rapidly.
Well, the quest for an updated SSP library continues. Unfortunately the two likely sources of MaStar based models have yet to publish updates. I’m still considering doing my own. Unfortunately I’m not aware of any open (or for that matter closed) source software for generating SSP model spectra. This seems to be something of a dark art.