CGCG 292-024

I may as well post this here too. This HST ACS/WFC image was taken as part of SNAP program 15445, “Gems of the Galaxy Zoos,” PI Bill Keel with numerous collaborators associated with Galaxy Zoo (see also this Galaxy Zoo blog post). This is my Q&D processing job on the calibrated/distortion corrected fits file using STIFF and a bit of Photoshop adjustment.

cgcg 292-024
CGCG 292-024 HST/ACS F475W
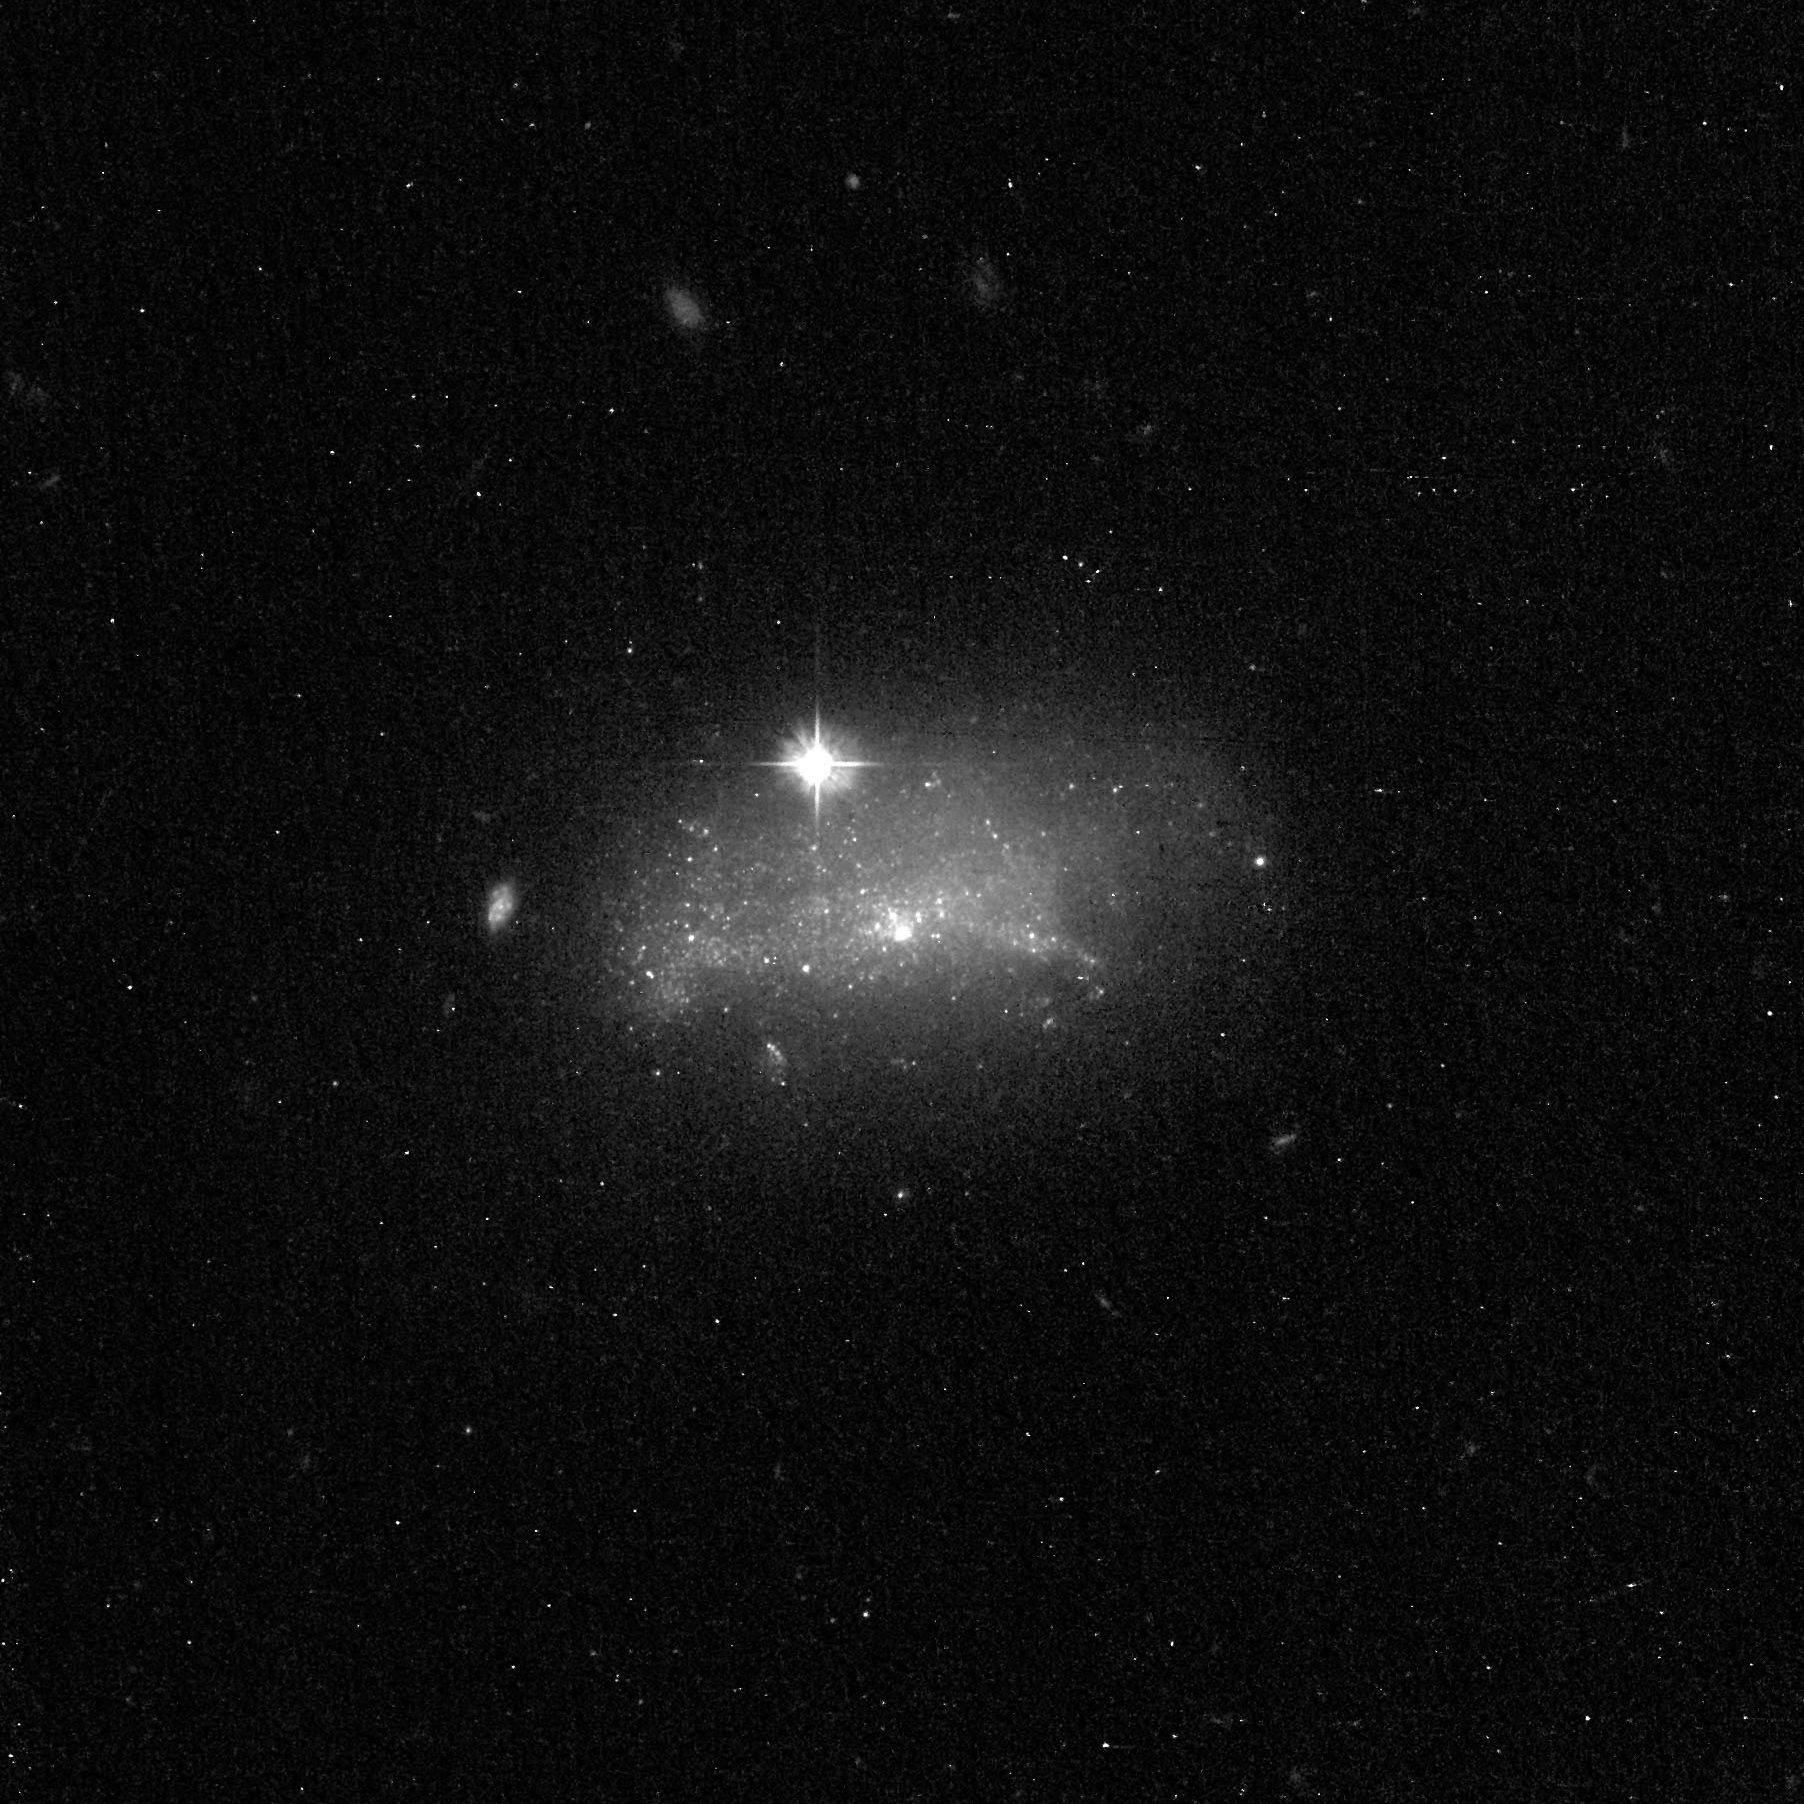
Proposal ID 15445 “ZOOGEMS”, PI Keel

Comparing that to the finder chart image from SDSS below, which is oriented slightly differently, it appears the area observed spectroscopically was a centrally located star cluster or maybe complex of star clusters.

cgcg 292-024
CGCG 292-024 SDSS finder chart image with spectrum location marked

What interested me about this and a number of other nearby galaxies (which were discussed at some length on the old Galaxy Zoo Talk) is it has a classic K+A spectrum:

sdssspec
SDSS spectrum of central region of CGCG 292-024

that the SDSS spectro pipeline erroneously calls a star with an improbably high radial velocity of ≈1200 km/sec. Well it’s not a foreground star obviously enough, and the SDSS redshift is close but not quite right. I measure it to be z = 0.0043, or cz = 1289 km/sec, which agrees well enough with the NED value of 1282 km/sec (obtained from an HI radial velocity by by Garcia et al. 1994).

Karachentsev, Nasonova, and Curtois (2013) assign this galaxy to the NGC 3838 (which is just NW of our target galaxy) group, which they place in the background of the Ursa Majoris “cloud,” which is in turn a loose conglomerate of 7 groups about 20 Mpc. distant. They adopt a distance modulus to the group of 32.3 mag., which is a little higher than the NED value (with H0 = 70 km/sec/Mpc) for this galaxy of 31.6 mag. SDSS lists the g band psfMag as 18.7 for the spectroscopic target, which makes its absolute magnitude around -12.9.

In contrast to the appearance of the spectrum the galaxy itself doesn’t look like a typical K+A galaxy. In the local universe most field or group K+A’s are disturbed ellipticals, which are thought to be the aftermath of major gas rich mergers. This galaxy, while irregular in morphology, is not particularly disturbed in appearance and shows no sign of having recently merged. Quenching mechanisms that are thought to act in cluster environments aren’t likely to be effective here since the Ursa Majoris complex isn’t especially dense (and according to the above authors also light on dark matter). I think I speculated online that this and galaxies like it might actually be old and metal poor (having the infamous “age-metallicity” degeneracy in mind), but that doesn’t really work. Even the most metal poor galactic globular clusters are considerably redder than the spectroscopic object.

So, I did some SFH modeling, which I will describe in more detail in a future post. I currently mostly use a subset of the EMILES SSP library with Kroupa IMF, BaSTI isochrones and 4 metallicity bins between [Z/Zsun] = -0.66 and +0.40. I supplement these with unevolved models from BC03 matched as nearly as possible in metallicity. For this exercise I also assembled a metal poor library from the Z = -2.27, -1.26, and -0.25 models with all available ages from 30Myr to 14Gyr. Here are estimated mass growth histories:

cgcg292024_mgh
Estimated mass growth histories, EMILES and metal poor EMILES

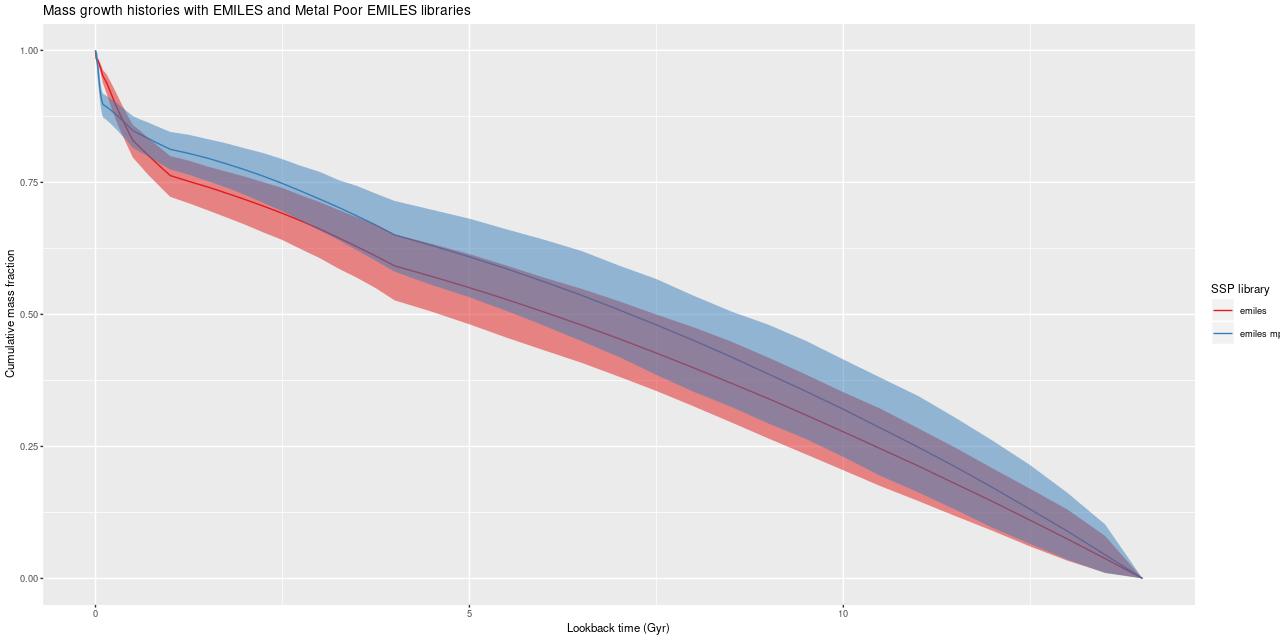
Both models have nearly constant rates of mass growth over cosmic history which implies slowly declining star formation, with the metal poor models having slightly faster early mass growth (and hence slightly older light weighted age). Neither exhibits a starburst, faded or otherwise. The “metal rich” model fits show a slight acceleration beginning about 1Gyr ago, while the “metal poor” fits have a few percent contribution from the youngest, 30Myr, population (which already has quite strong Balmer absorption). So the age-metallicity degeneracy manifests in these full spectrum fitting models as small(ish) variations in detailed star formation histories. The fits to the data are indistinguishable:

cgcg292024_ppfit
Posterior predictive fits to SDSS spectrum of central region of CGCG 292-024

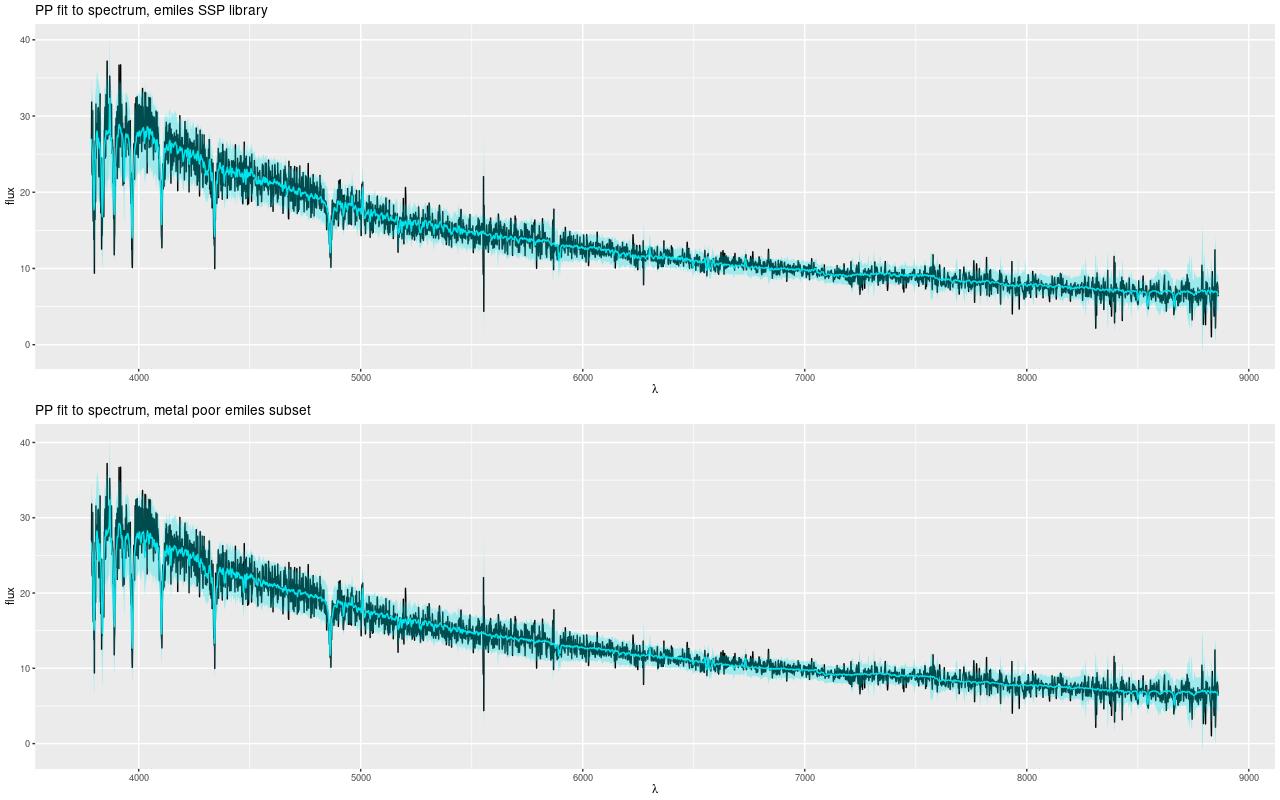
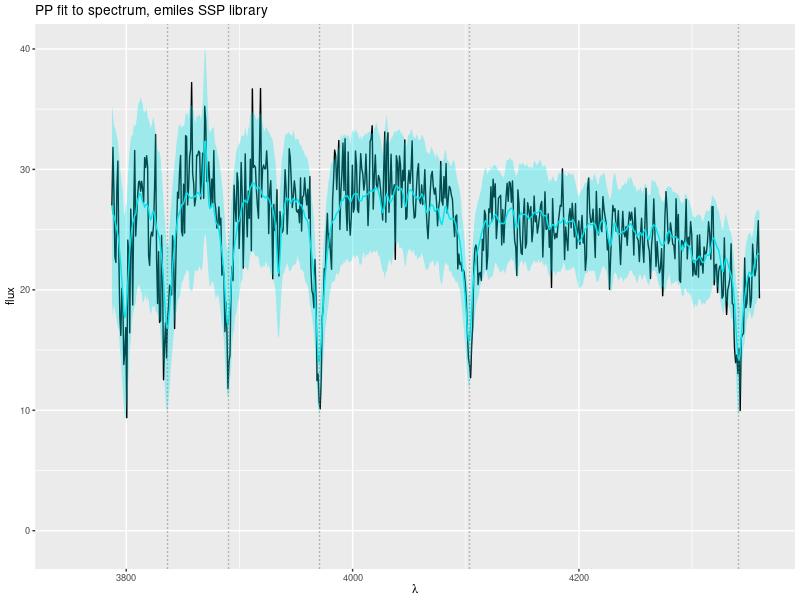
The fits to the Balmer lines appear to be systematically weak but this seems to be an artifact. Zooming in on the blue end of the spectrum the posterior predictive fits match the full depth of the absorption lines (Balmer lines from Hγ to Hη are marked)[1]:

Posterior predictive fit to blue part of spectrum

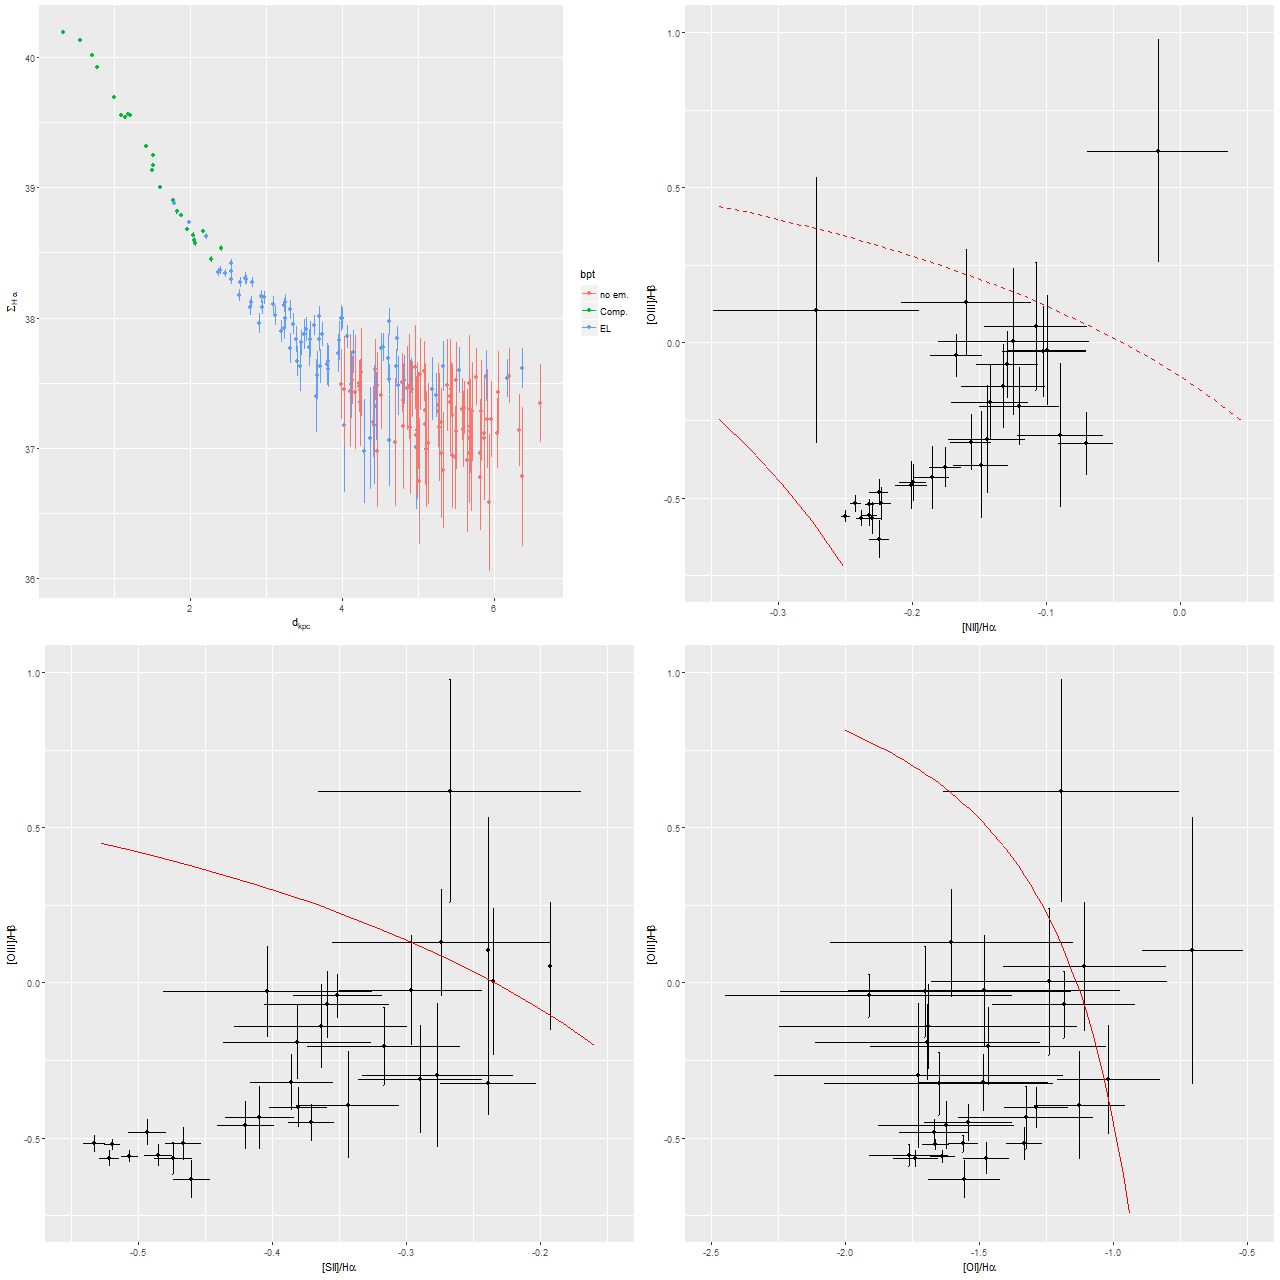
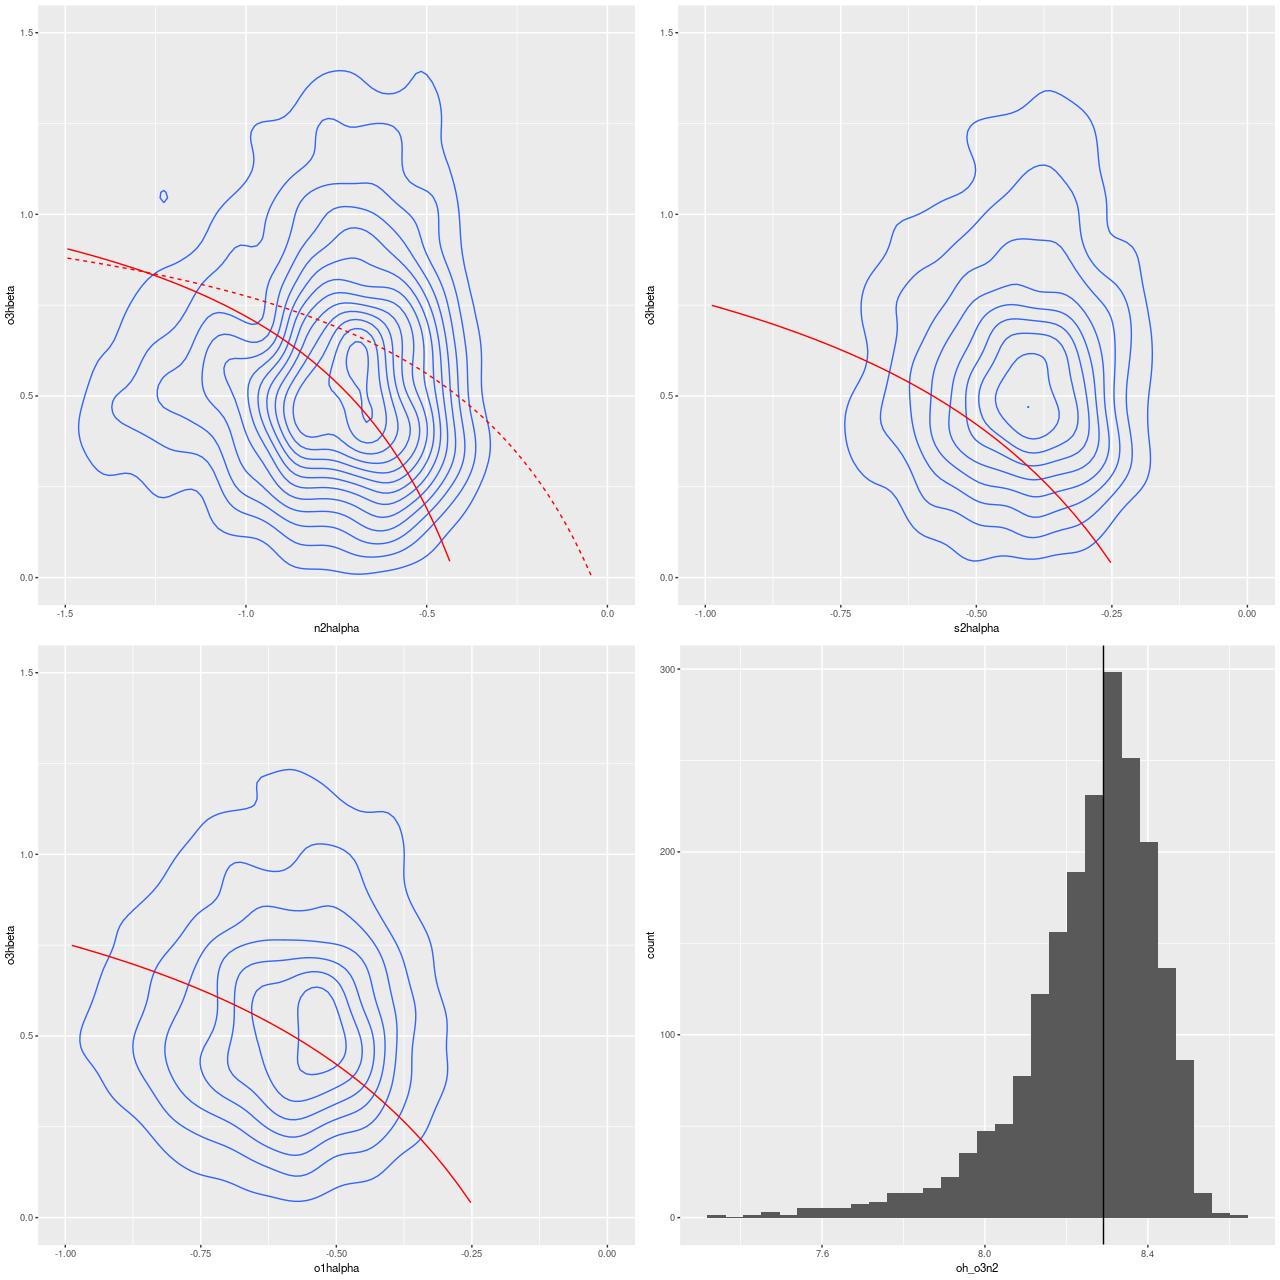
While weak there is some ionized gas emission (note for example that Hα is completely filled in, which implies the emission equivalent width is ~several Å). Here are BPT diagnostic plots for [N II]/Hα, [S II]/Hα, and [O I]/Hα vs [O III]/Hβ. The contours indicate the joint posterior density of the line ratios with arbitrary spacing. The lines are the usual SF/something else demarcation lines from Kewley et al. Although the constraints aren’t very strong most of the probability mass lies outside the starforming region, suggesting that the area sampled by the fiber is at least for now “retired.”

The BR panel of the plot shows the estimated posterior distribution of the “strong line” metallicity indicator O3N2 with the calibration of Pettini & Pagel (2004). This does indicate that the gas-phase metallicity is sub-solar by about 0.6 dex.

cgcg292024_emissionlinediagnostics
BPT diagnostics and strong line metallicity estimate for CGCG 292-024

Conclusion?: I think we’re most likely seeing the effect of stochastic star formation (in time and maybe space as well). The region sampled by the fiber has an estimated (by me) stellar mass slightly lower than \(10^7 M_{\odot}\), which is probably low enough for supernova feedback to at least temporarily suppress star formation. Without more data it’s hard to tell if star formation is globally suppressed at present, but there’s no real reason to think it is. There is a supply of neutral Hydrogen available (see Garcia et al. linked above and Serra et al. 2012), so star formation could well resume any time.

Continue reading “CGCG 292-024”

A proto-K+A elliptical in MaNGA (part 1)

This isn’t quite an accidental “discovery.” There’s been a fair amount of interest in recent years in finding “transitional” galaxies that are rapidly shutting down star formation but that don’t meet the traditional criteria for K+A galaxies (see for example Alatalo et al. 2014, 2016; Wild et al. 2007 among many others). A while back I made my own effort at assembling a sample of post-starburst candidates by looking for spectra in SDSS with strong Hδ absorption and emission line ratios other than starforming in the MPA data tables. This sample had some thousands of candidates, of which there are just 26 in the first two MaNGA data releases. As many as half of those were false positives, which is a little too high, so it’s back to the drawing board. But there were a few interesting hits:

KUG 0859+406
KUG 0859+406 image cutout from legacysurvey.org

This legacysurvey.org cutout (from the MzLS+BASS surveys) shows clearly a pair of tidal tails and some shells, clear signs of a recently consummated merger. The region covered by the IFU footprint on the other hand looks rather featureless:

8440-6104
Plateifu 8440-6104 (mangaid 1-216976) SDSS cutout with IFU footprint

In the remainder of this post I’ll look at a few measured, not too model dependent, properties of the IFU data. In future post(s) I’ll look at the results of star formation history models and other model dependent properties. One thing I’m interested in learning more about is if SFH models of merger remnants tell us anything about the chronology of mergers. We’ll see!

MaNGA data cubes include synthesized griz images created by projecting the spectra onto the filter transmission functions at each spaxel. Below is a g-i color map from these synthetic images, with the color corrected for galactic extinction but not any internal attenuation that might be present. There are hints of structure that indicate the merger remnant hasn’t quite reached equilbrium, but more importantly there is a clear positive color gradient with radius as seen on the right, with a turnover in the slope of the gradient at ≈2 kpc. A positive color gradient is the opposite of what would be seen in a normal disk galaxy, but exactly what we’d expect from the aftermath of a major merger with a centrally concentrated starburst.


colortrend_8440-6104
L: Synthetic g-i map from IFU data cube, plateifu 8440-6104 (mangaid 1-216976)
R: g-i color trend with radius

Several measured quantities are shown below. The input data for these were the stacked RSS files, with the measurements interpolated onto a fine grid for visualization. The velocity field (top left) has several interesting features. First, there is no apparent overall rotation, but the symmetrical pair of lobes with opposite velocity signs just outside the nucleus indicate the presence of a rotating disk or torus. These are known as “kinematically distinct cores” and are somewhat common in early type galaxies (for example Krajnovic et al. 2011), and are expected in some cases in major gas rich mergers (eg Bekki et al. 2005).

The other three panes of this plot are the equivalent width in absorption of the Balmer line Hδ (TR), the 4000Å break strength D\(_n\)(4000) (BL), and Hα emission equivalent width (BR). Hδ is a measure of Balmer absorption line strength and is sensitive to the presence of an intermediate age population. A threshold of around 5Å is usually used to select post-starburst galaxies (eg Goto 2005). My measured peak line strength is \(6.5 \pm 0.2 \)Å (the same as the MPA estimated emission corrected value for the SDSS fiber spectrum), and the inner \(\approx 1.5\) kpc. has Hδ > 5Å, with scattered regions at larger radius also exceeding this threshold (although measurement errors are much larger). However emission line strengths are too large in the central region for traditional K+A selection criteria, which usually require Hα equivalent width (in emission) \(\lesssim 3-5\)Å. I estimate the peak Hα equivalent with to be about 11Å (my code for this is still experimental and hasn’t been validated against other measurements. The MPA value for the SDSS fiber was 14Å. My absorption line index measurements and uncertainty estimates on the other hand agree very well with the MPA values, so I consider them well validated).

observables_8440-6104
Velocity field, Hδ equivalent width, 4000Å break strength, Hα emission equivalent width

The plot below shows a few properties of the emission lines. Hα luminosity declines monotonically with radius, with a fairly sharp transition at ≈2.5 kpc where Hβ is no longer securely detected. The peak luminosity would indicate a central star formation rate density of  \(\approx 0.1 \mbox{M}_{sun} \)/yr/kpc\(^2\) if the ionizing source is entirely young stars. This is almost certainly as much as 3 orders of magnitude lower than the star formation rate at the peak of the starburst.

Somewhat surprisingly, I don’t find this galaxy in any compilations of “transitional galaxies,” including for example the “SPOGS” sample of Alatalo et al. (2106). This is probably because the emission line ratios don’t quite meet their criteria for shocks as the dominant ionizing mechanism. The remaining 3 panes below show the 3 most popular BPT diagnositic diagrams for fibers within 2.5 kpc of the center (beyond that emission line ratios are too uncertain to display). Most of the points in the [N II]/Hα diagram (TR) fall in the so called “composite” region (Kauffmann et al. 2003), which was originally interpreted as indicating a mix of AGN and star formation as the source of ionization. While there might be a weak AGN present (there is a compact radio source visible in FIRST, which could indicate either an AGN or centrally concentrated star formation) it’s unlikely to be a significant ionizing source here. The other diagnostics mostly lie on the starforming side of the boundaries proposed by Kewley et al. (2006), while the handful of points on the Seyfert/LINER side of the boundaries are far from the nucleus. In fact all three sets of line ratios show a trend with radius that’s opposite of what would be expected if an AGN were a significant ionizing source.

bpt_8440-6104
Hα luminosity with radius and bpt diagnostic diagrams (inner 2.5 kpc only)

To conclude for now, this is a clear case of a galaxy rapidly transitioning in the aftermath of a major merger. Next up, I’ll look at the results of star formation history models, and speculate about how believable they are. Later perhaps I’ll look at other examples, and maybe discuss why the false positives happened.