
I’ve decided to resume SFH modeling despite still not having a fully satisfactory SSP model library. I’m still using the EMILES + PyPopstar hybrid that has served as the stellar input for several years now. The only change I’ve made — strictly for visualization purposes — is to define the stellar ages as representing the middle of each time interval instead of the end. In star formation rate plots this has the effect of smoothing out the SFR a little bit where there are abrupt jumps in time intervals. This has no effect on the modeling process at all.
One of the MaNGA ancillary programs (PI C. Tremonti) observed a sample of 24 candidate post starburst galaxies drawn from 5 different sources (both published and unpublished) with a variety of selection criteria. In addition to these there are 7 PSB’s from the compilation of Melnick and De Propris (2013) in the primary or secondary samples that I added to the sample for a total of 31. I was able to run successful models for 30 data sets, with one having severe calibration issues that I dropped from further analysis. Altogether there were 1,399 binned spectra in the sample with as usual a large range of bins per galaxy: in this case ranging from 6 to 240.
From a diverse set of selection criteria it’s not too surprising that the sample is rather diverse too, with perhaps a few false positives. I’m not sure it makes sense to treat this as a single homogeneous sample, but for now let’s take a look at a few features of the entire data set. I’ll also take a sneak peek at a particularly interesting pair of galaxies.
First, here is a popular absorption line diagnostic, the Lick HδA – Dn(4000 Å) plane. Points are colored by BPT diagnostic determined from the [N II]/Hα and [O III]/Hβ ratios by the usual criteria. The contours are from measurements of a large sample of SDSS galaxies by the MPA-JHU pipeline, which was run on spectra through DR8.
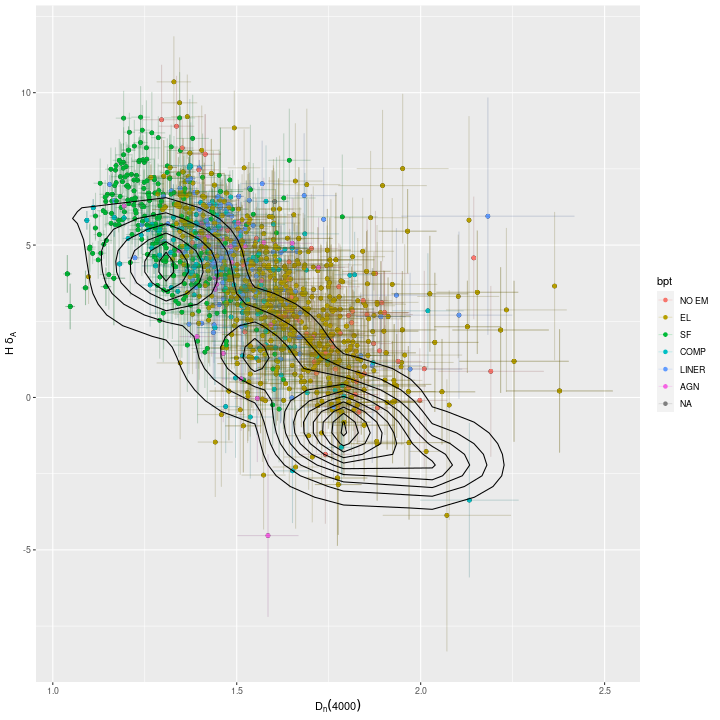
It seems odd that the bulk of the measurements in this sample are displaced from the bulk of the SDSS sample. I wouldn’t completely rule out errors in my measurements but I tested mine against the MPA-JHU measurements a long time ago, and this particular part of the code is unchanged for some time. Anyway, we see a large range of values of these diagnostics, but with relatively few in the passively evolving region at lower right and many in the “green valley.” Almost 1/3 have strong Balmer absorption with HδA > 5Å EW. Many of these also have star forming BPT diagnostics, so it’s not clear that these regions are post starbursts.
Next, here are (100 Myr averaged) star formation rates plotted against stellar mass density, again color coded by BPT diagnostic. The straight line is my calibration of the center of the “star forming main sequence” from some time ago.
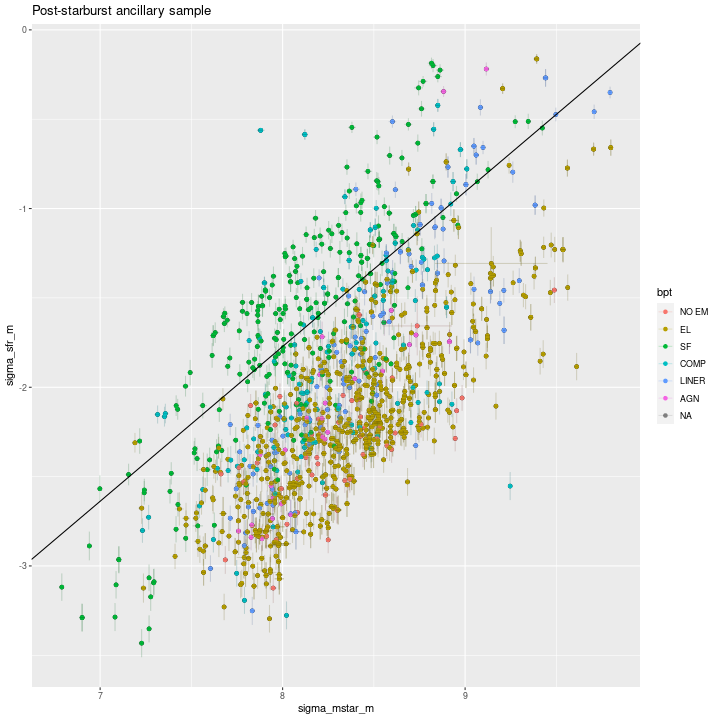
Evidently there are many regions — mostly with star forming emission line ratios — lying near the star forming main sequence, and also a large number in the green valley. Most of those have weak emission lines, AGN, or LINER-like ratios.
Finally, here is a plot of model specific star formation rate against Dn(4000Å). As I’ve written before a number of authors have noted the relation between the 4000Å break strength and stellar age or specific star formation rate and several have used it as a (usually secondary) star formation rate indicator. The straight line is my estimate of the mean relation for spiral galaxies, originally given in this post.
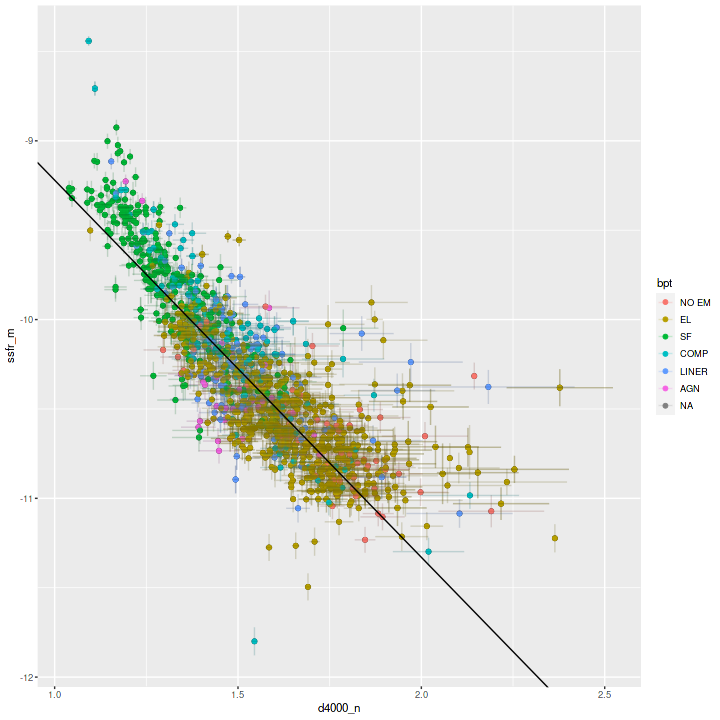
Evidently by these diagnostics this sample has properties that at least overlap with a random selection of normal galaxies. The only thing notably missing are “red and dead” ETGs. However there are good reasons to think that starbursts – and therefore post starbursts – are generally localized regions within galaxies. We need to look at the spatially resolved properties — specifically star formation histories — to see how many genuine post starburst galaxies are in the sample.
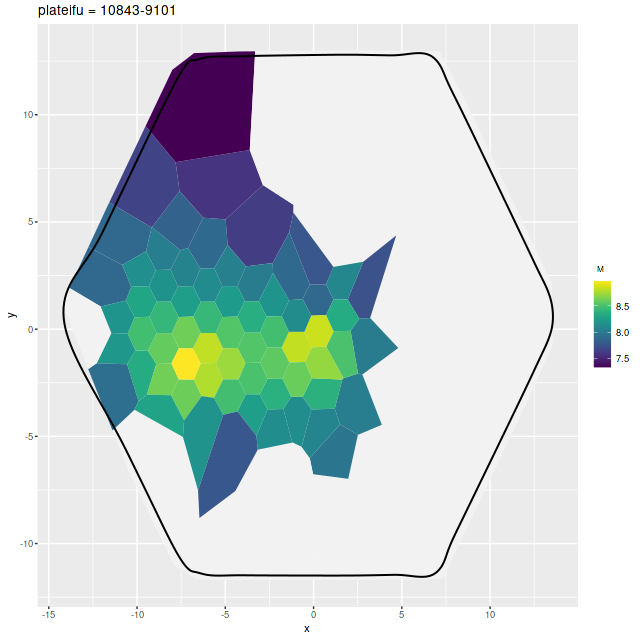
I’m going to end for now with one of the more interesting examples in this sample. The western member of this interacting pair has a remarkably bright and white nucleus, which in SDSS imaging indicates a fairly young stellar population.

I slightly altered my usual workflow for this and a few other data sets in this sample. Usually I try to use all spectra and bin to a minimum target SNR (usually 5) for all bins, but since this IFU had a large fraction of blank sky I set the SNR threshold for accepting a bin lower than I otherwise would and left the lowest SNR spectra out of the analysis. Below is a map of the modeled stellar mass density showing the coverage of the analyzed area.
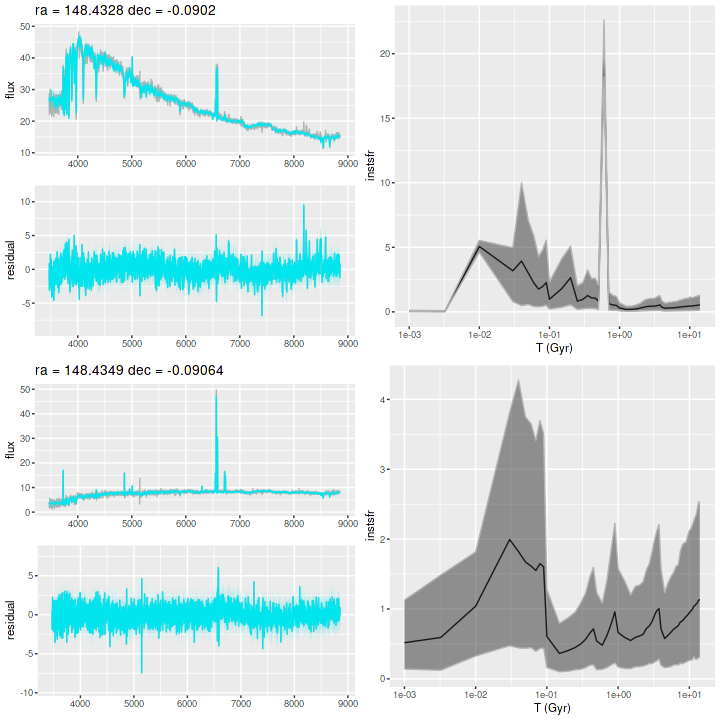
And for now I’ll just show the spectra of the two nuclear regions with posterior predictive fits of the SFH models, along with model star formation histories. The western nucleus has a remarkable K+A like spectrum but with fairly strong emission from a possible AGN. The model star formation history is one of the most unusual I’ve seen. Whether it’s an accurate record of events is of course uncertain.
I’m going to continue this topic in additional post(s), and perhaps look for a larger sample. A recent paper by Cheng et al. (2024) found nearly 500 galaxies with post starburst properties in MaNGA, but there seems to be no catalog. I’m not sure their selection criteria are easily reproduced.