What fraction of Schawinski’s “Blue early type galaxies” are ellipticals?

The first iteration of Galaxy Zoo led to several collections of distinct objects, including a sample of 215 “blue early type galaxies” published in Schawinski et al. (2009)1which inexplicably and consistently says there were 204 objects while the catalog published in Vizier contains 215.I found this an interesting group of galaxies, partly because of a possible link to post-starburst (K+A) galaxies that was discussed in the original paper. The authors discuss at some length the likelihood that these are results of mergers in the cosmologically recent past, with at least one of the progenitors being gas rich. Many (at least 25% and possibly more than half) were found to be currently starforming and the rest likely to have only recently ceased forming stars as inferred from their blue colors.

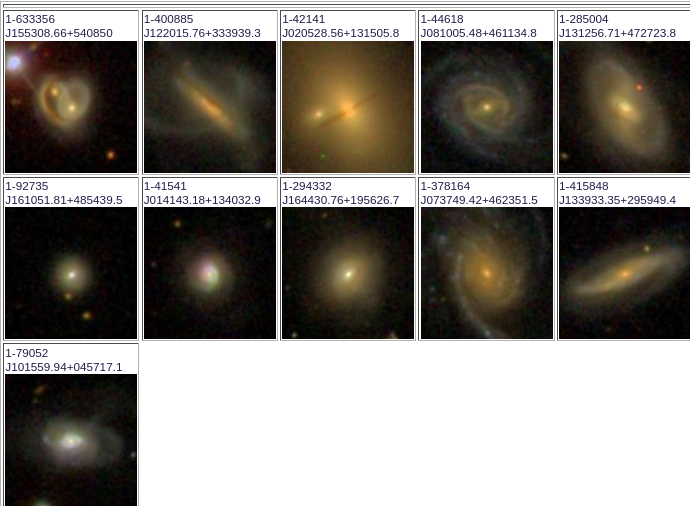
The ongoing Zoogems program has 12 of Schawinski’s blue ETGs on its target list, of which 6 have been observed so far as of mid-January 2022. Somewhat surprisingly there are 24 in the final MaNGA release, over 11% of the sample!

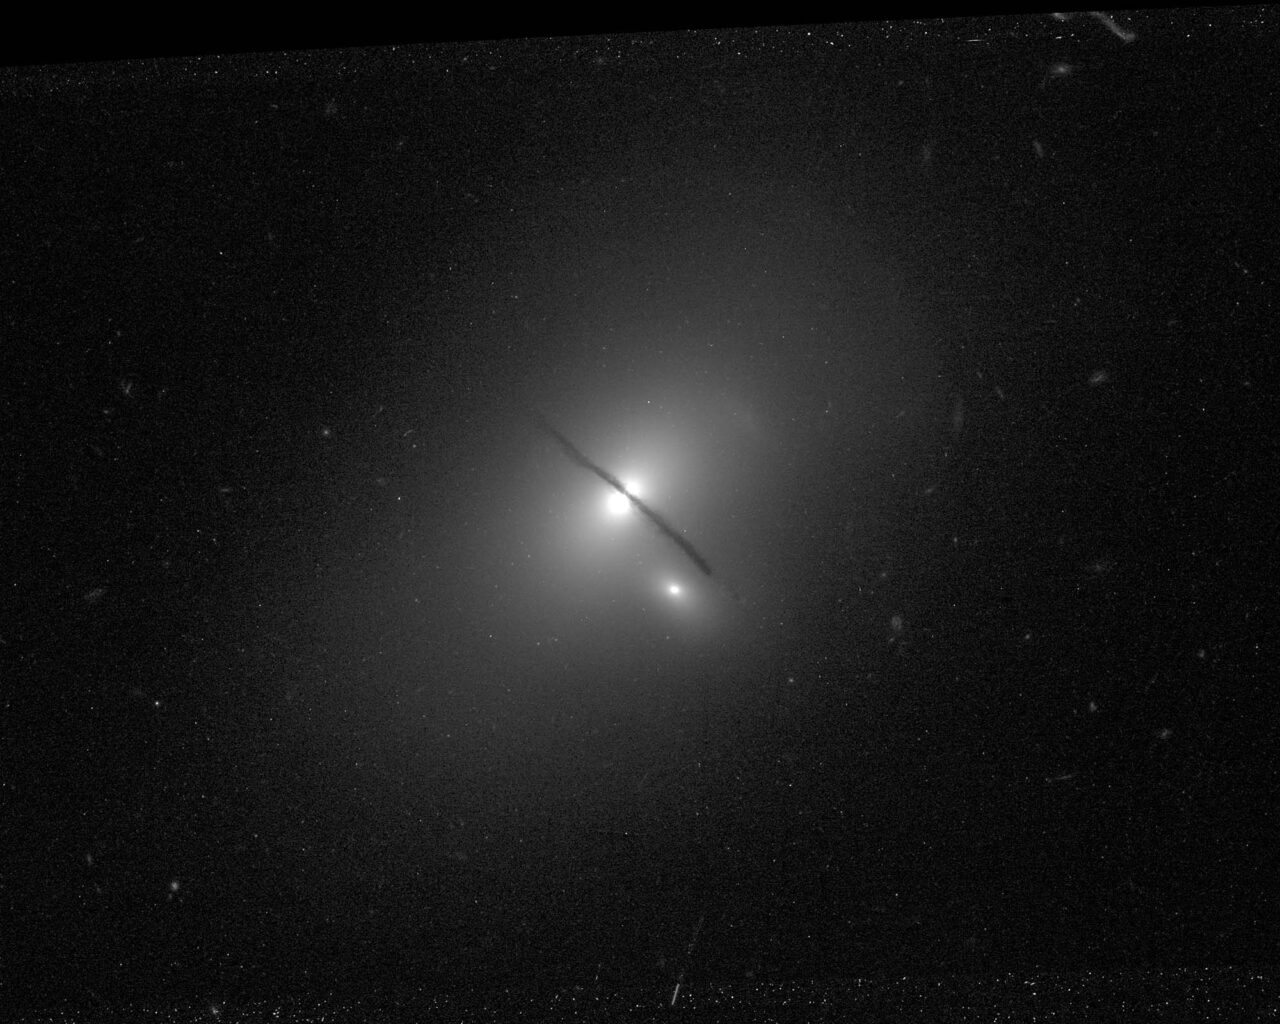
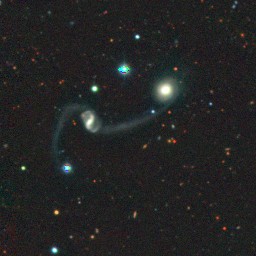
Taking a look at the 6 with HST observations I would say none of these are typical ellipticals. Five show some degree of spiral structure although in 4 it’s embedded in a more diffuse body. One appears to me to be an S0 with both inner and outer rings — this is in agreement with the one published morphological classification I’ve found. All of the others appear more disky than ellipsoidal to me, although this is just my possibly flawed qualitative judgment. At least two are visibly disturbed. One (CGCG 315-014) is connected to a nearby galaxy with a long tidal tail as seen in the Legacy Survey thumbnail below. Markarian 888, which will be the subject of the rest of this post, has shells that extend well past the main body of the galaxy and prominent, centrally concentrated dust lanes.

CGCG 315-014 Legacy Survey Thumbnail

So far it’s the only Zoogems blue etg target with a MaNGA observation (two others on the target list are in MaNGA but of course there’s no guarantee they will ever be observed). As is often the case the IFU could have been larger — this was observed with a 37 fiber bundle giving 111 dithered spectra in the RSS file.

MRK 888 SDSS thumbnail with MaNGA IFU footprint

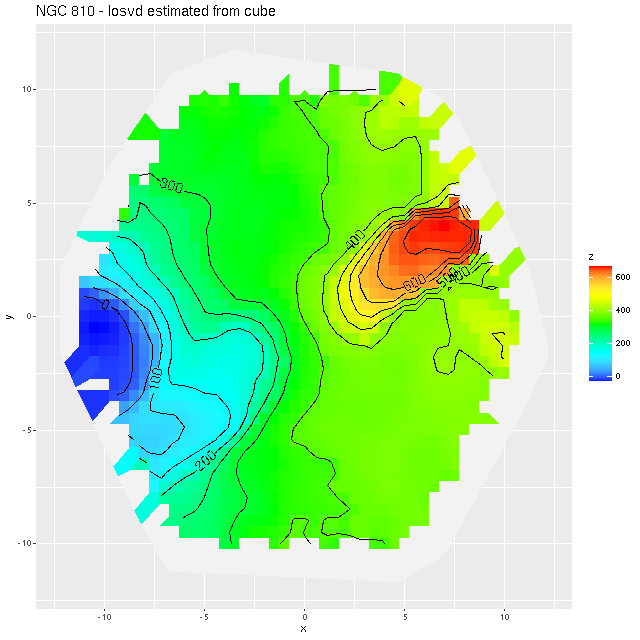
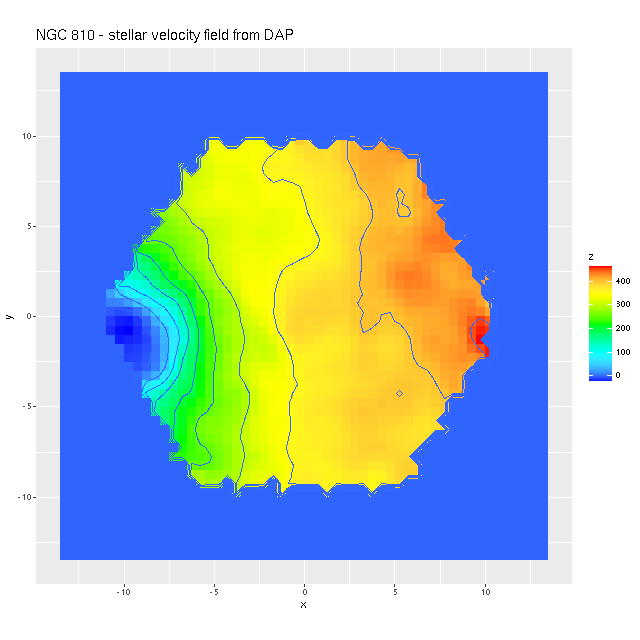
As always the first step in analyzing these data is to estimate redshift offsets for each spectrum, and from there we get a velocity field, which in this case shows a rapid rotator with a fairly symmetrical radial velocity pattern.

Mrk 888 (MaNGA plateifu 9894-3703) velocity field

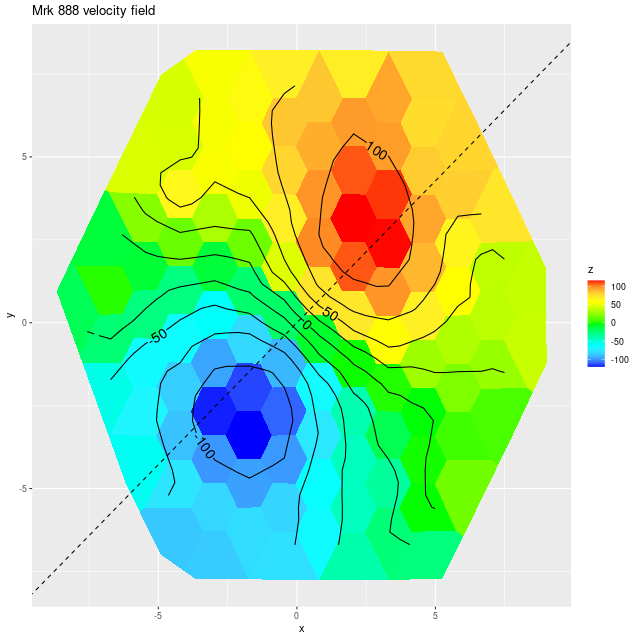
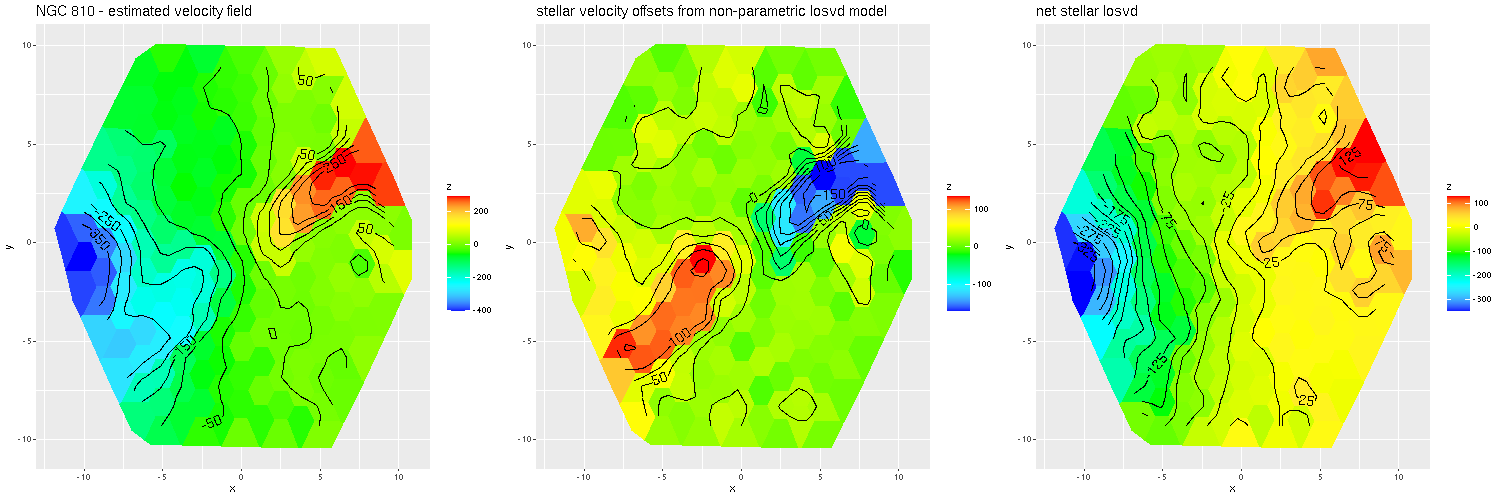
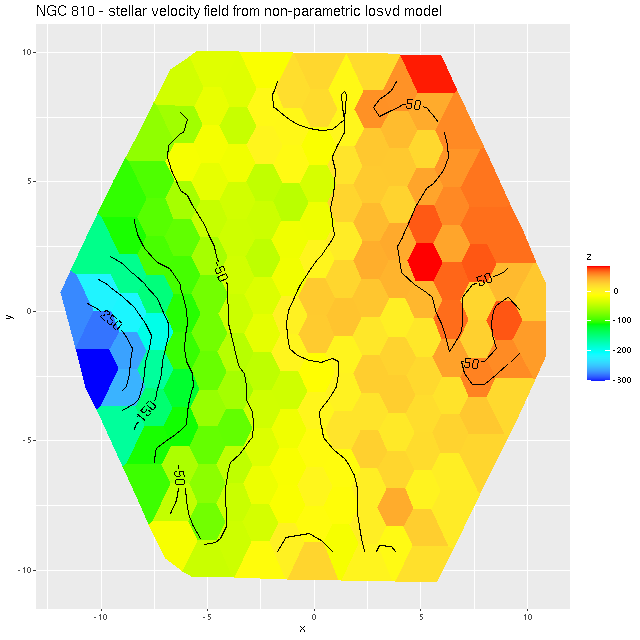
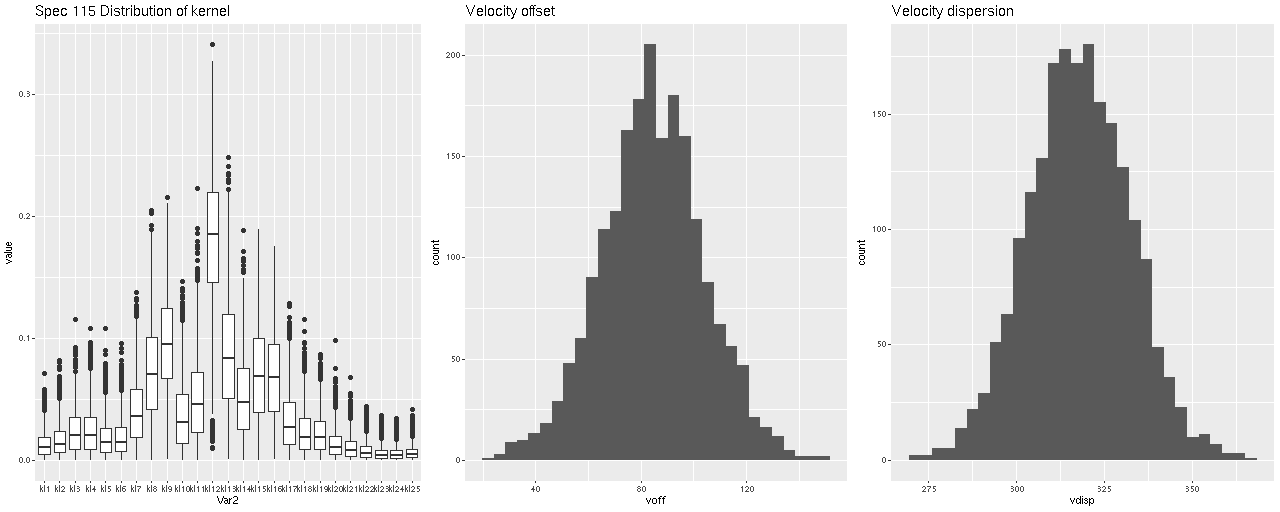
Visual inspection suggests the line of sight velocity distribution is consistent with a rotating thin disk, so I fed the data to my Gaussian process based rotation modeling code, with results summarized below. In fact the model does an excellent job of accounting for the data, with residuals (not shown) from the model fit (top right) in a range of ±15 km/sec. One unusual feature of the velocity field is the rotation velocity turns over at somewhat less than one effective radius. Whether the rotation curve declines smoothly outside the IFU footprint or is kinematically disconnected from the outer parts of the galaxy is of course unknowable at this time.

Gaussian process rotation model results

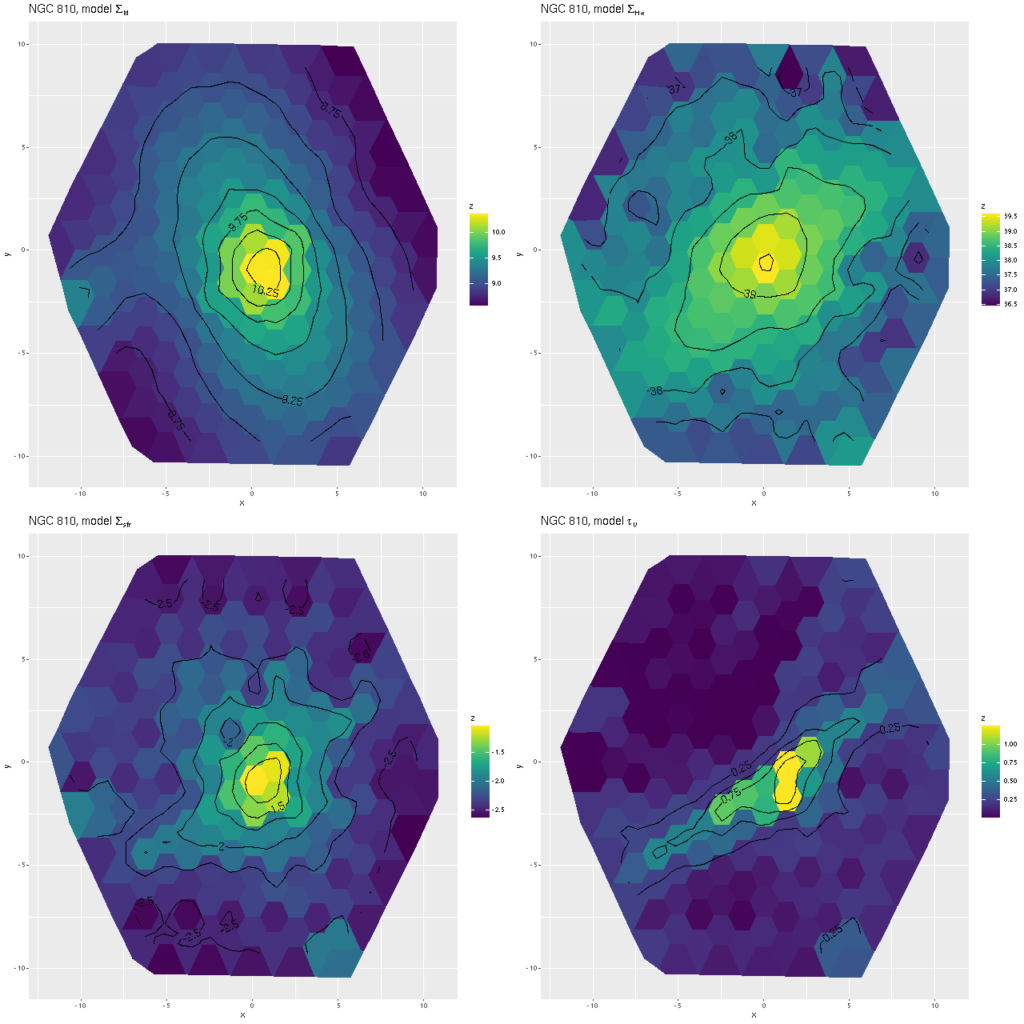
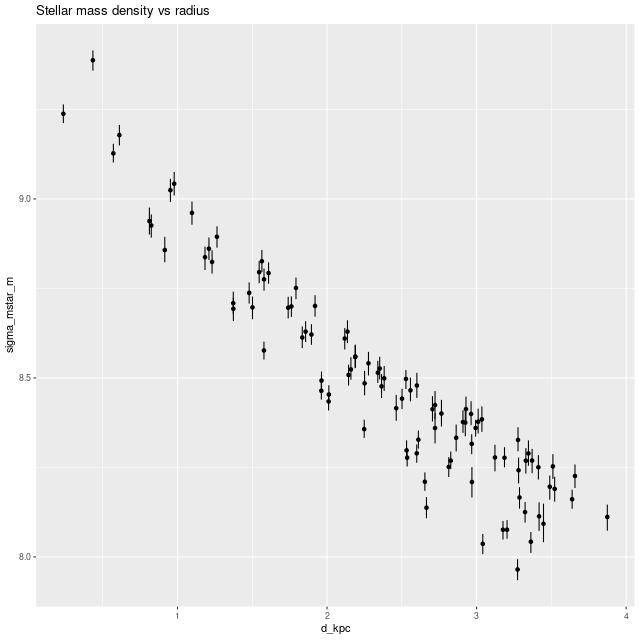
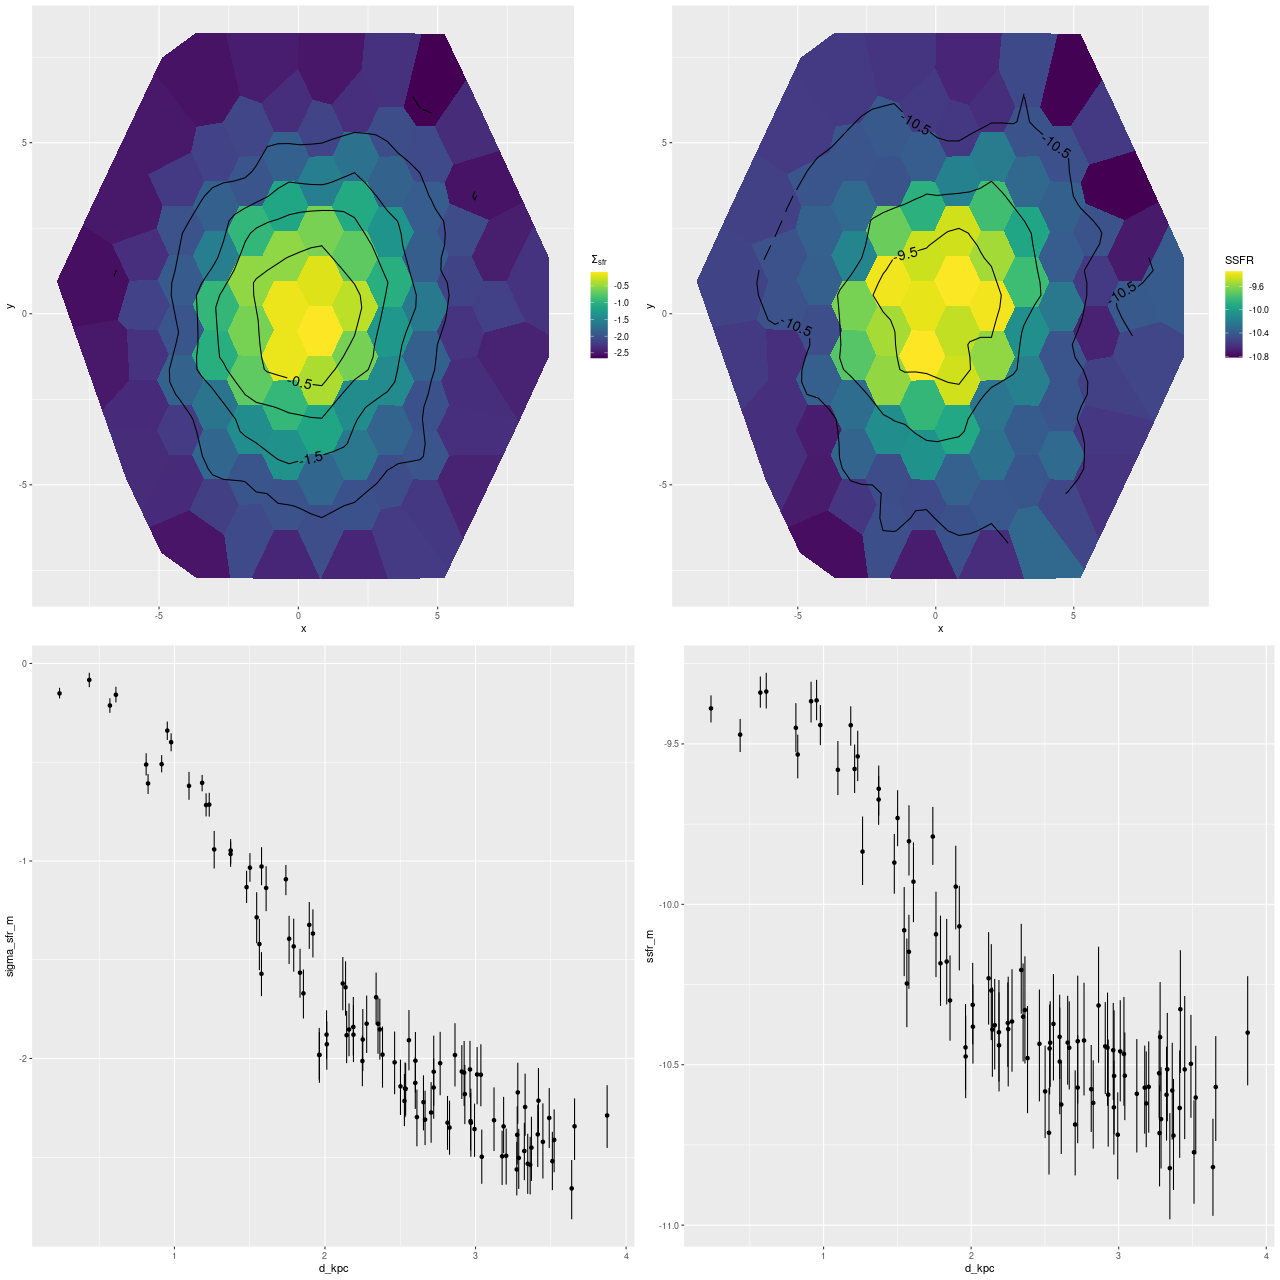
I also ran my usual star formation history modeling code on the data binned to 97 spectra. First, here are some summary results. The stellar mass density declines roughly exponentially, which is consistent with a disky morphology:

Model estimate of stellar mass density vs. radius

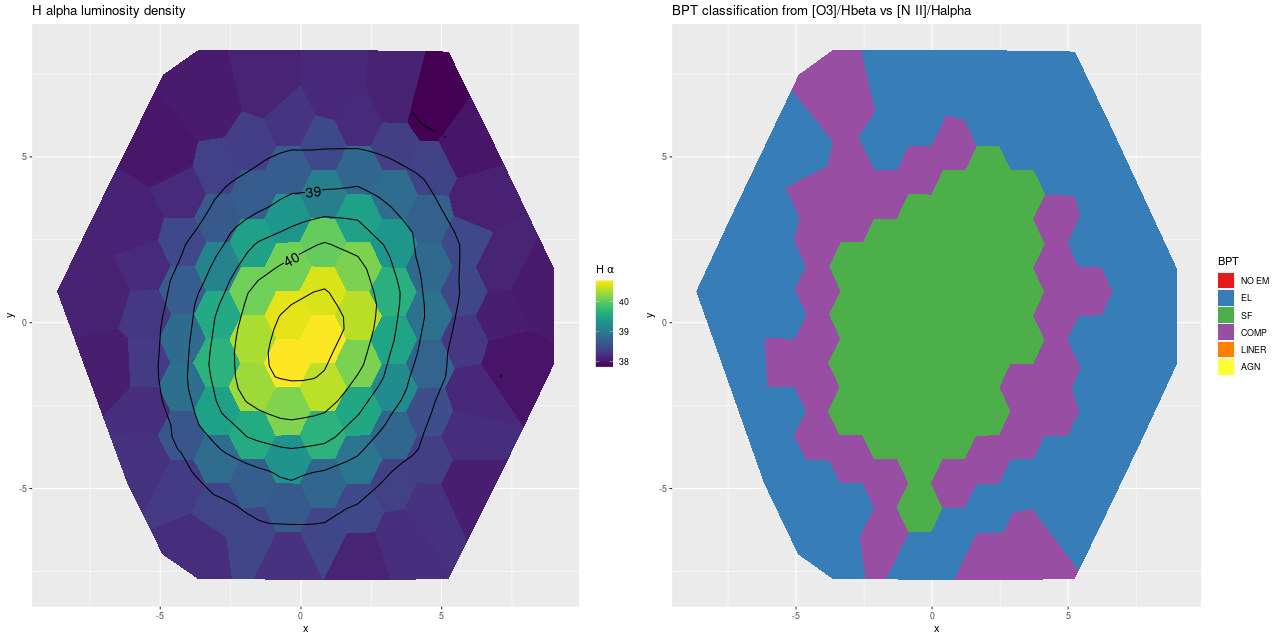
Next are maps of the estimated Hα luminosity density and, on the right, the BPT classification from the [O III]/Hβ vs. [N II]/Hα diagnostic. The contours are elliptical with major axes closely aligned to the rotation axis (the posterior mean for the angle is the dashed line in the velocity field plot above). Again, the emission appears to arise in a disk.

The proper interpretation of the “composite” BPT classification is something I think I’ve written about in the past. It was originally suggested to indicate a mix of AGN and stellar ionization, but here it arises in a thin ring of weak but detectable emission just outside the star forming region. If it’s truly composite it’s likely to arise from a mix of weak star formation and ionization by hot evolved stars. In any case there’s no evidence for an AGN in the optical data.

(L) Hα luminosity density (R) BPT classification from [O III]/Hβ vs {N II]/Hα diagnostic

Next are maps of the modeled (100 Myr average) star formation rate density and specific star formation rate, and in the second row scatter plots of the same estimates against radius in kpc. The trends with radius are somewhat unusual, especially for SSFR which in a normal disk galaxy typically increases with radius even if the highest total star formation rates are centrally concentrated. Highly centrally concentrated star formation in the aftermath of mergers is predicted by some simulations.

(TL) star formation rate density; (TR) specific star formation rate; (bottom row) scatter plots vs. radius

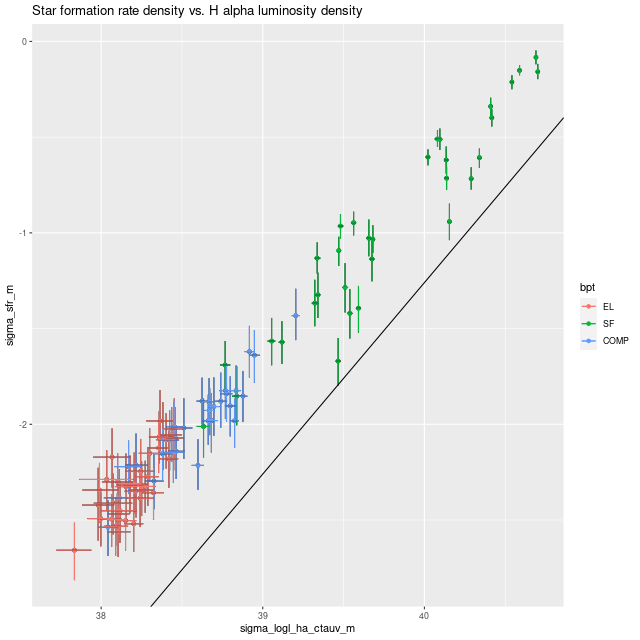
A couple more graphs will round out my discussion of summary model estimates. As I’ve shown several times before there’s a pretty tight linear relationship between modeled SFR density and estimated Hα luminosity density. In this plot Hα is corrected for modeled stellar attenuation, which is expected always to underestimate the attenuation in emission line emitting regions. That, and the fact that Hα emission and the model star formation rate estimates probe order of magnitude different time scales probably account for the systematic offset from the standard calibration given by the straight line.

Model star formation rate density vs. Hα luminosity density corrected for stellar attenuation. Straight line is calibration from Calzetti (2012).

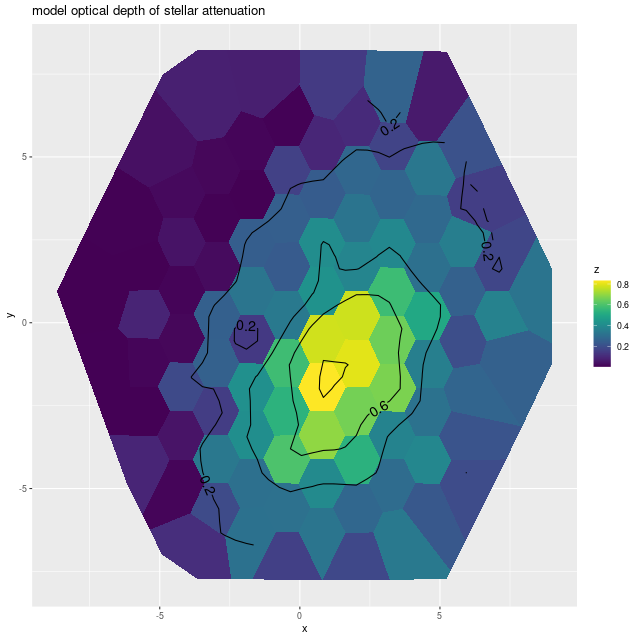
And, once again I show a map of the modeled optical depth of stellar attenuation. The region of highest optical depth nicely tracks the visible dust (the HST image at the top is rotated about 90º from the SDSS image). Outside the dusty region there appears to be a shallow gradient, which might indicate that the nearer side is to the northeast.

Map of modeled optical depth of stellar attenuation

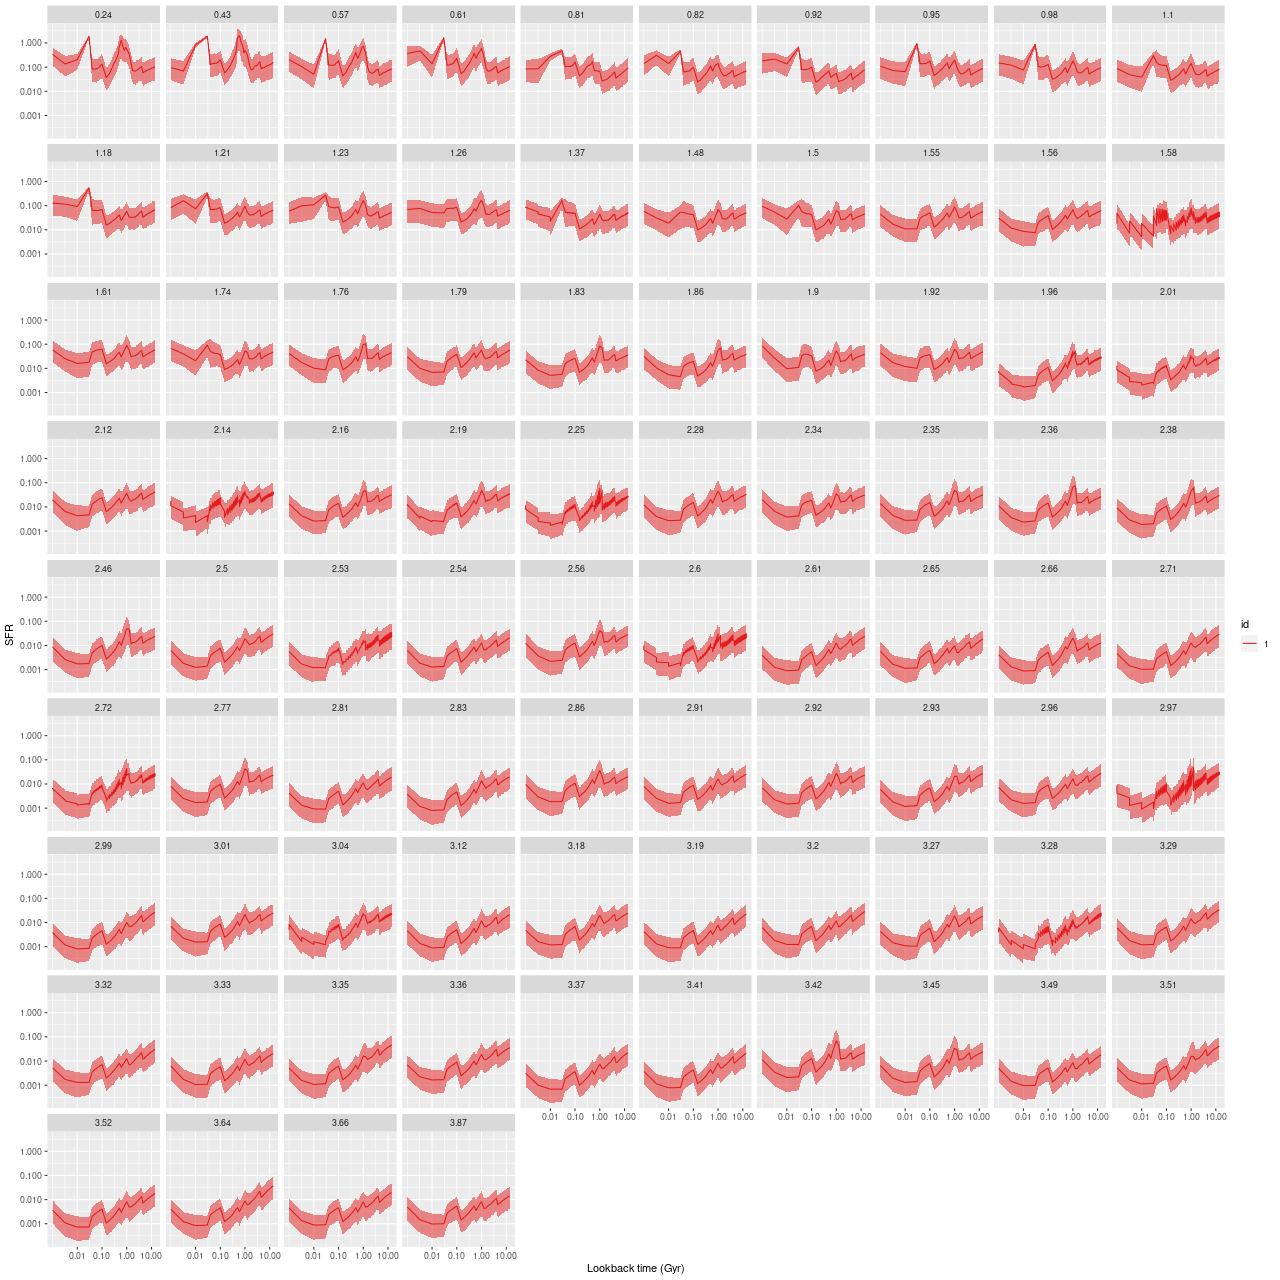
Finally here are plots of the model star formation history for all spectra ordered by distance from the IFU center. In the inner 1.5 kpc or so there’s some recent burstiness with possibly a very recent acceleration of star formation. For reasons I’ve discussed recently I don’t take either the timing or magnitude of bursts of star formation too seriously, but the behavior of the models is consistent with a recent revival of star formation due presumably to a merger, for which there are multiple lines of evidence.

model star fomation histories for all spectra

With 24 of these galaxies and another 31 from the compilation of Melnick and dePropris and the post-starburst ancillary program in the final release of MaNGA these samples satisfy my criteria of being manageably sized for my computing resources while large enough to say something about the groups. So, when time permits I plan to take a look. I already have the data in hand.

NGC 810 – interesting kinematics in a Zoogems and MaNGA target

The final release of SDSS MaNGA went public back in early December as promised, and I’ve spent the last month or so of my hobby time looking for manageable sized samples of interesting galaxies. One sample I looked at out of curiosity was the Zoogems target list, which is an HST gap filler imaging program with about 300 galaxies selected (mostly) by Galaxy Zoo volunteers. It turns out there are 11 targets with MaNGA data, of which 5 have been observed by HST so far.

thumbnails
SDSS thumbnail images of Zoogems targets with MaNGA data

As can be seen from the thumbnails above this is a pretty diverse lot, with several in progress mergers and merger remnants, some normal looking spirals at least two of which were from Masters’ red spirals sample, and 3 of Schawinski’s blue early type galaxies. Only one of those 3 has HST imaging so far (number 8 in the thumbnails above), although there are a surprising 24 blue ellipticals in the final MaNGA release out of 215 in Schawinski’s original sample.

Of the 5 Zoogems galaxies that have been observed so far the one that caught my eye as deserving an early look was number 3 in the top row, NGC 810, an apparent elliptical with an unusual dust lane that’s almost perfectly aligned with the minor axis. There are also hints of shells indicating a likely merger sometime in the past.

NGC 810 HST ACS, proposal id 15445, PI Keel

The MaNGA data, which is new in DR17, only covers the central part of the galaxy with the companion just photobombing the edge. A larger IFU would have been nice for this observation, but the data quality is better than average in terms of nominal signal to noise. I was able to use all 183 fiber/position combinations in the RSS file without binning.

NGC 810 – plateifu 9514-6101 – MaNGA IFU footprint

The first step in the analysis process after loading the data is to estimate redshift offsets from the system redshift for each spectrum, and from that it’s straightforward to calculate a velocity field, which in this galaxy looks like1this is actually from the data cube:

NGC 810 (plateifu 9514-6101) – losvd estimated from cube

It turns out the redshift assigned to this system was that of the companion galaxy, which was the only SDSS spectroscopic target in the immediate vicinity and is evidently blueshifted by ~350 km/sec from the target. What’s more interesting though2interesting enough that I made a couple posts on the Galaxy Zoo talk forum, which I rarely do anymore. is the apparent rapidly rotating disk that’s aligned with and somewhat thicker than the dust lane. There may also be overall prolate rotation outside the disk although the presence of the companion makes it hard to tell based solely on visual inspection. In hopes of separating out multiple velocity components I returned to the non-parametric line of sight velocity distribution models that I wrote some posts about last year. Unlike the ones I practiced on previously this galaxy has non-negligible amounts of emission, at least in the central region, so I just temporarily masked the regions around the emission lines that I fit. That results in a pure stellar velocity distribution. The results were a bit surprising:

NGC 810 (plateifu 9514-6101) (L) velocity field estimated from RSS file (M) stellar velocity offsets (R) net stellar velocity

In the left pane above is the velocity field from the RSS data, with the system redshift adjusted to the IFU center. For the LOSVD models I set the adopted redshift of each spectrum to the system redshift plus the offset calculated previously. Now I had hoped to be able to cleanly separate the contribution of the companion from that of the main galaxy, which so far I haven’t been able to do. But what I did find that was unexpected is that the average stellar velocities in the disk partially offset the original measurements (middle pane), so the net stellar velocity field shows a much more slowly rotating stellar disk.

As I’ve written before I use a set of 15 eigenspectra from a principal components analysis of some tens of thousands of SDSS spectra that I performed some years ago for redshift offset estimation. Those galaxies were of all types and include systems both with and without significant emission. The redshift estimation routine just does straightforward template matching and returns a single value for the best fitting offset. Since the templates encode information about both emission and absorption lines that estimate could be most applicable to the ionized gas, stars, or some combination. In this case it’s possible emission lines were driving the original fits, implying the gas and stars in the disk are kinematically decoupled. I have not verified that though.

Another issue I noticed is that the stellar velocity field from the official MaNGA Data Analysis Pipeline looks rather different from mine, with barely a hint of a kinematically distinct disk. This wasn’t really evident in the Marvin webpage, which makes some really unfortunate choices for color palettes. So here is the same data rendered with a more nearly perceptually uniform rainbow palette3I know data visualization experts frown on rainbows, but I think they’re OK for things like velocities or redshifts:

NGC 810 (plateifu 9514-6101) Stellar velocity field per MaNGA DAP

I decided to re-run my LOSVD modeling code on the RSS data, this time setting the redshift offset to 0 for each fiber, so this is now measuring velocities relative to the overall system velocity. I also used a larger convolution kernel (25 vs. 21 in the first set of runs). The map of the average velocity offsets is:

NGC 810 (plateifu 9514-6101) Stellar losvd from nonparametric model

Although not a perfect match this is somewhat closer to the DAP map. I suspect what’s happening here is that there really are at least two, and more likely 3 distinct kinematic components. I haven’t read the DAP release paper in a while and don’t know exactly how they estimate stellar velocities, but in any case their model just returns a single value for visualization purposes. To see the (possible) complexity of the actual data here are the results for a single fiber with the largest positive velocity offset in the map above. Again, I don’t know how much of the structure in the posterior distribution of the convolution kernel is real, but it’s evident there’s more complexity than is captured in the first two moments shown in the middle and right panes.

NGC 810 – sample nonparametric losvd

Besides the kinematic modeling I did run star formation history models on the full RSS data set using the same tools as in recent posts. I’m not going to discuss them in detail, but some summary maps are worth showing. In the graphic below these are, from top left, stellar mass density, Hα luminosity density uncorrected for attenuation, SFR density (as usual 100Myr average), and stellar dust attenuation.

There’s no sign of a disk in the stellar mass map, which faithfully follows the distribution of light. A disk is visible in Hα and the small amount of recent starformation is also confined to a disk and nuclear region. In the fourth pane I show the modeled stellar dust attenuation, mostly just to demonstrate that this component of the model does capture something of reality.

ngc810_model_summaries
NGC 810 – a sampling of quantities derived from star formation history models

Getting back briefly to the first paragraph, there are 8 post-starburst galaxies from the catalog of Melnick and de Propris and 24 from an ancillary program to observe post-starburst galaxies from various sources that was added for DR17. There’s just one galaxy from the former catalog in the latter set, so that makes 31 total, an easily manageable number. There are also 24 of Schawinski’s blue ellipticals. Of course there are many disk galaxies, far too many for me to look at.

Continue reading “NGC 810 – interesting kinematics in a Zoogems and MaNGA target”